From Smoot-Hawley to the 2026 Supreme Court tariff ruling — trace how tariff walls and trade bridges built the modern trading world in this visual
Latest Story
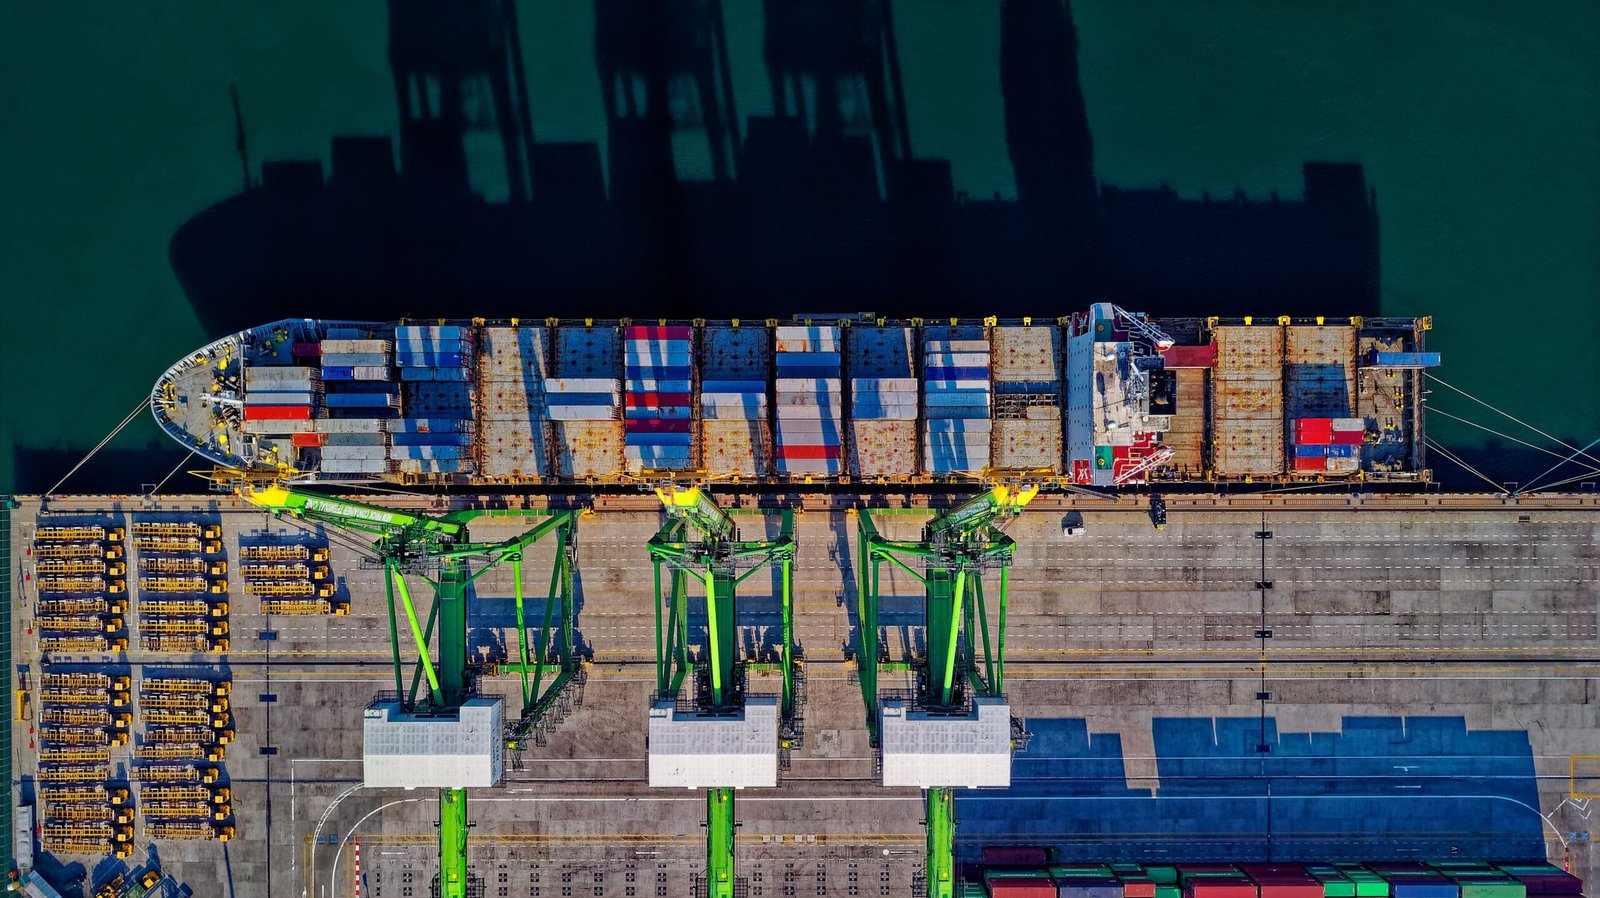
Tariff Walls and Trade Bridges: The Hidden Forces Reshaping Global Trade
A fact-checked global trade timeline — from Adam Smith to the 2026 Supreme Court tariff ruling.
Latest Update — September 2026
The US-Canada tariff fight escalated sharply after talks collapsed on August 21, 2026: Prime Minister Mark Carney said negotiators changed terms on truck tariffs at the eleventh hour, and the 50% US duties on Canadian autos, dairy, and alcohol took effect August 22, 2026. Canada matched them dollar-for-dollar with its own 15–50% tariffs on US steel, dairy, appliances, farm equipment, pulp, paper, and electronics, effective September 8, 2026. The same day, President Trump signed five further proclamations moving beyond tariffs entirely — banning imports of Canadian beer, wine, spirits, and whisky, plus dairy and motorcycles, effective September 29, 2026 (some bulk wine is exempt). Separately, the 25-state lawsuit against the Section 301 forced-labor tariffs is now proceeding jointly with the Learning Resources and import-company challenges before the Court of International Trade, with no ruling yet as of mid-September 2026.
Quick Facts: Global Trade by the Numbers
| Metric | Value | Source |
|---|---|---|
| World Trade (2025) | $34.65 Trillion | WTO |
| US Avg Tariff Rate (2025) | 17.4% — highest since 1935 | Yale Budget Lab |
| Tariff Cost per Household (2025) | ~$2,300 | Yale Budget Lab |
| WTO Founded | January 1, 1995 | WTO |
| WTO Members | 166 | WTO |
| China Joined WTO | December 11, 2001 | WTO |
| Smoot-Hawley Peak Duty | ~59% average | US tariff records |
| Services Share of Trade (2025) | 27.6% | WTO |
| Supreme Court Tariff Ruling | Feb 20, 2026 (6–3) | U.S. Supreme Court |
| Importer Refunds Ordered | ~$166 Billion | CBP / court filings |
| Tariff Authority After Ruling | Section 122 (Feb–Jul 2026) → Section 301 (from Jul 24, 2026) | USTR / CBP |
| Refunds Accepted for Processing (Jul 31, 2026) | ~$128.68 Billion | CBP |
| US Avg Tariff Rate (Aug 2026) | ~11.8% | Yale Budget Lab |
Quick Answers: Tariff Walls & Trade Bridges Explained
What are tariff walls?
Tariff walls are taxes governments impose on imported goods to make them costlier than domestic products. They protect local industries, preserve jobs, and raise revenue — but they also raise consumer prices and invite retaliation. The 1930 Smoot-Hawley Act and the 2018–2025 US-China tariffs are the most famous modern examples.
What are trade bridges?
Trade bridges are agreements and institutions that lower barriers and link economies together. They include free trade agreements, customs unions, and bodies like the WTO. By cutting tariffs and harmonizing rules, trade bridges let goods, services, and capital move more freely — the EU Single Market and USMCA are leading examples.
Why do countries impose tariffs?
Countries impose tariffs to protect domestic industries from cheaper imports, defend strategic jobs, raise revenue, narrow trade deficits, and gain negotiating leverage. National security — protecting steel, semiconductors, or rare earths — and retaliation against unfair practices are increasingly common justifications in the 2020s.
Who benefits from tariffs?
Protected domestic producers and their workers benefit most, gaining breathing room from foreign competition. Governments collect revenue, and rival exporting nations — like Vietnam, Mexico, and India during the US-China conflict — can win redirected orders. Consumers and import-reliant businesses usually lose through higher prices.
What are the risks of protectionism?
Protectionism risks higher inflation, retaliatory trade wars, weakened export industries, and slower long-run growth. Smoot-Hawley showed how tariff walls can cascade globally, helping shrink world trade by two-thirds during the Great Depression. Protected industries can also grow complacent and less competitive over time.
Before the federal income tax arrived in 1913, tariffs funded the bulk of the US government — in some years supplying more than 90% of federal revenue. Tariffs were not just trade policy; they were how America paid its bills for over a century.
The 5 Biggest Trade Turning Points in History
If you read nothing else, these five events bent the entire trajectory of global trade.
Smoot-Hawley
Tariff walls that helped crash world trade by two-thirds.
Bretton Woods
Built the IMF, World Bank, and dollar-led order.
GATT
Began the great postwar tariff wind-down.
WTO
Gave global trade an enforceable rulebook.
US-China Trade War
Ended the bipartisan free-trade consensus.
The Complete Global Trade Timeline (Latest Events First)
Milestone Turning Point Outlook
Outlook
The Regionalized, Digital, Greener Trade Order of 2030
By 2030, economists expect global trade to be more regional, more digital, and more politically managed than the hyper-globalized model of 2001–2018. Supply chains are diversifying under “China-plus-one” and friendshoring strategies, with India, Vietnam, and Mexico absorbing redirected manufacturing. Services and digital trade — already 27.6% of the total in 2025 — keep climbing as AI, cloud, and cross-border data become core exports. New “green tariff walls” like the EU’s Carbon Border Adjustment Mechanism (CBAM), fully in force from 2026, tie market access to emissions.
- Key Facts
- Regional & friend-aligned blocs replace single-source supply chains
- Digital and services trade the fastest-growing segment
- EU carbon border tax (CBAM) live from 2026
Turning Point
Reciprocal Tariffs, Friendshoring, and the Supreme Court Reckoning
The United States escalated tariffs sharply in 2025. A 10% tariff on all Chinese goods took effect February 4, doubled to 20% by March, and on April 2 — branded “Liberation Day” — the administration announced sweeping “reciprocal” tariffs on nearly all trading partners. The average effective US tariff rate peaked near 28% before settling around 17.4%, the highest since 1935, costing the typical household an estimated $2,300. After a tense escalation over rare-earth export controls, Presidents Trump and Xi struck a de-escalation deal at the Busan summit on October 30, 2025. Then, on February 20, 2026, the Supreme Court ruled 6–3 in Learning Resources, Inc. v. Trump that the IEEPA does not authorize tariffs, invalidating the reciprocal and fentanyl duties. The administration pivoted within days, invoking Section 122 of the Trade Act of 1974 to impose a 150-day, 10% global import surcharge from February 24, 2026. When that authority expired by law on July 24, 2026, it was replaced the same minute by new Section 301 duties of 10–12.5% on roughly 80 countries covering over 99% of US imports — an authority with no statutory rate cap or time limit. Meanwhile China joined Brazil’s WTO challenge against US forced-labor-linked tariffs on August 10, 2026, keeping the dispute in international as well as domestic courts. A coalition of 25 states sued the administration in the Court of International Trade on August 3, 2026, calling the Section 301 forced-labor tariffs an unlawful attempt to revive the levies the Supreme Court had already struck down; that suit is now proceeding jointly with the earlier Learning Resources and import-company challenges. Days later, Washington opened a new front with Canada: three proclamations signed July 20, 2026 imposed 50% tariffs on a broad range of Canadian dairy, auto, and alcohol-linked goods, briefly paused for three days pending a trade deal. Talks collapsed on August 21, 2026 — Prime Minister Mark Carney said US negotiators altered truck-tariff terms at the last minute — and the 50% duties took effect August 22, 2026. Canada matched them dollar-for-dollar with 15–50% counter-tariffs on US steel, dairy, appliances, farm equipment, pulp, paper, and electronics from September 8, 2026. That same day, Trump signed five more proclamations escalating beyond tariffs to an outright ban on Canadian beer, wine, spirits, whisky, dairy, and motorcycles, effective September 29, 2026.
- Key Facts
- Effective tariff peaked ~28%, settled at 17.4% in 2025 (highest since 1935)
- Supreme Court struck down IEEPA tariffs 6–3 on Feb 20, 2026
- Replaced by Section 122 (Feb–Jul 2026), then Section 301 duties on ~80 countries (from Jul 24, 2026)
- ~$128.68 billion in refunds accepted for processing by CBP (Jul 31, 2026)
- US-Canada talks collapsed Aug 21, 2026; 50% Canada tariffs live Aug 22; Canada counter-tariffs Sept 8; US bans Canadian alcohol, dairy & motorcycles from Sept 29, 2026
Turning Point
Russia’s Invasion of Ukraine Weaponizes Trade
Russia’s full-scale invasion of Ukraine on February 24, 2022 turned trade and finance into instruments of war. Western nations cut major Russian banks off from the SWIFT messaging system, froze central-bank reserves, and imposed sweeping export controls. Europe scrambled to replace Russian natural gas, reshaping global energy flows toward US LNG and Gulf suppliers. Ukraine and Russia’s role as breadbaskets sent wheat and fertilizer prices soaring, hitting import-dependent nations across Africa and the Middle East. US Treasury Secretary Janet Yellen used the moment to popularize “friendshoring.”
- Key Facts
- Major Russian banks cut from SWIFT; reserves frozen
- Europe pivoted away from Russian gas to US LNG
- “Friendshoring” popularized by Janet Yellen
Turning Point
The Pandemic Breaks the Just-in-Time Supply Chain
COVID-19 exposed how fragile hyper-optimized global supply chains had become. Factory shutdowns, port congestion, and a historic semiconductor shortage left carmakers idle and shelves empty, while shipping costs spiked many times over. The crisis revealed dangerous concentration risk — too much of the world’s medical supplies, electronics, and active pharmaceutical ingredients came from a handful of locations. Companies began shifting from “just-in-time” toward “just-in-case” inventory and diversified sourcing. The same year, the USMCA took effect on July 1, 2020, replacing NAFTA with stricter rules of origin and new labor standards.
- Key Facts
- Global chip shortage idled auto and electronics factories
- Sourcing shifted from “just-in-time” to “just-in-case”
- USMCA replaced NAFTA on July 1, 2020
Turning Point
The US-China Trade War Begins
In 2018 the United States launched the largest trade conflict in decades, citing intellectual-property theft, forced technology transfer, and a vast bilateral deficit. Using Section 301, Washington imposed tariffs starting with $34 billion of Chinese goods in July 2018, escalating to roughly $360 billion by 2019. China retaliated on about $110 billion of US exports, hitting soybeans and other farm goods hardest. A “Phase One” truce signed January 15, 2020 paused the escalation but left most tariffs in place. The conflict shattered the assumption that China’s WTO integration would steadily liberalize its economy.
- Key Facts
- Section 301 tariffs began with $34B of Chinese goods (July 2018)
- Escalated to ~$360B of imports; China retaliated on ~$110B
- “Phase One” deal signed January 15, 2020
Milestone
The Global Financial Crisis and the Great Trade Collapse
The 2008 financial crisis triggered the sharpest trade contraction since the Great Depression — world merchandise trade volume fell roughly 12% in 2009 in what economists call the “Great Trade Collapse.” As credit froze, trade finance dried up and demand cratered simultaneously across every major economy. Yet unlike the 1930s, leaders largely resisted a Smoot-Hawley-style tariff spiral: the newly empowered G20 pledged to avoid protectionism and coordinate stimulus. The crisis nonetheless dented faith in unfettered globalization and stalled the WTO’s Doha Round.
- Key Facts
- World trade volume fell ~12% in 2009
- G20 coordination prevented a 1930s-style tariff spiral
- WTO Doha Round stalled indefinitely
Milestone
China Joins the WTO and Remakes Global Manufacturing
China’s accession to the World Trade Organization on December 11, 2001 was arguably the single most consequential trade event of the modern era. Granted predictable, low-tariff access to world markets, China rapidly became the world’s factory — overtaking Germany as the largest exporter by 2009 and the largest trading nation by 2013. Hundreds of millions were lifted out of poverty, and consumers worldwide enjoyed cheap manufactured goods. But the “China Shock” also hollowed out manufacturing regions in the US and Europe, displacing workers faster than they could be retrained.
- Key Facts
- Joined the WTO on December 11, 2001
- World’s largest exporter by 2009, largest trading nation by 2013
- The “China Shock” displaced Western factory workers
Milestone
The World Trade Organization Is Born
On January 1, 1995, the World Trade Organization replaced the GATT, capping the Uruguay Round (1986–1994) — the most ambitious trade negotiation in history. Unlike the GATT, the WTO had teeth: a binding dispute-settlement system with an Appellate Body that could authorize retaliation against rule-breakers. Its remit expanded beyond goods to services (GATS) and intellectual property (TRIPS). The WTO became the institutional backbone of globalization, growing to 166 members — until the Appellate Body was paralyzed in 2019 by a US blockade of new judges.
- Key Facts
- Founded January 1, 1995, replacing the GATT
- First binding global dispute-settlement system
- Expanded rules to services (GATS) and IP (TRIPS)
Milestone
The Treaty of Rome Launches European Integration
On March 25, 1957, six nations — France, West Germany, Italy, Belgium, the Netherlands, and Luxembourg — signed the Treaty of Rome, creating the European Economic Community. The EEC built a customs union: tariffs between members were abolished and a common external tariff erected around them. Over the following decades this deepened into the world’s most ambitious trade bridge, the EU Single Market (1993), guaranteeing free movement of goods, services, capital, and people. The community that began with six members grew into the European Union, today a single market of around 450 million consumers.
- Key Facts
- Six founding members signed the Treaty of Rome
- Created a customs union with a common external tariff
- Evolved into the EU Single Market (1993)
Milestone
GATT Begins the Great Postwar Tariff Wind-Down
Signed by 23 nations on October 30, 1947 and effective January 1, 1948, the General Agreement on Tariffs and Trade was the world’s first multilateral framework for cutting tariffs. Born from the lesson of Smoot-Hawley, GATT enshrined the “most-favored-nation” principle — a concession granted to one member must be extended to all. Across eight negotiating rounds over 47 years, average tariffs on manufactured goods in advanced economies fell from around 40% to under 5%. GATT presided over the greatest sustained expansion of trade in human history.
- Key Facts
- 23 founding nations signed in 1947
- Average manufacturing tariffs fell from ~40% to under 5%
- Eight negotiating rounds over 47 years
Milestone
Bretton Woods Builds the Postwar Economic Architecture
In July 1944, delegates from 44 nations gathered at Bretton Woods, New Hampshire, to design the economic order that would follow World War II. They created two enduring institutions: the International Monetary Fund (IMF) to stabilize exchange rates and rescue countries in crisis, and the World Bank to finance reconstruction and development. The system fixed currencies to the US dollar, convertible to gold at $35 an ounce — anchoring global finance until the US ended convertibility in 1971.
- Key Facts
- 44 nations met at Bretton Woods, New Hampshire
- Created the IMF and the World Bank
- Fixed currencies to a gold-backed US dollar
Turning Point
Smoot-Hawley: The Tariff Wall That Backfired
Signed by President Hoover in June 1930, the Smoot-Hawley Tariff Act raised US duties on more than 20,000 imported goods, pushing the average tariff on dutiable imports toward 59% — despite a petition signed by over 1,000 economists begging him to veto it. The response was swift and devastating. Canada, France, and others retaliated with their own tariff walls, and global trade went into freefall, collapsing by roughly two-thirds between 1929 and 1934. Smoot-Hawley became the enduring cautionary tale of protectionism gone wrong.
- Key Facts
- Raised duties on 20,000+ goods; ~59% average on dutiable imports
- Over 1,000 economists petitioned against it
- World trade fell roughly two-thirds (1929–1934)
Milestone
The Founding Debate: Free Trade vs Protection
The intellectual battle between walls and bridges is as old as modern economics. In 1776, Adam Smith’s The Wealth of Nations argued that free trade and specialization enrich all nations, a case David Ricardo sharpened in 1817 with the theory of comparative advantage. Yet practice often defied theory. Alexander Hamilton’s 1791 Report on Manufactures urged tariffs to protect America’s “infant industries,” and the young United States grew behind some of the highest tariff walls in the world. Britain charted the opposite course, repealing its protectionist Corn Laws in 1846.
- Key Facts
- Adam Smith’s Wealth of Nations (1776) made the free-trade case
- Hamilton’s 1791 report defended infant-industry tariffs
- Britain repealed the Corn Laws in 1846
10 Things to Know About Global Trade
- The World Trade Organization (WTO) sets and enforces global trade rules and has 166 members.
- Tariffs are taxes on imports — usually paid by importers and passed to consumers, not by foreign exporters.
- The 1930 Smoot-Hawley Act helped shrink world trade by roughly two-thirds during the Great Depression.
- Bretton Woods (1944) created the IMF and the World Bank, the pillars of global finance.
- China joined the WTO on December 11, 2001, becoming the world’s largest exporter by 2009.
- The US-China trade war began in 2018 and permanently reshaped global supply chains.
- Global trade hit a record $34.65 trillion in 2025, with services the fastest-growing segment.
- US tariffs averaged 17.4% in 2025 — the highest level since 1935.
- On February 20, 2026, the US Supreme Court struck down the IEEPA tariffs in a 6–3 ruling.
- “Friendshoring” — moving supply chains to allied nations — is the defining trade trend of the 2020s.
Tariff Walls vs Trade Bridges: Side-by-Side
| Dimension | Tariff Walls (Protectionism) | Trade Bridges (Free Trade) |
|---|---|---|
| Purpose | Shield domestic industry, raise revenue, gain leverage | Open markets, lower costs, deepen integration |
| Benefits | Protects infant industries & strategic jobs; bargaining chip; revenue | Lower prices, efficiency, growth, wider consumer choice |
| Risks | Retaliation, inflation, trade wars, inefficiency | Job displacement, import dependence, hollowed-out sectors |
| Economic Impact | Higher prices, GDP drag, distorted supply chains | GDP growth, but unevenly distributed gains |
| Consumer Impact | Higher prices, less choice | Cheaper goods, more variety |
| Examples | Smoot-Hawley (1930), US-China tariffs (2018–25) | EU Single Market, USMCA, GATT/WTO |
⚠️ Real-world trade policy almost always blends both forces — most nations run selective tariff walls while joining trade bridges for other sectors.
Four Case Studies That Defined Modern Trade
1. The US-China Trade War (2018–2026)
Background: A widening US trade deficit, allegations of intellectual-property theft and forced technology transfer, and fears over China’s state-led industrial rise pushed Washington to abandon engagement for confrontation.
Timeline: Section 301 tariffs began July 2018; escalation through 2019; Phase One deal January 2020; sweeping 2025 reciprocal tariffs; Busan de-escalation October 2025; Supreme Court strikes down IEEPA tariffs February 2026.
Key Lesson: Tariffs rarely shrink a bilateral deficit and are largely paid at home — but they can permanently accelerate supply-chain diversification away from the targeted country.
2. The EU Single Market — The World’s Deepest Trade Bridge
Background: Born from the 1957 Treaty of Rome and completed as a single market in 1993, the EU eliminated internal barriers across goods, services, capital, and labor among its members.
Timeline: EEC customs union (1957–68); Single European Act (1986); Single Market launch (1993); euro currency (1999); eastward enlargement (2004); Brexit (2020).
Key Lesson: Deep integration delivers enormous economic gains, but the loss of national control is politically combustible — prosperity alone does not guarantee public consent.
3. India’s Trade Policy — From License Raj to Strategic Balance
Background: After decades of inward-looking protectionism, a 1991 balance-of-payments crisis forced India to liberalize — dismantling the “License Raj,” cutting tariffs, and opening to foreign investment.
Timeline: 1991 reforms; WTO founding member (1995); services and IT export boom (2000s); withdrawal from RCEP talks (2019); Production-Linked Incentive (PLI) schemes and selective tariff hikes (2020s).
Key Lesson: India shows the appeal — and difficulty — of a middle path: opening enough to grow while shielding sensitive sectors, now positioning as a friendshoring beneficiary.
4. China’s Belt and Road Initiative — Trade Bridges as Geopolitics
Background: Launched by President Xi Jinping in 2013, the Belt and Road Initiative (BRI) finances ports, railways, and energy projects across Asia, Africa, Europe, and Latin America to bind partners to Chinese trade and capital.
Timeline: Announced 2013; peak lending late 2010s; debt-sustainability concerns and project pullbacks (2020s); pivot toward “smaller and greener” projects.
Key Lesson: Trade bridges are never purely economic — infrastructure and lending are powerful tools of strategic influence, prompting Western counter-initiatives.
Key Takeaways: Global Trade at a Glance
- Tariff walls protect and bridges connect — every nation blends both, and the balance shifts with politics, crises, and great-power rivalry.
- Smoot-Hawley (1930) remains the defining warning: tariff walls can trigger retaliation that shrinks trade for everyone.
- The postwar bridges — Bretton Woods (1944), GATT (1947), the EEC (1957), and the WTO (1995) — drove the greatest expansion of trade in history.
- China’s 2001 WTO entry reshaped global manufacturing, lifting hundreds of millions from poverty while hollowing out factory towns in the West.
- The 2018 US-China trade war ended the free-trade consensus; security and resilience now rival efficiency as the goals of trade policy.
- In 2025 US tariffs hit 17.4% on average — the highest since 1935 — before the Supreme Court struck down the IEEPA tariffs in February 2026.
- World trade still hit a record $34.65 trillion in 2025 — globalization is changing shape, not disappearing.
Tariff Walls & Trade Bridges: 20 Questions Answered
A tariff wall is a set of import taxes a government uses to make foreign goods more expensive than domestic ones. It protects local industries and raises revenue, but also raises consumer prices and risks retaliation. Smoot-Hawley (1930) and the US-China tariffs (2018–2025) are the most cited examples.
A trade bridge is any agreement or institution that lowers barriers and links economies — free trade agreements, customs unions, and bodies like the WTO. By cutting tariffs and harmonizing rules, trade bridges let goods, services, and capital flow freely. The EU Single Market and USMCA are leading examples.
Tariffs raise the price of imported goods and the domestic products that compete with them. Importers usually pass much of the cost to consumers. The Yale Budget Lab estimated that 2025 US tariffs raised the overall price level by 1.7%, costing the average household around $2,300 that year.
The importer pays the tariff to its own government at the border, then typically passes much of the cost to consumers. Despite claims that the exporting nation pays, most studies of the 2018–2025 US tariffs found American businesses and households bore the large majority of the burden.
Trade wars usually start when one country imposes tariffs to protect industries, punish perceived unfair practices, or gain leverage, and the target retaliates. Underlying drivers include trade deficits, intellectual-property disputes, national-security fears, and domestic political pressure to defend jobs.
It depends on design and scale. Tariffs can protect strategic industries and jobs short-term, but most economists find they raise prices, reduce efficiency, and invite retaliation. Targeted, temporary tariffs on genuine security goods are easier to justify than broad, permanent walls.
A 1930 US law that raised tariffs on over 20,000 goods to near-record levels. It triggered global retaliation, and world trade fell roughly two-thirds between 1929 and 1934. Most economists believe it deepened the Great Depression and it remains the classic warning against protectionism.
The WTO is the global body that sets and enforces trade rules. Founded January 1, 1995 to replace the GATT, it hosts negotiations and runs a dispute-settlement system covering goods, services, and intellectual property. It has 166 members representing the vast majority of world trade.
GATT (1947) was a provisional agreement covering only goods, with no enforcement court. The WTO (1995) is a permanent institution with binding dispute settlement that also covers services and intellectual property. The WTO absorbed and expanded GATT’s rules into an enforceable global system.
China’s 2001 entry gave it stable access to world markets, and it became the world’s largest exporter by 2009 and largest trading nation by 2013. It lifted hundreds of millions from poverty and cut consumer goods prices globally, but the “China Shock” also displaced manufacturing workers in the West.
NAFTA (1994) created a free trade zone among the US, Canada, and Mexico. USMCA, which replaced it on July 1, 2020, kept most free trade but added stricter auto rules of origin, stronger labor and environmental standards, and new digital-trade provisions. It is essentially a modernized NAFTA.
Friendshoring means relocating supply chains to politically allied countries rather than the cheapest location, to reduce dependence on rivals. Popularized by US Treasury Secretary Janet Yellen in 2022, it is closely tied to reshoring, nearshoring, and the “China-plus-one” strategy.
China-plus-one is a corporate strategy of keeping operations in China while adding a second manufacturing base elsewhere — often Vietnam, India, or Mexico — to spread risk. It accelerated sharply after the 2018 trade war and the pandemic exposed the danger of single-country dependence.
On February 20, 2026, the Supreme Court ruled 6–3 in Learning Resources, Inc. v. Trump that the IEEPA does not give the president power to impose tariffs — that power belongs to Congress. It struck down the 2025 reciprocal and fentanyl tariffs and opened the way to roughly $166 billion in importer refunds, of which CBP had accepted about $128.68 billion for processing by July 31, 2026. The administration responded with a Section 122 global surcharge, then Section 301 duties of 10–12.5% on roughly 80 countries from July 24, 2026.
The US average effective tariff rate started 2025 around 2.4%, peaked near 28% after the April “Liberation Day” announcements, and settled around 17.4% — the highest since 1935. The Yale Budget Lab estimated the cost at roughly $2,300 per household for the year.
The EU Single Market, completed in 1993, lets goods, services, capital, and people move freely among member states as if in one economy. Rooted in the 1957 Treaty of Rome, it is the world’s deepest trade bridge, serving around 450 million consumers and forming the largest trade bloc on Earth.
The Belt and Road Initiative (BRI) is China’s global infrastructure and investment program launched in 2013, financing ports, railways, and energy projects across dozens of countries. It expands China’s trade links and geopolitical influence, though some projects have raised concerns about debt sustainability.
A tariff is a tax that raises the price of imports but allows unlimited quantity. A quota is a hard limit on how much of a good can be imported, regardless of price. Both are trade barriers, but tariffs generate government revenue while quotas restrict volume directly.
No — it is changing shape. World trade hit a record $34.65 trillion in 2025, but it is becoming more regional, more digital, and more security-conscious. Economists call this “slowbalization” or “reglobalization”: less single-source dependence, more diversified and friend-aligned supply chains.
Expect more regional blocs, friendshoring, and diversified supply chains; fast-growing digital and services trade; and new “green” barriers like the EU’s carbon border tax. The central uncertainty is whether the WTO can reform its rulebook and revive dispute settlement to stay relevant through 2030.
Explore Related Timelines
Tata Sierra EV TimelineIndia’s iconic SUV goes electric
T20 World Cup Hall of FameCricket’s greatest players and records
Content is editorial and AI-assisted, compiled from publicly available sources including the World Trade Organization, International Monetary Fund, World Bank, US Trade Representative, the Budget Lab at Yale, and US Supreme Court filings (Learning Resources, Inc. v. Trump, 2026). Historical figures are widely accepted estimates; economic interpretations reflect mainstream analysis and may be debated. Trade data and tariff rates are accurate as of September 2026 and subject to change. This article is informational and not financial or legal advice.
Explore More Timelines
Sources & further reading
Every dated entry above was checked against these references. Last reviewed 20 September 2026.