UK Interest Rate Timeline 1997-2026: Bank of England Rates & Mortgage Costs
Bank of England rates went from 7.5% to 0.1% and back above 5%. See the full 1997-2026 timeline and what each rate meant for a £250,000 mortgage.
Latest Story
Imagine two homeowners. Both borrowed £250,000. Both fixed their mortgage at 1.5%, back when Bank of England interest rates were near zero. One homeowner’s fixed deal expired while rates were still low. The other’s expired years later, after Britain’s fastest rate-tightening cycle in decades. Same loan. Same starting rate. A monthly bill that can differ by hundreds of pounds — not because either of them did anything differently, but because of when their fix happened to end. That gap is the real story behind Britain’s interest-rate history: not just what the Bank of England did to Bank Rate since 1997, but how, and how slowly, those decisions actually reach a mortgage payment.
🧠 What Is the Bank of England Interest Rate Right Now?
As of 16 September 2026, Bank Rate is 3.75%. The Monetary Policy Committee held it unchanged at its meeting ending 29 July 2026 by a 6-3 vote — three members (Megan Greene, Catherine L. Mann and Huw Pill) wanted to raise it to 4.00%, citing volatile, higher energy prices linked to Middle East developments. The next decision is due 17 September 2026 at noon. Bank Rate influences UK mortgage costs, but it is not the same number as a mortgage rate — fixed-rate pricing also depends on financial-market expectations, funding costs and lender competition, explained below.
What Would a £250,000 Mortgage Cost at Today’s Rates?
Bank Rate is 3.75% — that is not the same as a mortgage rate. Pick an illustrative mortgage rate below to see the payment.
UK Interest Rates: Key Questions
What Actually Matters Here
- Bank Rate and your mortgage rate are two different numbers. Bank Rate is 3.75% (September 2026); the average 2-year fixed mortgage is 5.65% and the average standard variable rate (SVR) is over 7% — a gap that exists in every rate environment, not just this one.
- The transmission from Bank Rate to a household bill is not instant or uniform. Tracker and SVR mortgages move relatively quickly; fixed-rate mortgages don’t move at all until the fix ends, sometimes years later.
- Fixed mortgage pricing can move before the Bank of England does anything. The average 2-year fixed rate spiked to 6.65% in October 2022 on bond-market turmoil, well before Bank Rate itself reached that territory.
- The 2021-23 tightening cycle was the fastest in this 29-year series. Bank Rate rose from 0.1% to 5.25% in 20 months (December 2021 to August 2023) — 14 separate increases.
- 5.25% in August 2023 was the highest Bank Rate since February 2008 — not “decades,” a specific, checkable comparison to the last months before the financial crisis cuts.
- Rate cuts since August 2024 have not brought back 2020-era mortgage pricing. Bank Rate has fallen from 5.25% to 3.75%, but average fixed rates remain well above their 2021 lows because swap rates, funding costs and lender risk pricing reflect a different economic backdrop now.
- Cheap Bank Rate does not automatically mean easy credit. During the 2008-09 financial crisis, Bank Rate fell to 0.5% while many lenders simultaneously tightened who they would lend to at all.
- Higher mortgage rates reduce how much house the same monthly budget buys — not because incomes changed, but because more of each payment goes to interest rather than principal.
- Interest rates are one input into house prices, not the only one. Income, employment, housing supply, credit availability and buyer expectations all move the market independently of Bank Rate.
7.5% → 0.1% → 5.25% → 3.75%
Four numbers, four different Britains. Here is what each one meant for a £250,000 mortgage at a comparable rate.
How a Bank of England Decision Actually Reaches a Mortgage Payment
Six steps, and the journey is neither instant nor one-to-one.
The same Bank Rate can hit two identical mortgages at completely different times.
A tracker borrower feels a change within weeks. A fixed borrower may feel nothing until their deal expires — sometimes years later. That delay, not the headline rate itself, is the part of this story most coverage skips.
May 1997: Why the Story Starts Here
Operational independence for monetary policy — not simply “the Bank of England became independent.”
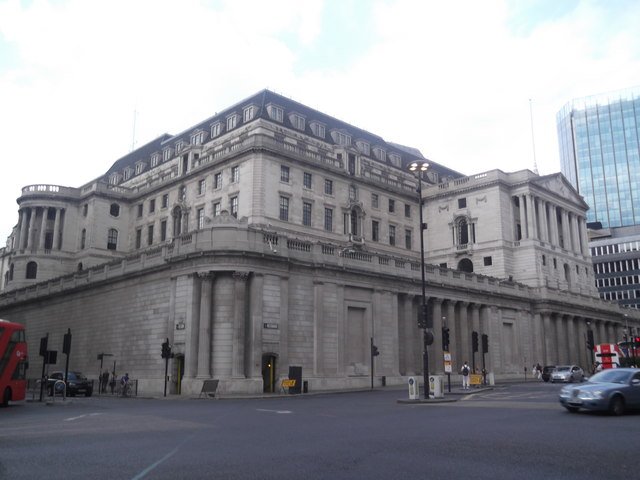
On 6 May 1997, days after the new government took office, the Chancellor announced that the Bank of England would be given operational independence for monetary policy. HM Treasury continued to set the policy framework — an inflation target, currently 2% on the Consumer Prices Index — but the Bank’s own committee, not the Chancellor, would decide the interest-rate settings needed to hit it. The first meeting of the newly formed Monetary Policy Committee took place on 5-6 June 1997, and its first decision raised Bank Rate to 6.5%, the point from which this article’s rate history begins.
This mattered beyond the technical machinery of government. Before 1997, interest-rate decisions were the Chancellor’s, made in a political context. Independence was designed to separate short-term political incentives from monetary policy — the theory being that a politically independent committee is more willing to raise rates when needed, even in the run-up to an election, than an elected government would be.
🏦 Who Actually Sets UK Interest Rates?
The Monetary Policy Committee (MPC) — nine members, including the Bank’s Governor, deputy governors, the Bank’s chief economist and external appointees. The committee meets on a published schedule (currently eight times a year) and each member votes individually; a simple majority decides. HM Treasury sets the inflation-target framework the MPC must aim for, via an annual remit letter, but does not vote on individual rate decisions.
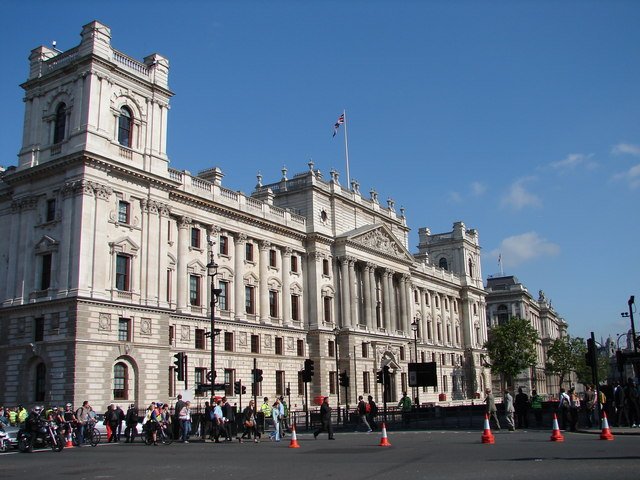
UK Bank Rate History: The Official Record
Every figure below is pulled directly from the Bank of England’s own statistical database (series IUDBEDR), not a secondary source.
1997-2006, year by year: the earlier part of this history moved more gradually than the dramatic swings of the last two decades.
| Year | Rate at Year-End | Context |
|---|---|---|
| 1997 | 7.25% | First MPC decision 6 June 1997 (6.5%); four further rises to 7.25% by November |
| 1998 | 6.25% | Peaked at 7.5% in June, then cut three times from October as the Asian financial crisis hit global growth |
| 1999 | 5.5% | Cut to 5.0% by June, then raised twice as growth recovered |
| 2000 | 6.0% | Two further small rises; rate held flat through most of 2000-01 |
| 2001 | 4.0% | Five cuts across the year following the dot-com downturn and 9/11 |
| 2003 | 3.75% | No change in 2002; cut to 3.5% in July, then back to 3.75% in November |
| 2004 | 4.75% | Four rises across the year as the housing market accelerated |
| 2005 | 4.5% | One cut, in August |
| 2006 | 5.0% | Two rises, ending the year on the approach to the pre-crisis peak |
2007-2026, every change: this is the period that shaped the mortgages most people reading this actually hold.
| Date | New Bank Rate | Move | Context |
|---|---|---|---|
| 11 Jan 2007 | 5.25% | +0.25 | Pre-crisis tightening continues |
| 10 May 2007 | 5.5% | +0.25 | |
| 5 Jul 2007 | 5.75% | +0.25 | Pre-crisis peak |
| 6 Dec 2007 | 5.5% | -0.25 | First crisis-era cut |
| 7 Feb 2008 | 5.25% | -0.25 | |
| 10 Apr 2008 | 5.0% | -0.25 | |
| 8 Oct 2008 | 4.5% | -0.5 | Lehman Brothers collapse (Sept 2008) |
| 6 Nov 2008 | 3.0% | -1.5 | Emergency-scale cut |
| 4 Dec 2008 | 2.0% | -1.0 | |
| 8 Jan 2009 | 1.5% | -0.5 | |
| 5 Feb 2009 | 1.0% | -0.5 | |
| 5 Mar 2009 | 0.5% | -0.5 | Then a record-length hold; quantitative easing begins |
| 4 Aug 2016 | 0.25% | -0.25 | Post-Brexit-referendum cut |
| 2 Nov 2017 | 0.5% | +0.25 | First rise in over a decade |
| 2 Aug 2018 | 0.75% | +0.25 | |
| 11 Mar 2020 | 0.25% | -0.5 | Covid-19 emergency cut #1 |
| 19 Mar 2020 | 0.1% | -0.15 | Covid-19 emergency cut #2 — two cuts in 8 days; all-time low |
| 16 Dec 2021 | 0.25% | +0.15 | Tightening cycle begins |
| 3 Feb 2022 | 0.5% | +0.25 | |
| 17 Mar 2022 | 0.75% | +0.25 | |
| 5 May 2022 | 1.0% | +0.25 | |
| 16 Jun 2022 | 1.25% | +0.25 | |
| 4 Aug 2022 | 1.75% | +0.5 | |
| 22 Sep 2022 | 2.25% | +0.5 | Days after the 23 Sept “mini-budget” |
| 3 Nov 2022 | 3.0% | +0.75 | Largest single hike this cycle |
| 15 Dec 2022 | 3.5% | +0.5 | |
| 2 Feb 2023 | 4.0% | +0.5 | |
| 23 Mar 2023 | 4.25% | +0.25 | |
| 11 May 2023 | 4.5% | +0.25 | |
| 22 Jun 2023 | 5.0% | +0.5 | |
| 3 Aug 2023 | 5.25% | +0.25 | Cycle peak — held for 13 months |
| 1 Aug 2024 | 5.0% | -0.25 | First cut of the easing cycle |
| 7 Nov 2024 | 4.75% | -0.25 | |
| 6 Feb 2025 | 4.5% | -0.25 | |
| 8 May 2025 | 4.25% | -0.25 | |
| 7 Aug 2025 | 4.0% | -0.25 | |
| 18 Dec 2025 | 3.75% | -0.25 | Current rate — held at every meeting since, through July 2026 |
The Signature Chart: UK Bank Rate, 1997-2026
Plotted directly from the table above — every real move, no smoothing.
UK Interest Rate Timeline: Every Major Turn, 1997-2026
Reverse chronological — newest first. Each entry separates what changed from what it meant for mortgages.
MPC Holds at 3.75% by a Tightening 6-3 Vote Held
What happened: The Committee held Bank Rate at 3.75%. Three members — Megan Greene, Catherine L. Mann and Huw Pill — voted for a rise to 4.00%, up from a 7-2 split in June, citing volatile and higher energy prices linked to Middle East developments and the risk they pose to the 2% inflation target.
Why it matters: A tightening vote split signals the Committee sees more upside inflation risk than it did a month earlier — relevant context for the 17 September decision, though this article does not predict that outcome.
Sixth Cut of the Easing Cycle Brings Bank Rate to 3.75% Cut
What happened: The MPC cut Bank Rate by 0.25 points to 3.75%, the sixth consecutive quarterly cut since the easing cycle began in August 2024.
Why it matters: This is the rate that has held, unchanged, through every meeting since — the number every “Bank Rate today” query in 2026 resolves to.
The Easing Cycle: Five Cuts from 5.25% to 4.0% Cut
What happened: Bank Rate fell from its 5.25% peak in five 0.25-point steps: to 5.0% (Aug 2024), 4.75% (Nov 2024), 4.5% (Feb 2025), 4.25% (May 2025) and 4.0% (Aug 2025).
Why it matters: Average mortgage rates fell only partially alongside Bank Rate over this period — a 1.25-point fall in Bank Rate did not produce a matching 1.25-point fall in fixed mortgage pricing, because swap rates and lender funding costs did not move by the same amount.
Bank Rate Peaks at 5.25% — Highest Since February 2008 Peak
What happened: The 14th and final rise of the 2021-23 tightening cycle took Bank Rate to 5.25%, where it then held for over a year.
Why it matters: This is the precise “highest since” comparison: Bank Rate had last stood at 5.25% in February 2008, months before the financial crisis cuts began. The average 2-year fixed mortgage rate peaked even higher and slightly later, at 6.86% on 26 July 2023 — itself the highest since August 2008.
The Great Reset: 14 Rate Rises in 20 Months Tightening
What happened: Starting from 0.5% in February 2022, the MPC raised Bank Rate at every single meeting for over a year and a half — through 0.75% (Mar), 1.0% (May), 1.25% (Jun), 1.75% (Aug), 2.25% (Sept, days after the 23 September “mini-budget”), 3.0% (Nov, the cycle’s single largest 0.75-point jump), 3.5% (Dec), 4.0% (Feb 2023), 4.25% (Mar), 4.5% (May), 5.0% (Jun) and 5.25% (Aug).
Why it matters: Inflation over this period reflected a combination of pandemic-era supply disruption, energy-price shocks following Russia’s invasion of Ukraine, and domestic wage and services-price pressure — not any single cause in isolation. The Bank’s rate rises were the response to that inflation, not its cause.
Tightening Begins: First Rise Since the Pandemic Cuts Turning Point
What happened: The MPC raised Bank Rate for the first time since the pandemic, from the all-time-low 0.1% to 0.25%, as inflation began climbing well above the 2% target.
Why it matters: This is the single date that started the clock on every “my cheap fix just expired” story in this article — anyone whose fixed deal ran past this point eventually remortgaged into a materially different rate environment.
Two Emergency Covid Cuts in Eight Days Emergency
What happened: As the Covid-19 pandemic hit, the MPC cut Bank Rate twice outside its normal meeting cycle — from 0.75% to 0.25% on 11 March, then to an all-time low of 0.1% on 19 March, alongside a package of quantitative easing and lending-scheme support.
Why it matters: 0.1% is the lowest Bank Rate has ever been in this series. Tracker and SVR borrowers felt the benefit almost immediately; new fixed-rate pricing eventually fell too, though never fully down to the 0.1% floor itself.
A Second Small Post-Brexit Rise Rise
What happened: Bank Rate rose to 0.75%, its highest level since the 2009 financial-crisis cuts at that point, continuing the gradual post-Brexit-referendum normalisation.
Why it matters: Even after two rises, Bank Rate remained a fraction of its pre-crisis levels — illustrating just how long the low-rate era that followed 2009 actually lasted.
First Rise in a Decade Turning Point
What happened: The MPC raised Bank Rate for the first time since July 2007 — reversing, in part, the post-referendum cut made a year earlier.
Why it matters: A full decade separated this hike from the previous one, illustrating how unusually long the low-rate period following the financial crisis had already run.
The Post-Brexit-Referendum Cut Cut
What happened: Following the June 2016 EU referendum result, the MPC cut Bank Rate to a then-record low of 0.25%, alongside additional stimulus measures, to support the economy through the resulting uncertainty.
Why it matters: This is the first move of the “low-rate generation” era that most 2020s first-time buyers actually experienced first-hand.
The Low-Rate Generation: 0.5% for Seven Years Extended Hold
What happened: Bank Rate held at 0.5% continuously from March 2009 until the August 2016 cut — the longest unbroken hold in this entire series — while the Bank ran multiple rounds of quantitative easing.
Why it matters: An entire cohort of UK borrowers took out their first mortgage, or fixed multiple times, without ever experiencing a Bank Rate rise. That shaped assumptions about “normal” borrowing costs that the 2021-23 tightening cycle then upended.
The Financial Crisis: 5.0% to 0.5% in Five Months Emergency
What happened: Following the collapse of Lehman Brothers in September 2008, the MPC cut Bank Rate six times in five months: to 4.5% (Oct), 3.0% (Nov, a 1.5-point single cut — the largest in this series), 2.0% (Dec), 1.5% (Jan 2009), 1.0% (Feb) and 0.5% (Mar).
Why it matters: Cheap Bank Rate did not mean easy mortgages. Tracker-rate borrowers benefited quickly, but many lenders simultaneously tightened lending criteria and withdrew higher loan-to-value products — a genuine mortgage drought for new buyers even as headline borrowing costs collapsed.
The Pre-Crisis Peak: 5.75% Peak
What happened: Bank Rate reached 5.75%, the high point of a tightening cycle that had run since 2003, just weeks before the first signs of the global credit crunch appeared.
Why it matters: This is the level Bank Rate would not return to for 16 years — not until the 2021-23 tightening cycle passed it in mid-2023.
Operational Independence and the First MPC Decision Founding
What happened: The Chancellor announced operational independence for the Bank of England on 6 May 1997. The newly constituted Monetary Policy Committee met for the first time on 5-6 June 1997 and raised Bank Rate to 6.5% — the point where this article’s rate history begins.
Why it matters: Every subsequent rate decision in this article, including the one due on 17 September 2026, traces back to this institutional structure: an inflation-target framework set by the Treasury, and rate decisions made independently by the MPC.
Bank Rate vs Mortgage Rates: The Chart That Matters More
Verified anchor points, not a fabricated continuous line — each figure is independently sourced and dated.
| Date | Bank Rate | Avg 2-Year Fixed Mortgage | Gap |
|---|---|---|---|
| 26 Jul 2021 | 0.1% | 2.52% | +2.42 pts |
| 20 Oct 2022 | 2.25% | 6.65% | +4.40 pts (mini-budget spike) |
| 26 Jul 2023 | 5.0% | 6.86% | +1.86 pts (cycle peak, highest since Aug 2008) |
| 8 Sep 2026 | 3.75% | 5.65% (5-yr: 5.70%) | +1.90 pts |
⚠️ What This Table Shows — and What It Doesn’t
These four dates are independently sourced (Bank of England for Bank Rate; Moneyfacts for the average 2-year fixed rate) and are not a fabricated continuous series. The most important row is October 2022: Bank Rate was still 2.25%, yet average fixed mortgage pricing had already jumped to 6.65% — proof that fixed-rate pricing can move sharply on market expectations and bond-market conditions, independent of what the MPC itself has actually done that day.
Bank Rate ≠ Your Mortgage Rate
Three products, three very different relationships to the same Bank Rate number.
🤔 If Bank Rate Is 3.75%, Why Isn’t My Mortgage 3.75%?
Because Bank Rate is the Bank of England’s own policy rate, not a retail lending rate. Tracker mortgages add a margin on top of it; SVRs are set independently by each lender and typically run several points higher; new fixed-rate mortgages are priced from swap rates, funding costs and competition, not from Bank Rate directly. In September 2026 the average 2-year fixed rate (5.65%) and average SVR (over 7%) both sit well above the 3.75% Bank Rate — a gap that exists in every rate environment, not a one-off distortion.
Swap Rates: Why Fixed Mortgages Move Before the Bank of England Does
The one financial-markets concept worth understanding, kept simple.
Fixed-rate mortgages are priced, in large part, using swap rates — financial-market interest rates that reflect what banks expect the cost of money to be, on average, over the length of the fix. A 5-year fixed mortgage is priced closer to the 5-year swap rate than to today’s Bank Rate, because the lender is committing to that rate for five years, not one day.
That has a direct, testable consequence: if markets expect Bank Rate to fall, swap rates fall first, and new fixed-mortgage offers can get cheaper before the MPC actually cuts anything. If markets expect Bank Rate to rise — or simply become more uncertain, as happened after the September 2022 mini-budget — swap rates rise first, and fixed mortgages get more expensive even without a same-day Bank Rate move.
📉 Can Mortgage Rates Fall Before the Bank of England Cuts?
Yes. This is one of the clearest patterns in this article’s own data: swap-rate and market-expectation shifts routinely move fixed mortgage pricing days, weeks or months ahead of an actual MPC decision, in either direction. The reverse spike — average 2-year fixed rates jumping to 6.65% in October 2022 while Bank Rate was still 2.25% — is the same mechanism running in the opposite direction.
2007-09: Why Did the Bank Cut So Fast?
Six cuts in five months — and a mortgage market that got harder to enter, not easier.
The 2007-09 cuts were a response to a genuine financial-system emergency: the collapse of the US subprime mortgage market spread into a global banking crisis, culminating in the failure of Lehman Brothers in September 2008. The MPC’s job was to prevent a full-blown depression by making credit cheaper and supporting demand as the wider economy contracted sharply.
Cheap Money ≠ Easy Credit
An important nuance most rate-history coverage skips.
✅ What Fell
- Bank Rate itself, from 5.75% (Jul 2007) to 0.5% (Mar 2009)
- Tracker-mortgage repayments for existing borrowers, almost immediately
- The general cost of new borrowing, once a lender was willing to lend at all
❌ What Didn’t Get Easier
- Access to credit — many lenders withdrew high loan-to-value products entirely
- Lending criteria, which tightened sharply across the industry
- Availability of mortgages for new buyers, especially those with smaller deposits
A falling Bank Rate is not the same claim as an easy mortgage market.
The 2008-09 period is the clearest evidence in this entire history: rates fell further and faster than at any other point in the series, while a genuine credit crunch simultaneously made mortgages harder to get for anyone who wasn’t already a borrower.
2009-2021: The Low-Rate Generation
89 months at 0.5%, then lower still — without moralising about who “should have known” rates would rise.
Bank Rate held at 0.5% from March 2009 to August 2016 — the longest continuous hold in this series — before falling further, to 0.25% (Aug 2016), then rising modestly to 0.5% (2017) and 0.75% (2018), before the 2020 Covid cuts took it to an all-time-low 0.1%. For over a decade, an entire cohort of UK homebuyers took out mortgages, remortgaged and made major financial decisions inside a genuinely unusual, historically low-rate environment. That’s not a judgement on those decisions — long periods of low rates shape what “normal” borrowing costs look like to the people living through them, and there was no way to know in 2015 that 2022 would look the way it did.
Covid-19: Two Cuts in Eight Days
11 March to 19 March 2020 — the fastest emergency response in this series.
🦠 Why Did Bank Rate Fall to Just 0.1%?
To support an economy facing a sudden, severe demand shock as lockdowns began — cheaper borrowing costs and additional Bank support (quantitative easing, lending schemes) were part of a wider package aimed at preventing the pandemic’s economic disruption from becoming a full financial crisis on top of a health crisis.
2021-23: The Great Reset, Explained
14 rises. 20 months. The fastest tightening cycle in this history — causes separated from the response.
Inflation over 2021-23 reflected several forces arriving together: pandemic-era supply-chain disruption, a surge in global energy and goods prices following Russia’s full-scale invasion of Ukraine in February 2022, and domestic wage and services-price pressure as the UK economy reopened. No single cause fully explains the period — describing it as simply “Ukraine caused UK inflation” oversimplifies a genuinely multi-causal shock. The MPC’s 14 rate rises, from 0.1% in December 2021 to 5.25% in August 2023, were the Bank’s response to that inflation, aimed at bringing it back toward the 2% target — not the reason inflation happened in the first place.
Your Cheap Fix Just Expired
The single most concrete way to see what this cycle did to a household budget.
Why the Same Rate Cycle Hits Two Households Differently
Monetary policy does not hit every household at once.
⏳ Why Can a Bank of England Rate Rise Take Years to Hit Your Mortgage?
Because a fixed-rate mortgage is a contract, not a live price. Once fixed, the rate does not change until the term ends — whether that’s two, three or five years later — no matter what Bank Rate does in the meantime. Someone who fixed for five years just before the 2021-23 tightening cycle began only felt its full effect at their 2026 remortgage, years after the rate rises themselves happened.
August 2023: The Peak, Precisely
“Highest since February 2008” — not a vague “decades.”
Bank Rate reached 5.25% on 3 August 2023 and held there for 13 months. The precise comparison: Bank Rate had last stood at 5.25% in February 2008, in the early stages of the financial-crisis cuts — making August 2023’s peak the highest Bank Rate in just over 15 years, not an ambiguous “multi-decade high.” Average fixed mortgage rates peaked separately, and slightly later: the average 2-year fixed rate hit 6.86% on 26 July 2023, its highest level since August 2008.
2024-25: Why Aren’t 1% Mortgages Back?
Bank Rate has fallen 1.5 points since its peak. Fixed mortgage pricing hasn’t fallen anywhere near as far.
📉 Bank Rate Is Falling. Why Aren’t 1% Mortgages Back?
Because a lower Bank Rate is only one input into fixed-mortgage pricing. Swap rates reflect a different medium-term inflation and growth outlook than in 2020-21; lender funding costs, capital requirements and risk pricing have all shifted; and competition among lenders, while real, hasn’t pushed pricing back to a genuinely unusual historical floor. A falling Bank Rate signals easier policy; it does not reset the whole economic backdrop that fixed-rate pricing reflects.
The 2026 Live Section
Point-in-time facts, dated — update this block after every MPC decision, not the whole article.
| Field | Value | Last Verified |
|---|---|---|
| Bank Rate | 3.75% | 16 Sept 2026 |
| Last MPC decision | 29 July 2026 — Held, 6-3 vote | 16 Sept 2026 |
| Dissenting members | Megan Greene, Catherine L. Mann, Huw Pill — wanted 4.00% | 16 Sept 2026 |
| Stated reasoning | Volatile, higher energy prices linked to Middle East developments; inflation-target risk | 16 Sept 2026 |
| Next MPC decision | 17 September 2026, 12:00 | 16 Sept 2026 |
| Avg 2-yr / 5-yr fixed mortgage | 5.65% / 5.70% (Moneyfacts) | 8 Sept 2026 |
| Avg SVR | ~7.1-7.3% (lenders range 6.49-8.38%) | Sept 2026 |
⚠️ We Do Not Predict the 17 September Decision
This article states verified facts about the July 2026 vote and does not forecast the outcome of the September meeting. Any market-implied probability cited elsewhere on this page is attributed to its source and date, and is a snapshot of trading positions on that date — not a Bank of England forecast, and not this publication’s own prediction.
Fixed vs Tracker: How Do They Respond to Rate Changes?
Different risk profiles, not a universal winner — this section compares mechanics, not advice.
Fixed-Rate vs Tracker Mortgage
⚠️ This Is a Mechanics Comparison, Not a Recommendation
Neither product is a universal winner — the right choice depends on a borrower’s own risk tolerance, how long they plan to stay in the property, and their view of where rates might go, none of which this article can assess for an individual reader. This section explains how each product responds to rate changes, not which one to choose.
What Does a Higher Mortgage Rate Do to House-Buying Power?
Same monthly budget, very different loan size, depending on the rate.
🏠 Why Can Higher Interest Rates Push Down a Buyer’s House Budget?
Because more of every monthly payment goes toward interest rather than principal as the rate rises, so the same monthly budget supports a smaller loan. At 2% a £1,500 monthly budget supports roughly £354,000 of borrowing over 25 years; at 6% the same budget supports only around £232,800 — a difference of over £120,000 in buying power, with the buyer’s income completely unchanged.
From Bank Rate to the Housing Market
Completing the chain — and why rates are one input, not the only one.
⚠️ Interest Rates Do Not Determine House Prices Alone
Income growth, employment, housing supply, population change, credit availability, taxation and buyer expectations all move independently of Bank Rate and can offset or amplify its effect on prices. A rate cut does not mechanically mean “house prices rise,” and a rate rise does not mechanically mean they fall — both are one input among several, not the whole story.
What Happens Next: Scenarios, Not Predictions
Fact, forecast and market pricing are kept clearly separate below.
| Type | Statement | Source & Date |
|---|---|---|
| Fact | Bank Rate is 3.75%, held since 18 December 2025 | Bank of England, 16 Sept 2026 |
| Fact | MPC voted 6-3 to hold at the July 2026 meeting; three members wanted 4.00% | Bank of England, 29 Jul 2026 |
| Market pricing (not a fact, not this article’s forecast) | Market-implied probability of no change at the September meeting was reported at roughly 73% | Market pricing snapshot, cited mid-Sept 2026 |
| Fact | The August 2026 inflation reading was published the morning of 16 September, ahead of the 17 September decision | ONS / Bank of England, Sept 2026 |
⚠️ This Article Does Not Predict the 17 September Decision
Market-implied probabilities reflect trading positions on a given date, not a guarantee, a Bank of England forecast, or this publication’s own view. This section will be updated with the confirmed outcome, vote split and stated reasoning immediately after the decision is published.
Who’s Who in This Story
Different institutions, different jobs — not interchangeable.
Bank of England
Sets Bank Rate via its Monetary Policy Committee; operationally independent since 1997, working within an inflation-target framework set by the Treasury.
Monetary Policy Committee (MPC)
Nine members who vote individually on Bank Rate at scheduled meetings roughly eight times a year; a simple majority decides.
HM Treasury
Sets the inflation-target framework (currently 2% CPI) via an annual remit letter; does not vote on individual rate decisions.
Office for National Statistics (ONS)
Publishes the CPI inflation figures the MPC targets, alongside wages, employment and housing-market data used throughout this article.
Financial Conduct Authority (FCA)
Regulates UK mortgage lending, including affordability and stress-testing rules that shape how much lenders can offer at any given rate.
UK Finance
Trade body for UK banking and lending, publishing mortgage-market data on volumes, arrears and product trends referenced across mortgage coverage.
Methodology: How This Article Was Verified
🔍 Methodology
Every Bank Rate figure and date in this article was pulled directly from the Bank of England’s own Statistical Interactive Database (series IUDBEDR), not a secondary source. Average mortgage-rate figures (2-year fixed, 5-year fixed, SVR) are sourced to Moneyfacts, with the exact date each figure applies to. The July 2026 MPC vote, dissenting members and stated reasoning are sourced to the Bank’s own Monetary Policy Summary and minutes. All mortgage-payment calculations use the standard repayment-mortgage amortisation formula on a stated principal and term, shown in full below; none are official lender quotes, and all are labelled illustrative. Where a figure (such as the outcome of the 17 September 2026 decision) had not yet occurred at the time of writing, this article states that explicitly rather than forecasting it.
How a Mortgage Payment Is Actually Calculated
- Take the outstanding balance (P). For the examples on this page, £250,000.
- Convert the annual mortgage rate to a monthly rate (r). Divide the annual percentage rate by 12 — a 6% annual rate becomes 0.5% per month.
- Take the number of monthly payments (n). A 25-year term is 300 monthly payments.
- Apply the standard amortisation formula: M = P × [r(1+r)^n] / [(1+r)^n − 1], where M is the monthly payment.
- Read the result as illustrative. Real lender quotes add product fees, may use slightly different day-count conventions, and depend on the borrower’s individual product, term and lender.
💡 Worth Knowing
- The largest single Bank Rate move in this history is the 1.5-point cut on 6 November 2008, from 4.5% to 3.0%.
- The shortest gap between any two Bank Rate changes is eight days — the two Covid emergency cuts of March 2020.
- The longest unbroken hold is 89 months, from March 2009 to August 2016, at 0.5%.
- 2002 is the only calendar year since 1997 with zero Bank Rate changes at all.
- The 2021-23 tightening cycle’s 14 rises took 20 months; the 2007-09 crisis cuts undid a comparable amount of change in under two years, in the opposite direction.
Explore More Timelines
People Also Ask
Frequently Asked Questions
⚠️ Editorial Note
Bank Rate figures and dates are sourced directly to the Bank of England’s own Statistical Interactive Database and Monetary Policy Summary and minutes. Mortgage-rate figures are sourced to Moneyfacts with the exact date each figure applies to. All mortgage-payment calculations on this page are illustrative, using the standard repayment-mortgage formula, and do not constitute financial advice. Content is editorial and AI-assisted, compiled from publicly available sources current as of 16 September 2026, and may contain inaccuracies; verify time-sensitive figures, especially the outcome of the 17 September 2026 MPC decision, against primary sources before relying on them.
Sources & further reading
Every dated entry above was checked against these references. Last reviewed 16 September 2026.
- Bank of England — Bank Rate: official history and current level (Statistical Database)
- Bank of England — Monetary Policy Summary and minutes, July 2026 (6-3 hold vote)
- Bank of England — Monetary Policy Committee dates for 2026 and 2027
- Open letters between HM Treasury and the Bank of England on the inflation-target remit, April 2026
- HomeOwners Alliance — Best UK Mortgage Rates Today (live average 2-year and 5-year fixed rates)
- ONS — Inflation and price indices (CPI, the measure the MPC targets)
- UK Finance — mortgage market data and research