Electric Car Sales and Oil Prices: The Complete History of a 190-Year Relationship
From 1830s carriages to the 2026 oil shock: how rising fuel prices and falling battery costs shaped 190 years of EV adoption, with IEA data and forecasts.
Latest Story
Raj Malhotra pulls into the same petrol station he has used for six years and watches the digital sign click over before he has even parked: up nine rupees a litre since his last fill. He does the arithmetic he now does automatically — what this month’s commute will cost versus last month’s — and feels the small, familiar irritation of a price he has no control over. Four streets away, Priya Nair’s car has been charging in her driveway since 11 p.m., drawing off-peak electricity that cost a fraction of Raj’s fuel bill and needed no decision from her at all; she finds out the price only when the bill arrives weeks later, and by then it barely registers. Neither driver is thinking about oil markets. But the price on that station’s sign and the number on Priya’s electricity bill are two ends of the same 190-year argument between two ways of powering a car — one that started before the internal combustion engine existed, and one that a single week in early 2026, when a Middle East crisis sent oil toward $120 a barrel, brought back into sharper focus than it had been in years. This is the complete, sourced history of that relationship: how oil shocks, battery breakthroughs, government policy and plain consumer arithmetic have pushed electric vehicle adoption forward in waves, not a straight line, from the 1830s to the 20-million-car year of 2025.
🧠 AI Overview Summary
Global electric car sales exceeded 20 million in 2025 — about one in four new cars sold worldwide, per the IEA. Higher oil prices have historically accelerated EV interest, most recently after a February 2026 Middle East crisis pushed Brent crude toward $120 a barrel; EV and plug-in hybrid sales rose 35% quarter-on-quarter by mid-2026, with 50 countries logging record quarterly sales. But the IEA and independent analysts agree oil price spikes accelerate a trend already driven by falling battery costs, charging infrastructure and policy — not the other way around.
Who, what, when, where, why and how
Nine things this history actually shows
- EVs are older than gasoline cars. Crude battery-powered carriages existed in the 1830s, roughly half a century before Karl Benz patented the first gasoline automobile in 1886.
- Every major oil shock has been followed by a wave of alternative-vehicle interest — 1973, 1979, and again in 2026 — but only the most recent wave had mature battery technology and charging infrastructure behind it to convert that interest into sales at scale.
- Battery cost, not oil price, is the structural driver. Pack prices fell from over $1,000/kWh in 2010 to around $115/kWh in 2024 — a roughly 90% decline that did more to make EVs affordable than any single oil price move.
- Oil shocks accelerate; they don’t create. Global EV sales grew every year from 2020 to 2025 regardless of whether oil prices were rising or falling that year.
- The 2026 shock was unusually sharp. Brent crude went from roughly $75 to near $120 a barrel in days after the closure of the Strait of Hormuz was reported in late February, then eased back toward $70-72 by July.
- Adoption is wildly uneven by country. China’s 2025 EV share (near 55%) is more than five times the United States’ (just under 10%), reflecting differences in charging infrastructure, incentives and fuel taxation, not just oil exposure.
- Leadership at the top of the market keeps changing. Tesla led global battery-electric deliveries in the first quarter of 2026; BYD retook the lead in the second quarter with a 16% volume advantage.
- Plug-in hybrids matter to this story too. Much of the reported 2026 sales surge combined battery-electric and plug-in hybrid vehicles together, since PHEVs are often the first step for buyers still wary of range on a single charge.
- The IEA’s own 2026 data shows growth is not guaranteed quarter to quarter. Global EV sales actually fell about 8% year-on-year in the first quarter of 2026, before the oil-shock-linked rebound in the second quarter.
What an Electric Vehicle Actually Is
The vocabulary this whole history depends on.
A battery electric vehicle (BEV) carries no engine, fuel tank or exhaust system at all — it stores energy in a battery pack and drives an electric motor directly, with zero tailpipe emissions. A plug-in hybrid electric vehicle (PHEV) carries both a smaller battery and a conventional petrol or diesel engine, typically offering 30-80 kilometres of electric-only range before the engine takes over, which makes it a bridge vehicle for buyers concerned about charging access or long trips. A standard hybrid, by contrast, cannot be plugged in at all and recharges its small battery only from braking and the engine itself. Industry and IEA statistics group BEVs and PHEVs together as “electric cars” when discussing overall market share, which is why headline EV sales figures usually include both.
Oil prices matter to this story for a simple reason: petrol and diesel are refined from crude oil, so a rise in the price of a barrel of Brent or WTI crude flows, with a lag, into the price at the pump. Electricity, by contrast, is generated from a mix of sources — coal, gas, nuclear, hydro, solar and wind, in proportions that vary hugely by country — so it is far less directly exposed to the oil market. That structural difference is why an oil price spike squeezes a petrol car’s running cost immediately while barely touching an EV owner’s electricity bill, and it is the single biggest reason consumer behaviour shifts when oil markets move.
Total cost of ownership, not the sticker price, usually decides the switch. An EV is typically more expensive to buy than an equivalent petrol car, but cheaper to run — lower “fuel” cost per kilometre, fewer moving parts to service, no oil changes. Government incentives (purchase subsidies, tax credits, reduced registration fees), charging infrastructure density, battery innovation that lowers sticker prices over time, and climate policy commitments like the Paris Agreement all interact with oil prices to shape when, and whether, that total-cost math tips a buyer toward electric.
Charging infrastructure specifically decides whether an oil price shock can even reach a would-be EV buyer’s decision. A driver with no reliable place to charge — no home driveway, no employer charger, no dense public network nearby — cannot act on a fuel-cost argument no matter how compelling the arithmetic becomes, which is why EV adoption tracks charging-point density almost as closely as it tracks price. Government incentives work on the other side of the same equation: a purchase subsidy or a tax credit directly narrows the upfront price gap that stops many buyers from ever getting to the running-cost comparison at all, and incentive design — how large, how long, and which vehicles qualify — has shaped the timing of nearly every national EV sales surge in this timeline, from Norway’s early tax exemptions to China’s decade of purchase subsidies to the United States’ 2022 Inflation Reduction Act credits.
Climate goals sit above both of these as the long-run policy justification, but they rarely move a single consumer’s decision the way a fuel bill or a purchase subsidy does. The Paris Agreement and the national emissions targets that followed it explain why governments built the incentive and regulatory structure in the first place; they explain relatively little about why any one buyer chose an EV in any one month. That distinction — between the policy reason a supportive environment exists and the immediate financial reason a specific purchase happens — recurs throughout this timeline, and this page tries to keep the two separate rather than treating “climate policy” and “consumer decision” as the same force.
📈 History Insight · Why every major oil shock accelerated interest in alternatives
The pattern is old. The 1973 OPEC embargo produced gas lines and a wave of American interest in smaller, more efficient cars; the 1979 Iranian Revolution’s price shock deepened it. Neither shock produced a mass EV market, because the underlying technology — lead-acid batteries with a fraction of lithium-ion’s energy density — simply wasn’t there yet. What changed by 2026 is that the technology had finally caught up with the recurring economic incentive. The Strait of Hormuz shock of February 2026 hit a market that already had cheap batteries, expanding charging networks and more than a decade of policy support behind it — which is why this shock converted into a 35% quarterly sales jump within months, something no 1970s oil shock could have done.
The Complete Timeline: Oil, Batteries and the Electric Car
Twenty milestones, newest first. Each entry separates confirmed historical fact, official market data, industry forecasts and independent analysis.
A Middle East oil shock and a global EV sales rebound arrive in the same year
Oil market: reports of the effective closure of the Strait of Hormuz in late February 2026, following a Middle East crisis, sent Brent crude from roughly $75 toward $120 a barrel within days — commentary at the time called it “Black March 2026.” By July, prices had eased back to around $70-72 a barrel as the IEA signalled a possible move toward oversupply later in the year.
EV market: global electric car sales fell about 8% year-on-year in the first quarter of 2026, to 3.9 million, on weaker demand in China and the United States, per IEA-linked reporting. By the second quarter, EV and plug-in hybrid sales had risen 35% quarter-on-quarter, with roughly 50 countries recording their highest-ever quarterly sales; Asia-Pacific markets outside China and Latin America posted particularly sharp increases.
Industry forecast, not confirmed data: the IEA’s Global EV Outlook 2026 projects full-year global sales of 23 million electric cars, a 28% market share, and JPMorgan Global Research has forecast Brent averaging $86 in the third quarter, $80 in the fourth, and $78 by year-end 2026 — forecasts, not settled figures.
Global EV sales cross 20 million for the first time
Official data: electric car sales grew 20% globally to exceed 20 million in 2025 — about one in four new cars sold worldwide, per the IEA. China’s EV share reached nearly 55% of car sales; Europe’s rose more than 30% to 28%; the United States stayed comparatively flat at just under 10%.
Battery innovation and a new charging standard reshape the industry
Market data: global electric car sales reached roughly 17.1 million in 2024, more than one in five cars sold worldwide, per the IEA.
Technology: battery makers including CATL and BYD announced next-generation sodium-ion and advanced lithium iron phosphate (LFP) cells aimed at cutting costs and reducing dependence on nickel and cobalt. Separately, Tesla’s North American Charging Standard (NACS) connector was adopted by Ford, General Motors, Rivian, Honda and other automakers, consolidating what had been a fragmented charging-plug landscape in North America.
Record EV sales arrive alongside a price war
Official data: global electric car sales reached almost 14 million in 2023, a 35% increase from 2022, per the IEA.
Market development: Tesla cut prices repeatedly through the year to defend market share against expanding Chinese manufacturers, led by BYD; the U.S. Inflation Reduction Act’s consumer EV tax credits, signed in 2022, took fuller effect, reshaping which vehicles qualified for incentives based on battery sourcing.
A European energy crisis fails to slow EV growth
Oil and gas market: Russia’s invasion of Ukraine in February 2022 triggered a European energy crisis, with natural gas and electricity prices spiking sharply alongside oil price volatility.
Official data: despite higher electricity costs in Europe, global electric car sales still grew roughly 55% to around 10.5 million, per the IEA — evidence that EV demand did not depend solely on the petrol-versus-electricity cost gap that year.
Sales roughly double as a global chip shortage disrupts the wider auto industry
Official data: global electric car sales roughly doubled from 2020 levels to around 6.6 million in 2021, per IEA figures, even as a global semiconductor shortage constrained vehicle production broadly across the industry.
Europe overtakes China in annual EV sales for the first time
Official data: global EV sales reached roughly 3 million in 2020 despite the pandemic-driven collapse in overall car sales, per the IEA. Europe recorded higher annual EV sales than China for the first time, driven by tightening EU CO2 emissions regulations on automakers and expanded national purchase incentives.
Battery pack costs fall toward a widely watched affordability threshold
Technology: average lithium-ion battery pack prices fell to around $176 per kilowatt-hour in 2018, according to BloombergNEF’s annual survey, down from over $1,000/kWh in 2010 — a decline analysts widely cited as the key structural driver making mass-market EVs financially viable.
The Paris Agreement and the Volkswagen emissions scandal both reshape automaker strategy
Policy: the Paris Agreement was adopted at COP21 in December 2015, committing signatory nations to limit global warming and setting the stage for a wave of subsequent national EV targets and emissions regulations.
Industry: separately, in September 2015 Volkswagen’s diesel-emissions cheating scandal broke, badly damaging diesel’s reputation in Europe and accelerating VW’s own multi-billion-euro pivot toward electric vehicle platforms.
Tesla launches the Supercharger network alongside the Model S
Confirmed history: Tesla began delivering the Model S sedan in June 2012 and launched its Supercharger fast-charging network that September, directly addressing the “range anxiety” that had held back earlier EVs by building dedicated long-distance charging infrastructure alongside the car itself.
The Nissan Leaf becomes the first mass-market modern EV from a major automaker
Confirmed history: Nissan launched the Leaf in December 2010, the first mass-produced, mainstream all-electric hatchback from a major global automaker; General Motors launched the plug-in hybrid Chevrolet Volt the same year, marking the point at which electrification moved from niche sports cars and compliance vehicles into ordinary consumer showrooms.
The Tesla Roadster proves lithium-ion batteries can power a highway-legal car
Confirmed history: Tesla began delivering the Roadster in 2008, the first highway-legal series-production electric car to use lithium-ion battery cells, offering over 200 miles of range — proof that the energy-dense battery chemistry used in laptops and phones could be scaled up to power a car.
Tesla Motors is founded
Confirmed history: Tesla Motors was incorporated in July 2003 by Martin Eberhard and Marc Tarpenning, with Elon Musk joining as chairman and lead investor the following year — founded on the explicit bet that lithium-ion batteries, not the lead-acid and nickel-metal-hydride chemistries used in earlier EVs, could make electric cars genuinely competitive.
The Toyota Prius launches the mass-market hybrid era
Confirmed history: Toyota launched the Prius in Japan in December 1997, the first mass-produced hybrid electric vehicle, combining a petrol engine with an electric motor and battery to improve fuel efficiency without requiring any charging infrastructure at all — a deliberately lower-risk step than a pure EV.
California’s zero-emission mandate forces automakers back toward EVs
Confirmed history: the California Air Resources Board adopted its Zero-Emission Vehicle mandate in September 1990, requiring a rising percentage of automakers’ California sales to be zero-emission — a regulatory push that led General Motors to develop and lease the EV1 from 1996, one of the first purpose-built modern electric cars from a major manufacturer, and set a template other U.S. states and, eventually, other countries later copied in their own emissions rules.
The second oil shock deepens interest in alternatives to petroleum
Confirmed history: the Iranian Revolution disrupted global oil supply in 1979, roughly doubling prices again on top of the 1973 shock and reinforcing, for a second time in a decade, how exposed transportation was to a small number of oil-producing regions.
The OPEC oil embargo becomes the first modern shock to expose oil dependence
Confirmed history: the October 1973 OPEC oil embargo, following the Yom Kippur War, sent the posted price of crude oil from roughly $3 a barrel to around $12 within months, and produced fuel shortages and queues at petrol stations across the United States and much of the industrialised world — the first time oil dependence became a mainstream household concern rather than a specialist policy issue. Several governments responded with speed limits, fuel rationing schemes and the first serious public research funding into battery and alternative-fuel vehicles, though none of it produced a commercially viable electric car within the decade.
The Ford Model T makes gasoline cars affordable, and electric cars fall behind
Confirmed history: Ford launched the Model T in October 1908, and the moving assembly line it introduced a few years later drove its price down to a fraction of a comparable electric car’s cost. By the early 1910s a Model T cost around $650 against roughly $1,750 for an electric roadster, and cheap, increasingly available petrol sealed gasoline’s dominance for the next century.
Karl Benz patents the first true gasoline automobile
Confirmed history: Karl Benz patented the Benz Patent-Motorwagen in January 1886, generally recognised as the first purpose-built automobile powered by an internal combustion engine, beginning the technology path that would dominate transportation for the next 130-plus years.
The earliest electric vehicles predate the gasoline car by half a century
Confirmed history: as early as the 1830s, inventors in Scotland, the Netherlands, Hungary and the United States built crude battery-powered carriages and small electric motors, decades before Karl Benz’s 1886 gasoline patent. These early vehicles used primitive, non-rechargeable batteries and never reached commercial production, but they establish that electric propulsion is not a modern alternative to the car — it is older than the car as most people picture it.
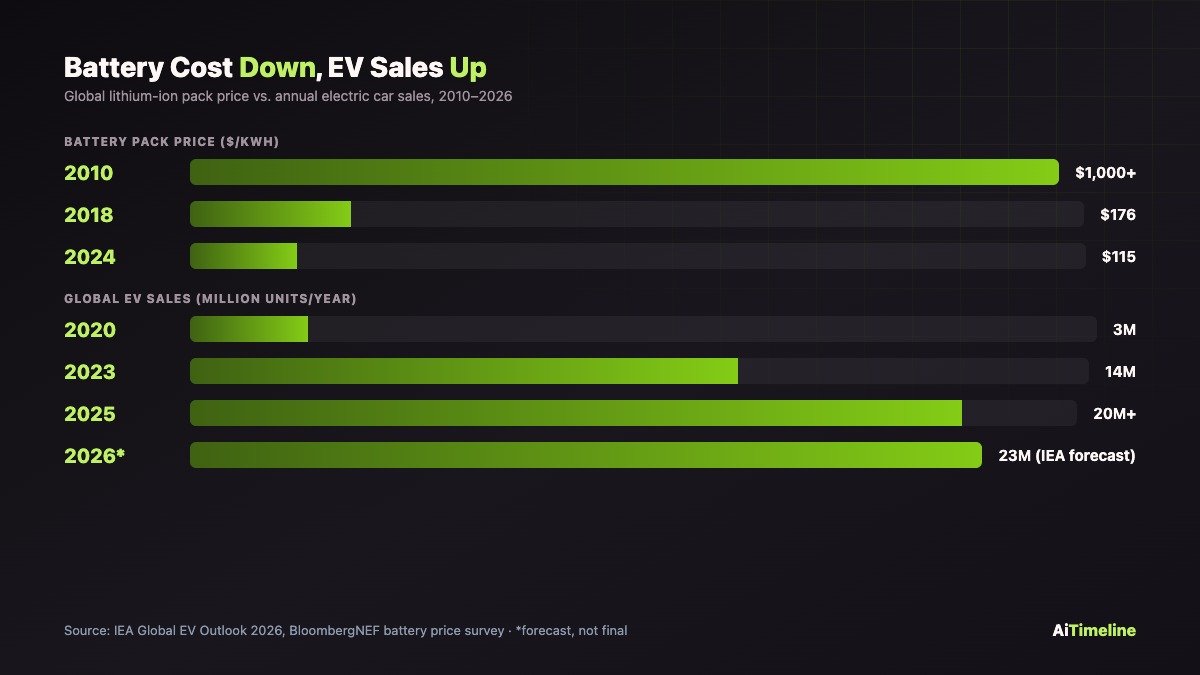
Battery pack prices fell roughly 90% between 2010 and 2024 while annual EV sales grew more than sixfold since 2020.
💰 Consumer Insight · Why total ownership cost usually matters more than the sticker price
A buyer comparing a petrol car’s price tag to an EV’s is often comparing the wrong numbers. The purchase price is a one-time cost; fuel or electricity is a cost paid every week for years. An EV that costs more upfront can still be cheaper overall once lower running costs, fewer scheduled services, and (where available) tax incentives are factored in across a typical five-to-eight-year ownership period. That arithmetic tightens sharply when oil prices rise and loosens when they fall, which is exactly why oil shocks move EV purchase interest even when nothing about the car itself has changed. The reverse is also true: when petrol is cheap, the total-cost argument for an EV weakens, even if the environmental case does not.
Explainer: Why Oil Prices Influence EV Sales
The mechanism is more direct than most coverage makes it sound. Crude oil is the raw input for petrol and diesel, so refiners’ costs move with the price of a barrel, and that cost is passed to the pump within days to a few weeks depending on the country’s fuel-tax structure and how much buffer distributors hold. A driver doing 15,000 kilometres a year notices a 20% jump in the price of fuel almost immediately, because it shows up at every single fill-up. An EV owner charging from the grid is insulated from that specific price move, because electricity generation costs are set by a different, more diversified mix of fuels and, in many countries, by regulated tariffs that change far less often than a spot oil price.
That asymmetry is what converts an oil shock into a sales number. When the gap between “cost per kilometre in a petrol car” and “cost per kilometre in an EV” widens sharply and suddenly, as it did after the February 2026 Hormuz disruption, the total-cost-of-ownership argument that already favoured EVs in many markets becomes harder to ignore even for buyers who were previously undecided. The lag between the price spike and the sales response is not instant — cars take weeks to order, finance and deliver — which is part of why the sharpest 2026 oil move landed in the first quarter’s data while the sales response peaked in the second quarter. The mechanism is simple; the timing is not.
Explainer: How EV Batteries Work
An EV battery pack is built from hundreds or thousands of individual cells, wired together and managed by a battery management system that monitors each cell’s temperature, charge level and health. Inside each lithium-ion cell, charging pushes lithium ions from a cathode to an anode through an electrolyte; discharging — driving the car — reverses that flow, releasing electrons that power the motor. The chemistry of the cathode is what defines a battery’s character: nickel-heavy chemistries pack in more energy per kilogram, favouring longer range, while lithium iron phosphate (LFP) chemistries sacrifice some energy density for lower cost, longer cycle life and better tolerance of full charging, which is why LFP has become common in shorter-range and lower-cost EVs.
Fast charging works by pushing far more current into the pack than a home charger can, which generates more heat and is why most EVs slow their charging rate sharply once the battery passes roughly 80% full — protecting the cells rather than a limitation of the charger itself. This is also why manufacturers quote fast-charging times as “10 to 80%” rather than “0 to 100%”: the last fifth of a charge is deliberately slow, and public fast-charging networks are economically designed around that faster middle portion of the charge curve. Battery degradation follows a broadly similar logic — heat, fast charging and holding a battery at very high or very low states of charge for long periods all accelerate the gradual loss of maximum capacity, which is why manufacturers’ warranties and owner guidance both focus on moderating those specific habits rather than on total mileage alone.
Explainers: The Technology Vocabulary of the EV Transition
Twelve terms that recur throughout coverage of EV adoption.
Lithium-Ion Battery
The dominant EV battery chemistry, prized for high energy density relative to weight; the same family of chemistry used in phones and laptops, scaled up dramatically.
Solid-State Battery
A next-generation design replacing the liquid electrolyte with a solid one, promising faster charging and higher energy density; in development and limited pilot production as of 2026, not yet in mainstream production vehicles.
Charging Levels
Level 1 (standard household outlet, slowest), Level 2 (dedicated home or public charger, several hours for a full charge), and DC fast charging (public high-power stations, often 15-40 minutes for a substantial charge).
Fast Charging
High-power DC charging, typically at public stations along highways, designed to add significant range in well under an hour rather than overnight.
Range Anxiety
The concern that an EV will run out of charge before reaching a destination or a charger; historically the single most-cited reason consumers hesitated to buy an EV, eased by longer ranges and denser charging networks.
Battery Recycling
Recovering lithium, cobalt, nickel and other materials from retired EV batteries for reuse, an increasingly important industry as the first mass-market EVs from the 2010s reach end of life.
Vehicle-to-Grid (V2G)
Technology allowing an EV’s battery to send stored electricity back into the power grid or a home, turning parked cars into a distributed energy storage resource.
Renewable Electricity
Power generated from solar, wind, hydro and similar sources; the cleaner the electricity mix charging an EV, the greater its emissions advantage over a petrol car.
Carbon Emissions
Greenhouse gases released from burning fuel; EVs produce none at the tailpipe, though their total footprint depends on how the electricity charging them was generated.
Oil Demand
The volume of crude oil consumed globally, of which road transport is a major share; the IEA has cited rising EV adoption as one factor contributing to softer oil demand growth in 2026.
Energy Security
A country’s exposure to disruption in imported fuel supply; a recurring justification for EV policy support since the 1973 oil embargo, since electricity can be generated domestically from diverse sources.
Battery Degradation
The gradual loss of a battery’s maximum charge capacity over years of use; most modern EV batteries are warrantied to retain a large majority of capacity after eight years or roughly 160,000 kilometres.
🔧 Technology Insight · How battery chemistry transformed EV performance
The single biggest technical shift in this entire history is the move from nickel-metal-hydride and lead-acid batteries, used in 1990s and early-2000s EVs, to lithium-ion. Lithium-ion packs store roughly two to three times more energy per kilogram, which is the difference between the Toyota Prius’s small hybrid battery and the Tesla Roadster’s 200-plus-mile range just over a decade later. Within lithium-ion itself, the industry has since split into two dominant approaches: nickel-based chemistries (higher energy density, longer range, historically pricier) and lithium iron phosphate, or LFP (lower cost, longer cycle life, slightly less energy-dense), which BYD and other Chinese manufacturers have used to undercut nickel-chemistry rivals on price. Solid-state batteries, still mostly in pilot production as of 2026, are the next major chemistry shift under development, promising faster charging and greater safety margins.
⚡ Energy Insight · How EVs cut oil dependence while raising electricity demand
Every litre of petrol an EV replaces is a litre of demand removed from the global oil market — which is part of why the IEA has pointed to rising EV adoption as a contributor to softer oil demand growth in 2026. But that demand does not disappear; it moves to the electricity grid instead. A country trading oil imports for electricity generation is trading one energy dependency for another — one that can, unlike imported oil, be met from domestic renewable, nuclear or other generation sources, which is the core of the energy-security argument for EVs. It also means the emissions and cost benefits of EV adoption depend heavily on how clean and how expensive that country’s electricity is, which is why EV adoption patterns differ so much between, say, hydro-and-nuclear-heavy France and coal-heavy regions elsewhere.
💡 Did You Know?
Global electric car sales exceeded 20 million in 2025, representing roughly one-quarter of all new passenger vehicle sales worldwide, according to the IEA’s Global EV Outlook 2026 — up from just 3 million in 2020, a more than sixfold increase in five years.
👀 Future Watch
Officially forecast, not guaranteed: the IEA’s Global EV Outlook 2026 projects global electric car sales of 23 million and a 28% market share for the full year 2026. J.P. Morgan Global Research forecasts Brent crude averaging $86 a barrel in the third quarter of 2026, $80 in the fourth quarter, and $78 by year-end. This page will be updated as each quarter’s confirmed sales and price data replace these forecasts, and after each new IEA Global EV Outlook release.
Comparison Tables
Five tables covering vehicle types, charging, ownership cost, and a flat year-by-year summary.
1. Gasoline car versus electric car
| Feature | Gasoline car | Electric car (BEV) |
|---|---|---|
| Energy source | Petrol or diesel, refined from crude oil | Electricity, from the grid mix |
| Refuelling time | 3-5 minutes at a pump | 20-40 min (fast charger) to overnight (home) |
| Tailpipe emissions | CO2 and pollutants released while driving | None at the tailpipe |
| Exposure to oil prices | Direct and immediate | Indirect, through electricity generation costs |
| Routine maintenance | Oil changes, more moving engine parts | No oil changes, fewer moving parts, brake wear often lower |
2. Battery EV versus plug-in hybrid
| Feature | Battery EV (BEV) | Plug-in hybrid (PHEV) |
|---|---|---|
| Engine | None | Petrol or diesel engine plus electric motor |
| Electric-only range | Full range, typically 250-500+ km | Typically 30-80 km before the engine takes over |
| Charging dependency | Fully dependent on charging access | Can run on petrol if charging isn’t available |
| Best suited to | Drivers with reliable home or work charging | Drivers easing in, or without consistent charging access |
3. Home charging versus public fast charging
| Feature | Home charging | Public fast charging |
|---|---|---|
| Typical speed | Slow (Level 1/2), several hours to full | Fast (DC), 15-40 minutes for most of a charge |
| Typical cost per kWh | Lowest, especially off-peak home tariffs | Higher, reflecting infrastructure and demand-charge costs |
| Convenience | Car charges overnight, ready every morning | Needed for long trips beyond single-charge range |
| Availability | Requires home charger installation or access | Growing but still uneven network density by region |
4. Oil-vehicle versus EV ownership cost
| Cost factor | Petrol/diesel vehicle | Electric vehicle |
|---|---|---|
| Purchase price | Typically lower upfront | Typically higher upfront, narrowing over time |
| “Fuel” cost per km | Directly tracks oil/pump prices | Tracks electricity tariffs, generally more stable |
| Exposure to 2026 oil shock | Full exposure to the March 2026 price spike | Largely insulated; reported fuel-cost savings rose ~35% year-on-year at mid-2026 prices |
| Maintenance | Regular oil changes, more mechanical parts | Lower routine maintenance, battery is the major long-term cost item |
5. Timeline summary
| Year | Event | Industry impact |
|---|---|---|
| 1830s | Earliest crude electric carriages built | Establishes electric propulsion predates the gasoline car |
| 1886 | Karl Benz patents the gasoline automobile | Begins gasoline’s century-long dominance |
| 1908 | Ford Model T launches | Mass-manufacturing cost advantage seals gasoline’s lead |
| 1973 / 1979 | Two oil shocks | Establishes energy security as a policy argument |
| 1990 | California ZEV mandate adopted | First serious modern regulatory push for EVs |
| 1997 | Toyota Prius launches | Proves demand for lower fuel cost without charging |
| 2003-2012 | Tesla founded, Roadster, Model S, Superchargers | Proves lithium-ion EVs and fast charging at scale |
| 2015 | Paris Agreement; VW emissions scandal | Climate policy and diesel’s reputation both push EVs |
| 2018 | Battery pack costs fall to ~$176/kWh | Affordability curve becomes the dominant growth driver |
| 2020-2025 | Annual EV sales rise from 3M to 20M+ | Mainstream adoption across major markets |
| 2026 | Oil shock and Q2 sales rebound | Tests whether oil price shocks still move a mature EV market |
Official Data Versus Industry Forecasts
Kept deliberately separate, per this page’s editorial policy.
Confirmed official data
- 2025 global EV sales exceeded 20 million, a 25% share (IEA).
- Q1 2026 global EV sales fell ~8% year-on-year to 3.9 million.
- Brent crude spiked toward $120/barrel in late February-March 2026.
- Q2 2026 EV/PHEV sales rose 35% quarter-on-quarter.
- BYD led Tesla in global BEV deliveries in Q2 2026, by a 16% margin.
Forecasts and industry commentary
- IEA projects 23 million EV sales and 28% share for full-year 2026.
- J.P. Morgan forecasts Brent averaging $78-86/barrel through the rest of 2026.
- Analysts attribute softer 2026 oil demand growth partly to EV adoption.
- Solid-state batteries are widely expected, not yet confirmed, to reach mainstream production later in the decade.
- Neither forecast should be read as a guarantee; both are subject to revision.
✅ Common Misconceptions
- “EVs are a recent invention.” Crude electric vehicles predate the gasoline car by roughly 50 years.
- “EV sales only grow when oil is expensive.” Sales grew every year from 2020 to 2025 regardless of the direction oil prices moved that year.
- “All electric cars are the same as plug-in hybrids.” A PHEV carries a petrol engine as well as a battery; a BEV does not.
- “Electricity is always cleaner than petrol.” An EV’s emissions advantage depends on how clean the electricity charging it is, which varies enormously by country.
- “Battery replacement will bankrupt EV owners.” Most modern EV batteries are warrantied for 8 years/~160,000 km and retain a large majority of their capacity over that period.
🇮🇳 India Insight · A different EV story, led by two-wheelers
India’s EV market does not follow the passenger-car pattern this page mostly describes. Total EV sales across all vehicle categories grew about 45% in 2025 to over 1.5 million units, but electric two-wheelers alone account for roughly 42% of registrations, reflecting a market where more than three-quarters of households own a scooter or motorcycle rather than a car. India’s demand-side incentives have shifted from the FAME II scheme, which disbursed over ₹10,000 crore between 2019 and 2024, to the PM E-DRIVE programme approved in September 2024 with a ₹10,900 crore outlay, running through March 2027. In August 2025, NITI Aayog proposed shifting future policy toward mandates rather than subsidies, targeting a 30% EV share of total vehicle sales by 2030 — a proposal, not yet enacted policy.
Explore More Timelines
Who’s Involved: The Institutions and Companies Behind This History
International Energy Agency
Publishes the annual Global EV Outlook and tracks global oil markets; the primary official source for EV sales figures used throughout this page.
OPEC
The Organization of the Petroleum Exporting Countries, whose production decisions have shaped oil prices since the 1973 embargo.
Tesla
Founded 2003; pioneered lithium-ion EVs at scale and built the Supercharger network; traded the global BEV sales lead with BYD through 2026.
BYD
Chinese manufacturer that overtook Tesla in global battery-electric vehicle deliveries in the second quarter of 2026.
Nissan
Launched the Leaf in 2010, the first mass-market modern all-electric hatchback from a major automaker.
Toyota
Launched the Prius in 1997, the first mass-produced hybrid, and remains a major global hybrid and EV manufacturer.
European Union
Sets EU-wide vehicle CO2 emissions standards that have directly shaped automaker EV strategy since the early 2020s.
U.S. Department of Energy
Administers U.S. EV and battery manufacturing incentive programmes and publishes national charging infrastructure data.
People Also Ask
40 Frequently Asked Questions
Grouped by vehicle basics, oil market history, battery technology, charging, costs, and the 2026 market.
Related Timelines on AiTimeline
Why Electric Vehicles Are Reshaping the Future of Transportation
Raj’s rising fuel bill and Priya’s overnight charge are both, in the end, downstream of the same 190 years. The rapid growth of electric vehicles reflects decades of technological innovation — from crude 1830s carriages to lithium-ion cells that store more energy per kilogram than anyone in Karl Benz’s era could have imagined — layered onto battery cost declines of roughly 90% since 2010, supportive government policy dating back to California’s 1990 mandate, expanding charging infrastructure that finally solved range anxiety, and changing consumer economics that make the total-cost math work in more places every year.
Higher oil prices, including the sharp 2026 shock that pushed Brent toward $120 a barrel, can and do accelerate interest in EVs — the 35% quarterly sales jump that followed is real, confirmed data, not speculation. But this page’s own twenty milestones show that acceleration only works on a trend that is already moving. Sales grew through 2020, 2021 and 2022, years when oil prices did very different things each time. What decided the pace, year after year, was affordability, reliable charging, cleaner electricity, and continued battery innovation — not the price on any single day’s petrol station sign.
That is the honest, complete answer, and it is why long-term EV adoption should be read against those structural forces rather than any one oil price headline. Readers who want to follow what happens next should rely on the IEA’s Global EV Outlook, official vehicle registration data, and confirmed quarterly sales figures — not any single forecast, including the ones on this page, which will be revised as real numbers replace them.
✉ Editorial note, sources and limitations
Last reviewed: 31 July 2026. Historical facts (pre-2020) draw on widely documented automotive and energy history. Recent and current data are attributed to the source reporting them at every point in this article. Forecasts are explicitly labelled as forecasts and never presented as confirmed outcomes.
Primary and near-primary sources used:
- International Energy Agency — Global EV Outlook 2026, Trends in electric cars
- International Energy Agency — Global Energy Review 2026, Electric vehicles chapter
- OilPrice.com — “Oil Price Shock Fuels 35% Surge in Global EV Sales,” July 2026
- European Commission, Climate Action — “Electric car sales surge as high oil prices drive shift away from fossil fuels,” 16 June 2026
Sources & further reading
Every dated entry above was checked against these references. Last reviewed 15 September 2026.