Oil Firms’ $93 Billion Profits: What Energy-Crisis Earnings Really Show
How energy crises turn into record oil-company profits — verified 2022-2026 earnings, windfall-tax policy and 50 years of price shocks explained.
Latest Story
In a semi-detached house outside Manchester, a delivery driver named Priya watches her monthly heating bill climb for the third winter in a row and does the arithmetic on whether to keep the thermostat where it is. Four thousand miles away, in a suburb of Houston, a retired schoolteacher named Robert fills his pickup truck and grumbles, not for the first time, that the pump price never seems to fall as fast as it rises. Neither of them owns oil shares. Both of them, in the same week, read a headline reporting that a handful of publicly listed oil companies had just posted a combined quarterly profit of roughly $93 billion. The two facts sit side by side and feel, on first reading, like a contradiction: household energy costs rising, corporate energy profits surging, at the very same moment, from the very same market.
It is not a contradiction, and it is also not a coincidence — it is how oil company profits and consumer energy prices are mechanically connected during an energy crisis. This guide explains, in plain terms and with company-verified numbers, why a spike in crude oil prices that raises Priya’s heating bill and Robert’s fuel bill can, in the same quarter, raise the earnings a producer reports to its shareholders. It explains how upstream exploration and production, midstream transport and storage, and downstream refining and retail fit together into one business, why each of those segments responds differently to a price shock, and why “oil company profits went up” is a much more complicated sentence than it first appears — one that depends on production costs, refining margins, hedging positions, currency movements and tax regimes as much as it depends on the crude oil price itself.
This is a reference, not a news bulletin, and it is written to a YMYL (Your Money or Your Life) standard: the topic touches household budgets, investment decisions and public policy, so every figure below is attributed to its source — a company’s own results announcement, an official government or intergovernmental statistic, or named independent analysis — and nothing here treats profitability, on its own, as evidence of wrongdoing. Elevated earnings during a supply shock are a well-documented feature of commodity markets, observed across five decades and multiple unrelated crises; whether governments should respond with a temporary windfall tax, a subsidy, or no intervention at all is a live and legitimate policy debate, covered later in this guide as a debate, not a verdict.
📋 Executive Summary
Major listed oil companies — ExxonMobil, Shell, Chevron, BP, TotalEnergies and Saudi Aramco among them — reported some of the highest quarterly and annual profits in their history during 2022, a year in which Russia’s invasion of Ukraine, tight global refining capacity and a rebound in post-pandemic demand pushed Brent crude above $120 a barrel and refining margins to record levels. Combined, the five largest Western-listed majors disclosed more than $180 billion in net income for full-year 2022 alone, and contemporaneous press aggregations of a single quarter’s combined profit across major listed producers were widely reported at approximately $93 billion. Profits eased in 2023-2025 as prices normalised, then faced renewed volatility in 2026 after the outbreak of a Middle East war disrupted the Strait of Hormuz. This guide separates verified company results, official statistics, government policy and independent analysis throughout, explaining the market mechanics — not the politics — behind why energy crises and corporate earnings so often rise together.
🧠 60-Second Overview
Oil companies earn more during energy crises chiefly because crude oil is sold at a global market price while a large share of production costs stays fixed in the short term — so when Brent or WTI crude prices rise sharply, the extra revenue per barrel flows largely to the producer’s bottom line before costs catch up. In 2022, Russia’s invasion of Ukraine, sanctions on Russian energy exports and years of underinvestment in refining capacity combined to push crude prices and refining margins to their highest levels since 2008, and the largest listed oil majors reported record or near-record annual profits as a direct, company-disclosed consequence. Governments responded unevenly: the UK and the European Union introduced temporary windfall taxes on energy-sector profits, while the United States did not enact one. Prices and profits both eased through 2023-2025, before renewed 2026 Middle East conflict pushed Brent back above $100 a barrel for the first time since 2022.
⚠️ Editorial Note & Scope
This is a YMYL topic touching household energy costs, investment decisions and public policy. This guide separates verified financial results (figures companies have reported in audited or company-disclosed quarterly and annual results), company disclosures and statements (guidance, strategy commentary — treated as company claims, not independent verification), official statistics and policy (IEA, EIA, OPEC, World Bank, IMF, and national government tax and energy policy), independent economic analysis (research institutions and named commentators), and public policy debate (the windfall-tax argument and similar contested questions) at every point they diverge. It does not present profitability, on its own, as evidence of misconduct, and it does not treat “windfall profits” as an established accounting term — the phrase is a political and policy label, used by specific governments and commentators, and is attributed as such throughout. Figures for 2025-2026 are the most recent company- and agency-reported data available as of this update and may be revised in subsequent reporting periods; this guide is maintained as a living reference and updated as the IEA, EIA, OPEC, World Bank, IMF and company results publish new material.
Who, What, When, Where, Why and How
What the Public Record Actually Shows
- Higher oil-company profits and higher consumer energy bills share one root cause: a global price spike, not a decision by any single company to raise prices on consumers to fund its own earnings.
- ExxonMobil, Shell and Chevron each reported the highest annual profit in their company history for full-year 2022, per their own disclosed results — $55.7 billion, $42.3 billion and $35.4 billion respectively.
- Refining margins, not just crude prices, drove a meaningful share of 2022’s record earnings — refinery closures during the pandemic left global refining capacity tight just as demand for refined fuel recovered.
- Saudi Aramco’s 2022 net income of $161.1 billion was the largest annual profit ever reported by a public company, reflecting both high prices and the company’s low production costs as a state-linked national oil company.
- “Windfall tax” is a policy label, not an accounting term — it describes a temporary, additional levy some governments choose to apply to profits they judge to result from external circumstances rather than company effort, and its use varies sharply by country.
- The UK and the EU introduced windfall-style levies in 2022; the United States did not — a live illustration of how the same market conditions produced different policy responses.
- Earnings normalised substantially by 2023-2025 as crude prices eased from 2022’s peaks — Shell’s net income fell from $42.3 billion in 2022 to $16.5 billion in 2024, for example, per the company’s own reporting.
- A separate 2026 shock — the outbreak of a Middle East war and a Strait of Hormuz closure — pushed Brent back above $100 a barrel for the first time since 2022, illustrating that energy-price volatility did not end with the 2022 crisis.
- Strategic petroleum reserves and OPEC+ production decisions are the two main tools governments and producers use to dampen a price shock, distinct from — and often deployed alongside — tax policy.
- This is a living reference: as the IEA, EIA, OPEC, World Bank, IMF and company results publish new data, this guide will be revised, not replaced.
The Vocabulary of Oil Markets, Defined
Twelve terms this guide uses precisely and consistently throughout.
Crude Oil
Unrefined petroleum extracted from the ground, traded globally as a commodity and priced against benchmarks such as Brent and WTI before it is refined into usable fuels and petrochemical feedstocks.
Brent Crude
The North Sea-sourced benchmark used to price roughly two-thirds of the world’s internationally traded crude oil, published daily and widely quoted as the global reference price.
WTI (West Texas Intermediate)
The main US crude oil benchmark, priced for delivery at Cushing, Oklahoma; it typically tracks Brent closely but can diverge when US pipeline, storage or export capacity is constrained.
OPEC+
A coalition of the Organization of the Petroleum Exporting Countries and allied producers including Russia, formed in late 2016 to coordinate output levels and, in aggregate, influence global crude prices.
Refining Margin
Also called the “crack spread”: the difference between the cost of crude oil a refiner buys and the revenue it earns selling refined products such as petrol, diesel and jet fuel — it can rise or fall independently of the crude price.
Upstream
The exploration and production segment of the oil industry — finding and extracting crude oil and natural gas, the part of the business most directly exposed to swings in the commodity price.
Downstream
The refining, petrochemicals, marketing and retail segment — turning crude oil into usable products and selling them, a business whose profitability depends more on refining margins than on the crude price itself.
Integrated Oil Company
A company such as ExxonMobil, Shell, BP, Chevron or TotalEnergies that operates across upstream, midstream and downstream segments, which can partially offset weakness in one segment with strength in another.
Energy Security
A government’s ability to ensure a reliable, affordable supply of energy for its economy — a policy goal that can conflict with, or align with, climate and affordability goals depending on the circumstances.
Windfall Tax
A temporary, additional levy some governments impose on profits they attribute to external market conditions rather than company effort or innovation — a political and fiscal policy choice, not a standard accounting category.
Strategic Petroleum Reserve
Government-held emergency crude oil stockpiles — the US Strategic Petroleum Reserve is the largest — that can be released to increase short-term supply and moderate price spikes during a crisis.
Midstream
The transport, storage and pipeline segment connecting upstream production to downstream refining — less prominent in public discussion than upstream or downstream, but essential to how quickly a supply shock reaches consumers.
📈 Market Insight
Oil company profits often depend on commodity prices, production costs, refining margins and operational efficiency rather than crude prices alone. Two companies facing an identical crude oil price can report very different profit growth depending on where their production costs sit, how much of their business is downstream refining versus upstream extraction, and how their hedging contracts were structured before the price moved.
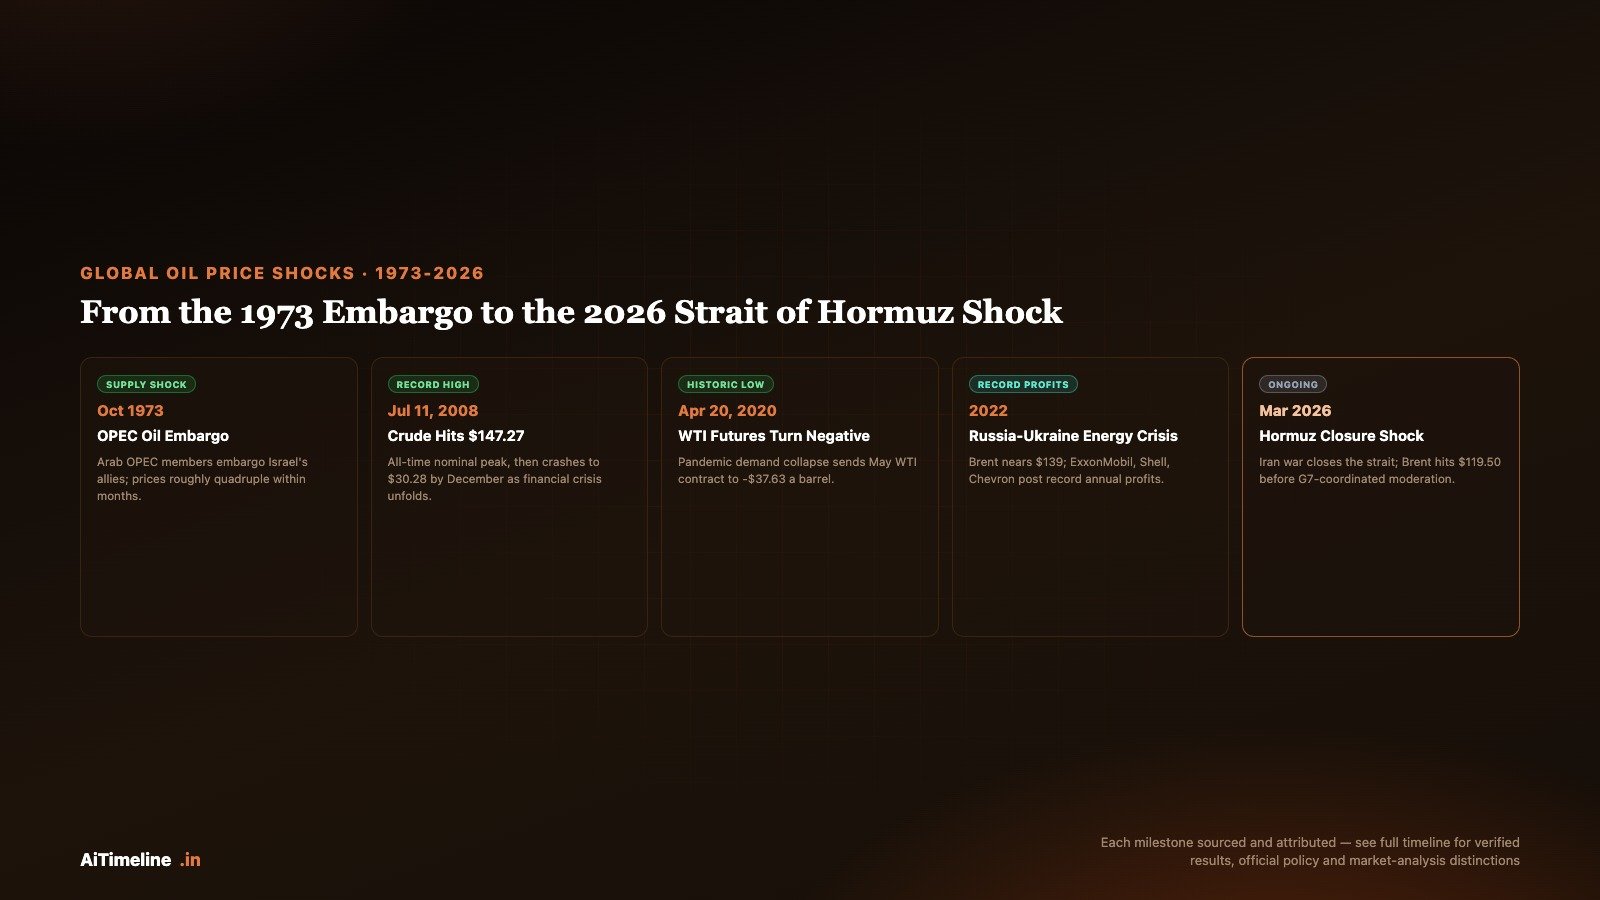
The Complete Timeline: Oil Shocks, Crashes and Crises Since 1973
Reverse-chronological. Each entry separates economic background, market conditions, corporate impact, government response and current relevance.
A Middle East War Closes the Strait of Hormuz and Sends Brent Back Above $100
Economic background: Oil prices and company earnings had largely normalised by early 2026 from their 2022 peaks, with Brent trading well below $100 a barrel through most of 2024-2025.
Oil-market conditions: Conflict that began in late February 2026 escalated sharply when Iran moved to block the Strait of Hormuz — a chokepoint for roughly a fifth of global oil-shipping traffic — in late March 2026. Brent crude surged to an intraday peak of $119.50 on March 9, 2026, a jump of roughly 29% and the first time international oil prices had cleared $100 a barrel since 2022, before moderating toward approximately $100 after G7 finance ministers signalled a potential coordinated release of strategic petroleum reserves. By mid-June 2026, independent reporting (The Economist) described refined product prices as 35-70% above pre-war levels amid continued disruption.
Corporate impact: Full company-reported earnings covering this period were still being published as of this update; this guide will incorporate verified 2026 quarterly results as producers disclose them rather than estimate them in advance.
Government response: A US naval presence in the strait followed failed diplomatic talks in mid-April 2026; a ceasefire signed June 17, 2026 subsequently collapsed by July 8, with hostilities resuming. G7 governments discussed coordinated strategic reserve releases as a price-moderation tool, echoing the 1990-91 and 2022 precedents described later in this timeline.
Current relevance: This remains an active, developing situation as of this update — the clearest recent illustration that oil-price volatility, and the corporate-earnings volatility that follows it, did not end with the 2022 energy crisis.
Earnings Normalise as Oil Prices Ease From Their 2022 Peaks
Economic background: Global inflation, central-bank rate rises and a cooling of the acute 2022 supply fears allowed crude prices to settle well below their March 2022 peak, though still above pre-2022 norms for much of the period.
Oil-market conditions: OPEC+ shifted toward a series of voluntary production cuts through 2023-2024 aimed at supporting prices as demand growth moderated, while non-OPEC+ supply — particularly US shale output — continued to expand.
Corporate impact: Per each company’s own disclosed results, full-year net income fell from 2022’s records: ExxonMobil reported $33.6 billion for 2024 (down from $55.7 billion in 2022); Shell reported $19.3 billion for 2023 and $16.5 billion for 2024 (down from $42.3 billion in 2022); Chevron reported $21.3 billion for 2023 (down from $35.4 billion in 2022); TotalEnergies reported $21.51 billion in net income for 2023. Saudi Aramco’s net income also declined from its $161.1 billion 2022 record to $121.3 billion in 2023 and $106.2 billion in 2024.
Government response: The UK’s Energy Profits Levy remained in force through this period, with the incoming government elected in 2024 subsequently revising its rate and investment-allowance terms; no comparable US federal measure was introduced.
Current relevance: This period is the clearest evidence that 2022’s record profits tracked the price cycle rather than representing a permanent new earnings level — profits fell by roughly 40-60% at several majors as prices normalised, without any change in tax or regulatory treatment driving that decline.
Q3
Major Oil Firms Report a Combined Quarterly Profit Widely Reported at Approximately $93 Billion
Economic background: The third quarter of 2022 (July-September) fell during the period of peak post-invasion energy-price pressure in Europe, with household bills rising sharply across multiple economies even as crude prices had eased slightly from their March peak.
Oil-market conditions: Refining margins remained at or near record highs through the quarter, a major contributor to earnings beyond the crude price alone. Per company results announcements, ExxonMobil reported a record quarterly profit of $19.66 billion, Shell reported adjusted earnings of $9.45 billion, Chevron reported roughly $11.2 billion, and BP reported an underlying replacement-cost profit of roughly $8.15 billion for the quarter; Saudi Aramco separately reported net income of $42.4 billion for the same quarter, the largest quarterly profit ever reported by a listed company.
Corporate impact: Combined quarterly totals reported across major listed producers in contemporaneous 2022 press coverage were widely cited at approximately $93 billion — a figure that varies by exactly which companies and currencies are included, since no single official body publishes one consolidated “Big Oil” quarterly total.
Government response: The scale of the disclosed quarterly profits intensified political pressure in the UK, EU and US for windfall-style taxation, discussed later in this guide as a policy debate rather than a settled outcome.
Current relevance: This quarter remains the reference point most public discussion of “Big Oil’s record profits” is built around, and the origin of the “$93 billion” figure in this guide’s own title.
Russia’s Invasion of Ukraine Triggers a Global Energy Crisis
Economic background: Global energy markets entered 2022 already tightening as post-pandemic demand recovered faster than upstream investment, which had fallen sharply during 2020-2021.
Oil-market conditions: Russia’s full-scale invasion of Ukraine on February 24, 2022, and the sanctions that followed on Russian oil and gas exports, pushed Brent crude to an intraday peak near $139 a barrel in early March 2022 — the highest level since 2008 — and kept prices above $120 into late May. European natural gas prices rose to unprecedented levels separately from oil. The United States announced a release of 180 million barrels from its Strategic Petroleum Reserve in March 2022, the largest release in the reserve’s history, to help moderate prices.
Corporate impact: Elevated crude and gas prices, combined with record refining margins, began flowing directly into major producers’ quarterly results starting in Q1-Q2 2022, setting up the record full-year and Q3 figures detailed elsewhere in this timeline.
Government response: The European Union moved to reduce dependence on Russian energy imports; the International Monetary Fund recommended in August 2022 that governments consider windfall profit taxes targeted at energy-sector “economic rents,” explicitly excluding renewable energy, while cautioning that such measures be temporary and well-designed to avoid discouraging investment.
Current relevance: This remains the defining event of the modern energy-crisis era discussed in this guide, and the direct cause of the profit figures that dominate this topic’s public discussion.
A Post-Pandemic Demand Rebound Sets the Stage for 2022
Economic background: As vaccination programmes advanced and major economies reopened through 2021, industrial activity, road traffic and air travel all recovered faster than many forecasters had expected a year earlier.
Oil-market conditions: Demand growth outpaced the pace at which OPEC+ was willing to restore the output it had cut in 2020, and Brent crude recovered steadily across the year to trade above $70 a barrel by year-end 2021 — still well below 2008’s record, but a sharp reversal from 2020’s collapse.
Corporate impact: Major producers returned to profitability in 2021 after 2020’s losses or sharply reduced earnings, rebuilding balance sheets and cash reserves that several companies later cited when explaining their capacity to raise shareholder distributions once 2022’s record prices arrived.
Government response: OPEC+ increased output gradually and cautiously through 2021 rather than fully reopening the taps at once, a stated strategy of avoiding a repeat of 2020’s oversupply.
Current relevance: This recovery year is the direct bridge between 2020’s historic collapse and 2022’s record profits — underinvestment and cautious supply restoration during this period are cited by independent analysts, including the IEA, as contributing to the tighter market 2022’s invasion then shocked further.
COVID-19 Triggers a Historic Demand Collapse — and Negative Oil Prices
Economic background: Global lockdowns beginning in March 2020 halted travel and industrial activity almost simultaneously worldwide, an unprecedented, near-instant demand shock unlike any prior oil crisis on this timeline, which were driven by supply disruption rather than demand collapse.
Oil-market conditions: On April 20, 2020, the WTI futures contract for May delivery fell below zero for the first time in history, settling around -$37.63 a barrel, as storage capacity at the Cushing, Oklahoma delivery point neared its limit. OPEC+ responded with a coordinated cut of approximately 9.7 million barrels per day beginning in May 2020, the largest production cut ever agreed by the group.
Corporate impact: Major oil companies reported steep losses or sharply reduced profits across 2020, with several majors cutting dividends for the first time in years and significantly reducing capital investment in new production.
Government response: Governments worldwide focused on broader pandemic economic support rather than energy-specific measures; the historic OPEC+ cut was itself a producer-coordinated response rather than a consuming-government intervention.
Current relevance: The 2020 collapse in upstream investment is frequently cited by independent analysts, including the IEA, as a contributing factor to the tighter supply conditions that helped amplify the 2022 price surge two years later.
The US Shale Boom and an OPEC Market-Share Battle Crash Prices
Economic background: Rapid growth in US shale oil production through the early 2010s added millions of barrels a day of new, non-OPEC supply to the global market.
Oil-market conditions: Rather than cutting output to defend prices, OPEC — led by Saudi Arabia — opted in November 2014 to maintain production and compete for market share, a decision that helped drive a roughly 55% price decline between June 2014 and January 2015; prices fell below $30 a barrel by February 3, 2016, with the 2016 annual average settling at $43.73.
Corporate impact: Upstream-heavy producers and oilfield-services companies faced severe financial strain, with widespread project cancellations, layoffs and, for some smaller US shale operators, bankruptcy; integrated majors with large downstream refining operations were comparatively insulated, since lower crude costs improved refining margins even as upstream earnings fell.
Government response: Oil-dependent economies, including several US shale-producing states and oil-exporting nations, faced budget pressure; this period prompted several producing countries to accelerate economic diversification planning.
Current relevance: This crash is the clearest historical illustration of the upstream-versus-downstream dynamic explained later in this guide: the same price move can hurt one segment of an oil company’s business while helping another.
Crude Oil Hits an All-Time High, Then Crashes With the Financial Crisis
Economic background: Strong global demand growth, particularly from rapidly industrialising economies, combined with tight spare production capacity and significant speculative investment flows into commodity markets.
Oil-market conditions: Crude oil reached its then-record nominal peak of $147.27 a barrel on July 11, 2008. As the global financial crisis unfolded later that year, demand expectations collapsed and prices fell to $30.28 a barrel by December 2008 — one of the fastest and largest price reversals in the market’s history.
Corporate impact: Major oil companies posted strong profits through mid-2008 on the back of high prices, followed by a sharp earnings contraction as prices collapsed in the year’s final months, illustrating how quickly commodity-linked earnings can reverse.
Government response: Policy attention shifted rapidly toward the broader financial crisis; commodity-market speculation became a subject of subsequent regulatory review in the following years.
Current relevance: The 2008 episode remains the standard historical comparison point for any discussion of oil-price volatility and the speed with which producer earnings can move in both directions.
Oil Prices Collapse Amid the Asian Financial Crisis and OPEC Oversupply
Economic background: The 1997-98 Asian financial crisis sharply reduced regional oil demand at a time when OPEC had recently increased production quotas, and a mild Northern Hemisphere winter further softened demand.
Oil-market conditions: Brent crude fell to around $10 a barrel by December 1998, among the lowest inflation-adjusted prices of the modern oil-market era, and a sharp contrast to the price spikes surrounding both the preceding Gulf crisis and the 2000s boom that followed.
Corporate impact: Depressed prices contributed directly to a wave of oil-industry consolidation, including several of the mergers that created today’s integrated majors — helping explain why the sector’s largest companies are structured as broad, multi-segment integrated firms rather than narrower specialists.
Government response: OPEC subsequently agreed new output cuts in 1998-99 aimed at supporting prices, contributing to the market’s recovery into the early 2000s.
Current relevance: The corporate mergers that followed this collapse are a direct, traceable reason several of today’s largest oil majors are integrated companies spanning upstream and downstream operations, a structure explained later in this guide.
Iraq’s Invasion of Kuwait Sends Oil Prices Sharply Higher
Economic background: Global oil markets had been relatively stable through the late 1980s following the 1986 price collapse, with prices trading in a comparatively narrow range.
Oil-market conditions: Iraq’s invasion of Kuwait in August 1990 removed a significant share of global supply from the market, sending prices from around $17 a barrel to the high-$30s within weeks, with some measures showing an even sharper spike before easing. The International Energy Agency coordinated a release of strategic reserves among member countries, and Saudi Arabia and other producers increased output to help offset the shortfall.
Corporate impact: The price spike proved comparatively short-lived; by the time the US-led coalition’s military campaign concluded in early 1991, prices had already begun falling back, limiting the episode’s effect on full-year corporate earnings compared with the more sustained 1970s shocks.
Government response: This episode became a template for later coordinated strategic-reserve releases, referenced explicitly by the IEA and G7 governments during both the 2022 and 2026 crises described elsewhere in this timeline.
Current relevance: The 1990-91 IEA-coordinated reserve release remains the historical precedent most frequently cited when governments discuss releasing strategic reserves during a modern supply shock.
Saudi Arabia Abandons Its Swing-Producer Role and Prices Collapse
Economic background: Through the early 1980s, Saudi Arabia had repeatedly cut its own output to defend the official OPEC price, ceding market share to other producers while its own production fell from roughly 10 million barrels a day in 1980 to around 2 million by 1985.
Oil-market conditions: In 1985-86, Saudi Arabia reversed course, sharply increasing production to reclaim market share rather than continuing to defend price alone. The resulting oversupply drove prices down from around $30 a barrel to below $10 at points during 1986, one of the steepest sustained collapses in the market’s history.
Corporate impact: Lower prices strained producer economies and smaller oil companies, while benefiting downstream refining margins and oil-importing economies — an early, large-scale illustration of the upstream-downstream divergence this guide explains in detail later.
Government response: The collapse prompted OPEC to move toward a formal quota system intended to better coordinate members’ output going forward, an institutional precursor to the OPEC+ coordination structure formed three decades later.
Current relevance: This episode is the clearest historical precedent for the idea that a major producer can choose to prioritise market share over price — the same strategic choice OPEC faced again, with a similar outcome, during 2014-16’s shale-driven price war described elsewhere in this timeline.
The Iranian Revolution Triggers a Second Oil Shock
Economic background: Global oil demand had grown substantially through the 1970s, leaving markets with limited spare capacity to absorb a major supply disruption.
Oil-market conditions: The 1979 Iranian Revolution disrupted Iranian oil exports and triggered widespread panic buying; nominal prices roughly tripled between 1979 and 1980, with the subsequent Iran-Iraq war (from September 1980) prolonging the disruption. In inflation-adjusted terms, some estimates place the effective 1980 peak above $100 a barrel in today’s dollars, though nominal prices at the time were far lower.
Corporate impact: Higher prices boosted producer revenues, but the shock also accelerated a structural shift in oil-importing economies toward energy efficiency and diversification away from oil-fired power generation, which reshaped long-run demand growth for decades afterward.
Government response: Oil-importing governments, particularly in the US, Japan and Western Europe, expanded strategic reserves and energy-efficiency policy in direct response to the 1970s shocks, forming the policy foundation still in use today.
Current relevance: The 1979-80 shock, alongside 1973, is the historical origin of most modern strategic-petroleum-reserve systems still operated by IEA member countries.
The OPEC Oil Embargo Quadruples Prices and Redraws Energy Policy
Economic background: Industrialised economies had built decades of rapid post-war growth on cheap, plentiful oil, with limited domestic production capacity in most major importing countries.
Oil-market conditions: In October 1973, Arab members of OPEC imposed an embargo on countries supporting Israel during the Yom Kippur War, cutting exports and roughly quadrupling nominal oil prices from around $3 to nearly $12 a barrel within months — the founding shock of the modern oil-crisis era.
Corporate impact: Producing nations and their national oil companies saw dramatically higher revenues, while oil-importing economies experienced fuel shortages, rationing and recessions — a stark early example of the same price move affecting producers and consumers in opposite directions.
Government response: The crisis directly led to the creation of the International Energy Agency in 1974 as a coordinating body for oil-importing countries, and to the first generation of strategic petroleum reserves, energy-efficiency standards and fuel-diversification policy across the industrialised world.
Current relevance: Nearly every institution and policy tool described in this guide’s later sections — the IEA, strategic reserves, energy-security policy — traces its origin to this single 1973 event.
📜 History Insight
Energy markets have experienced repeated cycles of shortages, surpluses and price volatility over the past five decades — 1973, 1979, 1990, 1998, 2008, 2014-16, 2020, 2022 and 2026 are not isolated events but a recurring pattern. Every major spike above has been followed, eventually, by a correction; every crash has been followed, eventually, by a recovery. That pattern is itself the single most useful piece of context for interpreting any single quarter’s headline profit number.
How Oil Companies Actually Make Money
Three linked businesses, not one — and why that structure matters for understanding profit.
An oil company’s profit is not one number driven by one price. It is the sum of several distinct businesses, each responding to market conditions in its own way. Upstream is exploration and production — finding oil and gas reservoirs, drilling wells and extracting crude oil and natural gas. This is the segment most directly exposed to the crude oil price: when Brent or WTI rises, upstream revenue rises roughly in step, while the cost of getting a barrel out of the ground changes far more slowly. Midstream covers transport, storage and pipelines — the often-overlooked connective tissue moving crude from the wellhead to the refinery and refined products onward to distribution terminals, typically operating on longer-term contracts that are less directly exposed to daily price swings. Downstream is refining, petrochemicals, marketing and retail — turning crude oil into petrol, diesel, jet fuel and chemical feedstocks, and selling them. Downstream profitability depends far more on the refining margin — the spread between the crude oil input cost and the refined product output price — than on the level of the crude price itself; a refiner can, in principle, do well even when crude prices fall, if the margin between crude and refined products widens.
An integrated oil company — ExxonMobil, Shell, BP, Chevron and TotalEnergies are the standard examples — operates across some combination of all three segments. This structure is a direct legacy of the industry consolidation that followed the 1998 price collapse described in the timeline above, and it gives these companies a natural hedge: when crude prices fall, upstream earnings usually fall too, but downstream refining margins often improve, because cheaper crude is a lower input cost for the refining business. When crude prices spike, as in 2022, upstream earnings rise sharply — and if refining capacity is simultaneously tight, as it was that year, downstream earnings can rise at the same time rather than offsetting the move, which is part of why 2022’s combined profit figures were so large relative to prior price spikes.
Independent oil companies, by contrast, typically concentrate in just one segment — pure upstream exploration-and-production firms, or independent refiners with no upstream production of their own. Their earnings tend to be more volatile than an integrated major’s, precisely because they lack the internal hedge that comes from spanning multiple segments.
How Fuel Prices Are Calculated
What actually makes up the price at the pump, step by step.
Crude Oil Cost
The single largest component of most fuel prices: the cost of the crude oil itself, set by the global Brent or a regional benchmark price and converted into a per-litre or per-gallon cost.
Refining Cost and Margin
The refiner’s cost of turning crude into finished fuel, plus its margin — this is where refining-capacity tightness, like that seen in 2022, can add cost independently of the crude price.
Distribution and Marketing
Transport from refinery to terminal to filling station, plus retailer operating costs and margin — typically a smaller, more stable share of the total than crude and refining.
Excise Duty and Fuel-Specific Taxes
A fixed or near-fixed per-litre tax set by national or subnational government, which does not move with the crude price and can therefore become a larger or smaller share of the total as prices swing.
Value-Added or Sales Tax
A percentage-based consumption tax applied to the final price in most jurisdictions, which — unlike excise duty — does rise in absolute terms when the underlying price rises.
The Global Oil Market: Supply, Demand and Where Profit Actually Comes From
Exploration, production, refining, transportation and retail, in the order a barrel of oil actually travels.
Exploration and Production
Finding new, commercially viable oil reserves requires years of geological survey work and substantial upfront capital before a single barrel is produced. Investment in new exploration fell sharply during 2015-16’s price crash and again during 2020’s pandemic demand collapse — a pattern the International Energy Agency and independent analysts have both pointed to as a contributing factor to the tighter supply conditions that amplified the 2022 price spike, since new production capacity added today reflects investment decisions made several years earlier.
Production and OPEC+’s Role
OPEC+, the coalition of OPEC members and allied producers including Russia formed in late 2016, coordinates production targets among its members with the explicit goal of influencing global supply and, by extension, price. Its decisions — to cut output, as in April 2020’s historic 9.7 million barrel-per-day agreement, or to maintain output, as OPEC did through 2014-16’s market-share contest — are among the single most consequential variables in short-term oil-price movements, arguably more influential day-to-day than any individual company’s own production choices.
Refining
Refining capacity does not expand or contract quickly: building a new refinery takes years, and many governments and companies have been reluctant to invest in new capacity given the industry’s long-term decarbonisation trajectory. That reluctance, combined with pandemic-era refinery closures, left global refining capacity tight heading into 2022, which the IEA has identified as a key reason refining margins — not just crude prices — reached record levels that year, disproportionately benefiting downstream-heavy integrated majors.
Transportation
Crude oil and refined products move by pipeline, tanker and rail between production, refining and distribution points. Chokepoints such as the Strait of Hormuz — through which roughly a fifth of global oil-shipping traffic passes — are a recurring feature of this timeline’s supply shocks, from 1990-91’s Gulf crisis to 2026’s Middle East conflict, because disrupting a chokepoint can constrain supply without any change in underlying production levels.
Retail Fuel Pricing
The price a consumer pays at the pump reflects the crude cost, refining cost and margin, distribution and marketing costs, and government taxation, in the proportions set out in the “How Fuel Prices Are Calculated” section above. Retail fuel margins are typically thin and highly competitive in most markets, which is one reason retail fuel pricing is usually the smallest and most stable contributor to an integrated major’s overall profit relative to upstream and refining.
📊 Economic Insight
Periods of elevated energy prices can increase costs for consumers while simultaneously improving revenues for some producers. This is not evidence that one side is “winning” at the other’s expense — both effects flow from the same global commodity price, which no single household, government or company fully controls.
Corporate Earnings, Shareholder Returns and What Companies Do With Record Profits
Dividends, buybacks and reinvestment — per company disclosures.
When a company reports record profit, it faces a choice, disclosed to shareholders and regulators, about how to allocate that cash: reinvest in new production and refining capacity, pay it out as dividends, repurchase its own shares, reduce debt, or some combination of all four. Per company statements and results announcements, the major oil companies covered in this guide increased shareholder distributions substantially during and after 2022’s record earnings — ExxonMobil, for example, disclosed returning $37.2 billion to shareholders through dividends and share buybacks in 2025 alone, according to its own reporting. Independent analysts, including some at the IEA, have noted that capital reinvestment in new upstream production capacity across the industry has generally grown more slowly than shareholder distributions during this period — an observation this guide reports as independent commentary, not as a company disclosure or an official finding of any wrongdoing, since companies are under no obligation to expand production and shareholder returns are a routine, legal use of profit.
Dividends are regular cash payments to shareholders, typically paid quarterly, and are the most direct way a public company distributes profit. Share buybacks involve a company repurchasing its own shares on the open market, which reduces the number of shares outstanding and, other things equal, increases earnings per remaining share — a mechanism that raised sustained political attention during 2022 given the scale of buyback announcements alongside record profit reports.
Government Taxation and the Windfall Tax Debate
What governments actually did, separated from the argument over whether they should have.
A windfall tax is a temporary, additional levy applied to profits a government attributes to external circumstances — a price spike, a war, a supply shock — rather than to a company’s own effort, investment or innovation. It is a political and fiscal policy label, not a standard accounting term, and its use varies sharply by country and by government. In August 2022, the International Monetary Fund recommended that governments consider windfall profit taxes targeted at energy-sector “economic rents,” explicitly excluding renewable energy, while cautioning that any such measure should be temporary, carefully designed and structured to avoid discouraging future investment.
The United Kingdom introduced an Energy Profits Levy in May 2022 at a rate of 25% on UK oil and gas production profits, on top of the existing 40% headline tax rate already applied to that sector, bringing the combined rate to 65%; the levy was subsequently raised to 35% from January 2023, taking the combined headline rate to 75%, with an investment allowance intended to preserve incentives for continued domestic production. The European Union adopted a mandatory temporary “solidarity contribution” in 2022 requiring fossil-fuel-sector companies to pay at least 33% on profits exceeding 20% above their 2018-2021 average. The United States did not enact a federal windfall tax on oil-company profits; a proposal was discussed in 2022 but did not pass Congress.
Proponents of windfall taxation argue it is a fair, time-limited way to redistribute profits governments judge to be the result of external circumstances rather than company skill, often earmarking revenue for consumer energy-bill support. Opponents argue such taxes discourage future investment in energy supply — including, in some cases, investment in lower-carbon energy the same companies are also funding — and that they penalise success in a way ordinary corporate income tax does not. This guide presents both positions as a live policy debate; neither this guide nor the companies’ own disclosed profitability constitutes evidence for or against either argument on its own.
🏭 Policy Insight
Governments have responded to periods of unusually high energy prices through a range of measures including subsidies, strategic reserves and, in some jurisdictions, temporary windfall taxes. No two governments made identical choices in 2022 despite facing a broadly similar global price shock — a reminder that “windfall profits” is a policy framing applied selectively, not an automatic legal or economic consequence of high prices.
Head-to-Head Comparisons
The four distinctions readers ask about most often.
Brent Crude vs WTI
Upstream vs Downstream
Integrated vs Independent Oil Companies
Windfall Tax vs Corporate Income Tax
The Corporate Earnings Cycle: Why One Quarter Became the Headline
How quarterly reporting turns a market move into a single, citable number.
Public oil companies report results on a fixed quarterly cycle — typically within four to six weeks of each quarter’s end — alongside investor calls in which executives field direct questions from analysts about production volumes, costs, refining margins and capital-spending plans. This cycle is why a single quarter, Q3 2022 (July-September), became the reference point for so much public discussion: it was the first full quarter in which the Russia-Ukraine invasion’s price and margin effects were completely reflected in reported results, rather than partially blended with pre-invasion figures the way Q1 and Q2 2022 were.
Each company’s results separate several figures readers often conflate: revenue (total sales before costs), net income (profit after all costs, taxes and one-off items, calculated under standard accounting rules such as US GAAP or IFRS), and adjusted earnings (a company-defined measure that excludes items management considers non-recurring, such as asset write-downs). The gap between net income and adjusted earnings can be large in an unusual quarter — TotalEnergies’ 2022 results are the clearest example in this guide, where Russia-related asset impairments reduced its IFRS net income well below its adjusted earnings figure for the same year. Reading past the single headline number to which of these three figures is actually being quoted is one of the simplest ways to avoid misreading a quarterly result.
The same cycle explains why 2022’s record profits were followed, within about two years, by headlines describing “falling” oil-company earnings — both sets of headlines describe the same companies operating the same way, responding to a commodity price that moved sharply in one direction and then partially reversed, exactly as it has in every prior cycle this guide’s timeline documents.
Energy Affordability, Inflation and the Household Impact
Why the same price spike hit household budgets and inflation gauges together.
Energy is a direct component of most national consumer price indices and an indirect input into nearly every other good and service, from food transport to manufacturing. When crude and gas prices spiked in 2022, the effect was not confined to the fuel pump or the household heating bill — it fed through into broader inflation figures across most major economies, contributing to central banks’ most aggressive interest-rate tightening cycles in decades. Independent economic analysis, including work published by the World Bank and the IMF, has consistently identified 2022’s energy-price shock as one of the largest contributors to that year’s global inflation surge, distinct from — though occurring alongside — other post-pandemic price pressures such as supply-chain disruption and labour-market tightness.
This is the affordability side of the same coin already described from the producer side: a global commodity price move that raises a household’s heating bill and an oil company’s reported revenue is, mechanically, the identical price move viewed from two different positions in the value chain. Government subsidy programmes, price caps and one-off household energy payments introduced across Europe and elsewhere in 2022-23 were policy responses aimed specifically at this affordability side of the shock, distinct from — and in several countries, funded partly by — the windfall-tax measures described above.
Geopolitical Risk and Energy Security
Why a war on one side of the world can move a fuel price on the other.
Energy security — a government’s ability to ensure a reliable, affordable energy supply for its economy — has been a formal policy priority since the International Energy Agency’s founding in 1974, directly in response to the 1973 embargo described in this guide’s timeline. Every major oil-price shock covered in this guide traces to a geopolitical or supply event rather than a change in underlying long-run demand: an embargo in 1973, a revolution in 1979, an invasion in 1990 and again in 2022, and a regional war closing a shipping chokepoint in 2026. This pattern is why energy security sits alongside affordability and the energy transition as one of the three pillars most national energy policy is explicitly built around, a framing used consistently by the IEA in its own analysis.
Chokepoints such as the Strait of Hormuz, through which roughly a fifth of global oil-shipping traffic passes, concentrate this risk geographically: disrupting a single narrow shipping lane can constrain global supply without any change to actual production levels anywhere, which is precisely the mechanism behind both the 1990-91 Gulf crisis and the 2026 Middle East conflict detailed in this guide’s timeline. Strategic petroleum reserves — government-held emergency crude stockpiles, the largest of which is the US Strategic Petroleum Reserve — exist specifically to give governments a tool to respond to this category of shock without waiting for markets to rebalance on their own, and have been deployed in a coordinated fashion in 1990-91, 2022 and again, per reported G7 discussions, in 2026.
The Energy Transition: Renewables, EVs and Climate Policy
How the shift toward lower-carbon energy intersects with oil-company profitability.
Record 2022 profits arrived during the same period major oil companies were also facing sustained investor, regulatory and public pressure to increase investment in renewable energy and lower-carbon technology. Company disclosures show major producers increasing stated low-carbon investment through this period, though independent analysts have noted that low-carbon spending remained a minority share of total capital expenditure at most majors relative to continued oil and gas investment — an observation this guide reports as independent commentary, not as an official finding. Electric vehicle adoption is the most consequential long-run demand-side factor in most energy-transition scenarios, since road transport fuel is one of the largest single categories of oil demand; the pace of EV adoption directly shapes every major forecaster’s long-run oil-demand projections, though forecasters differ on timing and scale.
Climate policy — carbon pricing, emissions regulations, subsidies for renewable generation — shapes the investment environment oil companies operate within, and is itself informed by the same institutions (the IEA, national governments) that track energy security and affordability. None of these three goals — affordability, security and the energy transition — can be optimised in isolation without trade-offs against the other two, a tension this guide’s concluding section returns to directly.
🔮 Future Watch
Future oil-price and earnings scenarios in this space should be read only from official sources: company guidance issued alongside quarterly results, IEA World Energy Outlook scenarios, OPEC’s own Monthly Oil Market Report, and national government policy statements. This guide does not offer its own price predictions; where scenario ranges from these official sources are cited elsewhere on this site, they are explicitly labelled as scenarios, not forecasts of certain outcomes.
Did You Know?
- Saudi Aramco’s 2022 net income of $161.1 billion was, per the company’s own reported figures, the largest annual profit ever recorded by any public company, in any industry, in history.
- Integrated energy companies often operate across exploration, refining, petrochemicals and retail fuel distribution simultaneously, creating multiple, only loosely correlated sources of revenue within one company.
- The WTI oil-futures contract’s brief plunge below zero on April 20, 2020, meant that — for a matter of hours — some traders were technically being paid to take barrels of oil off a seller’s hands.
- The Strait of Hormuz, at its narrowest point, is roughly 33 kilometres wide, yet carries a share of global oil-shipping traffic estimated at around a fifth of the world total.
- The International Energy Agency, now central to global energy-security policy, exists specifically because of the 1973 oil embargo — it did not exist in any form before that crisis.
Data Reference Tables
Historical prices, major crises, corporate earnings, production, refining capacity and policy responses, in one place.
Historical Oil Price Benchmarks
| Year | Approx. Price Level | Direction | Primary Driver |
|---|---|---|---|
| 1973 | ~$3 → ~$12/bbl (nominal) | Spike | Arab oil embargo |
| 1980 | Nominal prices roughly tripled vs. 1979 | Spike | Iranian Revolution, Iran-Iraq war |
| 1990 | ~$17 → high-$30s/bbl | Spike | Iraq’s invasion of Kuwait |
| 1998 | ~$10/bbl (Brent, Dec) | Collapse | Asian financial crisis, OPEC oversupply |
| Jul 2008 | $147.27/bbl (peak) | Spike | Demand growth, speculation |
| Dec 2008 | $30.28/bbl | Collapse | Global financial crisis |
| Feb 2016 | Below $30/bbl | Collapse | US shale boom, OPEC market-share defence |
| Apr 2020 | -$37.63 (WTI May futures) | Collapse | COVID-19 demand collapse, storage limits |
| Mar 2022 | ~$139/bbl (Brent, intraday peak) | Spike | Russia’s invasion of Ukraine |
| Mar 2026 | $119.50/bbl (Brent, intraday peak) | Spike | 2026 Middle East war, Hormuz closure |
Major Energy Crises Compared
| Crisis | Type | Duration (Acute Phase) | Resolution |
|---|---|---|---|
| 1973 Oil Embargo | Supply shock | ~5 months | Embargo lifted March 1974 |
| 1979-80 Oil Shock | Supply shock | ~18 months | Gradual supply adjustment |
| 1990-91 Gulf Crisis | Supply shock | ~7 months | Coalition victory, IEA reserve release |
| 2020 Pandemic Collapse | Demand shock | ~3 months (acute) | OPEC+ record production cut |
| 2022 Energy Crisis | Supply shock | ~9 months (acute phase) | SPR releases, sanctions adaptation, demand response |
| 2026 Middle East War | Supply shock | Ongoing as of this update | Not yet resolved |
Corporate Earnings Timeline (Full-Year Net Income, Per Company Disclosures)
| Company | FY2022 | FY2023 | FY2024 | FY2025 |
|---|---|---|---|---|
| ExxonMobil | $55.7bn | — | $33.6bn | $28.8bn |
| Shell | $42.3bn | $19.3bn | $16.5bn | $18.1bn |
| Chevron | $35.4bn | $21.3bn | — | — |
| TotalEnergies | $20.5bn (IFRS) | $21.51bn | — | — |
| Saudi Aramco | $161.1bn | $121.3bn | $106.2bn | $93.4bn (prelim.) |
Figures are each company’s own disclosed net income and are sourced to company results announcements; dashes indicate a figure not independently confirmed for this guide as of publication rather than zero or unavailable data. TotalEnergies’ adjusted net income for 2022 was higher than its IFRS net income shown here, reflecting one-off items including Russia-related asset charges.
Government Policy Responses to the 2022 Energy Crisis
| Jurisdiction | Measure | Key Detail |
|---|---|---|
| United Kingdom | Energy Profits Levy | 25% from May 2022, raised to 35% (75% combined) from Jan 2023 |
| European Union | Solidarity contribution | Minimum 33% on profits >20% above 2018-2021 average |
| United States | No federal windfall tax enacted | 2022 proposal did not pass Congress |
| United States | Strategic Petroleum Reserve release | 180 million barrels announced March 2022, largest ever |
| IMF (recommendation) | Windfall tax guidance | Aug 2022: targeted, temporary levies on energy “economic rents” recommended |
Who’s Who in Global Oil: Institutions and Companies
The organisations named throughout this guide, in one place.
International Energy Agency (IEA)
An intergovernmental organisation founded in 1974 in direct response to the oil embargo, coordinating energy-security policy and strategic reserves among its member countries and publishing the widely cited annual World Energy Outlook.
OPEC
The Organization of the Petroleum Exporting Countries, a coalition of major oil-producing and -exporting nations that coordinates production policy among its members to influence global oil-market conditions.
OPEC+
OPEC’s members plus allied non-OPEC producers, including Russia, formed in late 2016 to broaden coordinated production decisions beyond OPEC’s own membership.
U.S. Energy Information Administration (EIA)
The statistical and analytical agency of the US Department of Energy, publishing official US and global energy production, consumption and price data widely used as a primary reference source.
World Bank
An international financial institution that publishes commodity-market analysis, including regular assessments of how energy-price shocks affect developing economies and global growth.
International Monetary Fund (IMF)
An international financial institution that monitors global macroeconomic stability and, in August 2022, recommended governments consider targeted windfall taxes on energy-sector profits.
BP
A UK-headquartered integrated oil major that reported record annual profit for 2022 on a replacement-cost basis, more than double its 2021 result, per the company’s own results announcements.
Shell
A UK-headquartered integrated oil major that reported net income of $42.3 billion for 2022, the highest annual profit in the company’s history, per its own disclosed results.
ExxonMobil
A US-headquartered integrated oil major that reported net income of $55.7 billion for 2022 and a record quarterly profit of $19.66 billion in Q3 2022, per its own disclosed results.
Chevron
A US-headquartered integrated oil major that reported net income of $35.4 billion for 2022, a company record, per its own disclosed results.
Saudi Aramco
The Saudi Arabian state-linked national oil company, the world’s largest oil producer by output, which reported 2022 net income of $161.1 billion — the largest annual profit ever disclosed by a public company.
Continue Reading on AiTimeline
Related evergreen guides on energy, markets and the global economy.
Electric Car Sales and Oil Prices: A 190-Year Relationship
Gold Bull Markets Explained: History, Drivers and Scenarios
The AI Boom: How AI Reshaped Markets and the Global Economy
The U.S. Economy: 250 Years of Growth, Slowdown and Inflation
Explore All AiTimeline Stories
Explore More Timelines
People Also Ask
Frequently Asked Questions
100 questions on oil-company profits, energy crises and how this market actually works.
Why Energy Markets Require Long-Term Perspective
A single quarter’s profit number, viewed on its own, tells a reader almost nothing about an oil company, an energy crisis, or the household budgets both eventually touch. Viewed across the five decades this guide has traced — 1973’s embargo, 1979’s revolution, 1990’s invasion, 1998’s collapse, 2008’s record and crash, 2014’s shale-driven glut, 2020’s negative prices, 2022’s war-driven crisis and 2026’s Strait of Hormuz closure — the pattern is consistent: oil-company profitability is shaped by commodity cycles, production costs, refining margins, investment decisions made years earlier and geopolitical events largely outside any single company’s control, not by a steady, permanent upward trajectory.
Periods of strong earnings have, across every cycle in this record, coincided with broader economic challenges for the consumers paying the prices that generate those earnings. That coincidence is not evidence of wrongdoing on either side — it is the structure of a global commodity market working exactly as commodity markets do, for better and for worse, whether the commodity is oil, gas, gold or wheat. It does mean that energy policy is inescapably a balancing act between four goals that do not always point the same direction: affordability for consumers, a stable investment climate for the security of future supply, fair and proportionate taxation, and a credible path through the energy transition — and reasonable governments, economists and companies genuinely disagree on how to weight those four goals against each other.
Readers evaluating any single headline about oil-company profits are best served by returning to the same sources this guide relies on throughout: a company’s own quarterly results and investor disclosures, official data from the IEA, EIA, OPEC, World Bank and IMF, and named, attributable independent economic analysis — rather than a headline number stripped of the market cycle, tax jurisdiction and business-segment context that actually explain it.
⚠️ Sources & Editorial Note
This guide draws on company results announcements and investor disclosures from ExxonMobil, Shell, Chevron, BP, TotalEnergies and Saudi Aramco; official statistics and analysis from the International Energy Agency, the U.S. Energy Information Administration, OPEC, the World Bank and the International Monetary Fund; and independent, attributed economic reporting and analysis. It does not speculate about undisclosed company strategy, unpublished future earnings, or the outcome of ongoing conflicts referenced in its 2026 timeline entry. Figures for company earnings, tax rates and oil prices are correct as of the sources cited and this guide’s last update, and may be revised as companies and agencies publish subsequent data. This is not investment, tax or financial advice.
Sources & further reading
Every dated entry above was checked against these references. Last reviewed 15 September 2026.
- International Energy Agency (IEA) — Official Site
- OPEC — Official Site
- U.S. Energy Information Administration (EIA)
- IMF: Fiscal Monitor, October 2022 (windfall tax recommendation)
- ExxonMobil — Investor Relations, Quarterly Results
- Shell plc — Annual Reports and Financial Statements
- BP — Annual Reports and Publications
- Chevron — Investor Relations
- TotalEnergies — Results and Publications
- Saudi Aramco — Investor Relations