India Oil Crisis Timeline 1973–2026: How Crude Prices, Petrol, the Rupee and Hormuz Shape India
Explore India's oil crisis timeline 1973-2026: crude prices, petrol and diesel, rupee pressure, the Strait of Hormuz, and India's CNG, hybrid and EV shift.
Latest Story
When oil rises, India feels it in more places than the petrol pump. A Middle East crisis can push up Brent crude, increase India’s oil import bill, create extra demand for dollars, pressure the rupee and raise the cost of transport, aviation, chemicals, plastics, paints and household budgets. That is why every major oil shock, from 1973 to 2026, has also been an India story. This India oil crisis timeline traces that pattern from the first Arab oil embargo through this week’s move toward $100 Brent, and explains — directionally, not mechanically — how each link in the chain actually behaves.
🧠 Quick Answer
India is vulnerable to oil shocks because it imports the large majority of its crude oil — around 88% in FY26. When Brent crude rises sharply, India’s import bill can increase, dollar demand can rise, the rupee can come under pressure, and fuel-linked inflation risks can spread through transport, food, aviation and manufacturing. The impact depends on taxes, subsidies, currency movement, refinery margins and government fuel-pricing policy — it is not automatic or uniform.
India Oil Crisis: Key Questions
What 50+ years of oil shocks show about India
- India’s oil vulnerability comes from high import dependence — roughly 88% of crude consumed is imported, a share that has risen even as the economy has diversified.
- Middle East crises matter because supply routes and price expectations can change quickly, not because every barrel physically comes from the Gulf.
- Oil shocks hit India through more than petrol prices — they can affect the rupee, inflation, airlines, transport, paints, plastics and household budgets.
- Government taxes and pricing policy shape how much of a global crude move actually reaches consumers, and by how quickly.
- Brent crossed $100 a barrel by 10 September 2026, its first time above that level since May 2026, as the US and Iran exchanged escalating strikes near the Strait of Hormuz and the rupee slid past ₹95/dollar for the first time in about two weeks.
- This is not the first spike of 2026 — Brent had already surged past $100, and briefly above $140 earlier in the year, at the height of the conflict, before easing back.
- The 1973 Arab oil embargo was the first clear demonstration that Indian household economics move with Middle East politics, when crude prices near-quadrupled in months.
- Oil was one major pressure point in India’s 1991 balance-of-payments crisis, not the sole cause — low reserves, a wide fiscal deficit and the 1990 Gulf War spike combined.
- High oil prices can make CNG, hybrids and EVs more attractive, but the transition also depends on price, charging access, model availability and consumer trust — it is a shift, not a rout of petrol.
- A negative oil price in April 2020 did not mean free petrol in India — retail pump prices are built from crude cost, refining, transport, dealer margin and taxes, not the international futures price alone.
$100 Oil: What Happens to India?
A simplified transmission mechanism — not a guaranteed chain reaction
How Much Would $120 Oil Cost India?
Drag the slider for a directional read across 7 areas of India’s economy — this is illustrative, not a forecast
Timeline: India’s Oil Crisis Story, 1973–2026
Newest first — every major shock, and how it reached India
Reading the sequence below is the fastest way to see the real pattern: it is rarely one cause repeating, but the same chain — import dependence, dollar demand, rupee pressure, fuel and inflation risk — triggered by different Middle East or global events, more than fifty years apart.
Brent Tops $100 as Tanker Strikes Escalate; Rupee Slides
What happened: The US struck five Iranian oil tankers in the Gulf of Oman and near Kharg Island on 8 September 2026, the largest single-day tanker toll of the six-month conflict; Iran retaliated with ballistic missiles at Jordan, its first strike on a third country’s territory. Brent crude crossed $100 a barrel for the first time since May 2026, reaching about $101.25 on 10 September, per Reuters market data.
Why it matters: The rupee broke past ₹95 per dollar on 9 September, its weakest level in about two weeks, touching an intraday low near ₹95.22 before the RBI intervened with spot-dollar sales to steady it near ₹95.10–95.16. It shows the brief oil-rupee “decoupling” seen in late August did not hold once Brent moved back above $100.
Brent Near $100 as US-Iran Tensions Escalate
What happened: Brent crude traded near $98 on 7 September 2026, close to $97.5 a barrel and a six-week high, after the US and Iran exchanged strikes near the Gulf. The US targeted Iranian oil tankers over the weekend in response to earlier ballistic-missile attacks on US Navy vessels; Tehran struck vessels linked to the US in return and said it would introduce a “restricted” maritime zone beyond the Strait of Hormuz.
Why it matters: This is not the first spike of 2026 — Brent had already crossed $100 and briefly traded above $140, the highest since 2008, earlier in the year at the height of the conflict, before easing. The renewed move toward $100 shows how quickly Hormuz-linked risk can resurface even after markets partly stabilise.
India’s Car-Fuel Shift: CNG, Hybrid and EV Overtake Petrol
What happened: CNG/LPG, hybrid and electric vehicles together accounted for 41.95% of India’s passenger-vehicle registrations in August 2026, edging past petrol and ethanol vehicles at 40.85%, according to FADA (Federation of Automobile Dealers Associations) data — the first time alternative fuels have collectively overtaken petrol. CNG/LPG alone was 25.28% of registrations, hybrids 9.04%, and EVs 7.63%; a year earlier, in August 2025, alternative fuels held only 35.26% against petrol’s 46.37%.
Why it matters: FADA attributed the shift largely to lower ownership costs and consumer concern over the transition to E20 petrol, but rising and volatile crude prices through 2025–26 are part of the same running-cost calculation. Petrol remains the single largest individual fuel category — this is a meaningful shift, not a rout.
Middle East Conflict and Hormuz Risk Intensify
What happened: An escalating US-Iran-Israel conflict through 2026 repeatedly threatened tanker traffic through the Strait of Hormuz, which carries roughly a fifth of the world’s seaborne oil. At the conflict’s peak earlier in the year, tanker loadings from the Gulf were effectively stalled for a period and Brent briefly traded above $140. Periods of de-escalation brought prices back down before renewed strikes pushed them toward $100 again in September.
Why it matters: The pattern — spike, partial de-escalation, renewed spike — shows Hormuz risk behaves less like a single event and more like a recurring pressure that markets have to keep repricing through 2026.
Russia-Ukraine War Shock
What happened: Russia’s invasion of Ukraine disrupted global energy markets; Brent spiked to around $139 a barrel in March 2022, its highest since 2008, on fears over Russian supply and Western sanctions. India responded by sharply reshaping its crude sourcing, ramping up discounted Russian crude imports from under 2% of its total crude imports before the war to well over a third within about a year.
Why it matters: This was the clearest example of India actively managing an oil shock rather than only absorbing it — discounted Russian barrels helped cushion the import-bill impact even as sanctions and price caps reshaped global oil trade routes.
Negative Oil Shock
What happened: US WTI crude futures for May delivery briefly settled at about −$37.63 a barrel as COVID-19 lockdowns collapsed demand and US storage capacity neared its limit, forcing holders of expiring contracts to effectively pay buyers to take oil off their hands.
Why it matters: This did not mean Indian petrol became free. Retail fuel prices in India are built from crude cost, refining margins, transport, dealer commission and — the largest single component — central excise duty and state VAT, which the government in fact raised during this period to capture fiscal room from low crude prices.
Oil Price Crash
What happened: Brent fell from above $115 a barrel in mid-2014 to around $27–30 by January 2016, driven by the US shale boom and OPEC’s decision not to cut output to defend market share.
Why it matters: Lower crude helped India reduce inflation pressure, narrow its current account deficit and gave the government room to raise fuel excise duties without pushing retail prices up much — improving India’s macro stability even as it strained oil-exporting economies and eventually pushed OPEC toward the wider OPEC+ alliance with Russia.
Crude Touches Historic Highs
What happened: Crude oil touched an intraday record of about $147 a barrel in July 2008 amid a broad global commodity boom, before crashing later that year as the global financial crisis hit demand.
Why it matters: India faced a heavy fuel-subsidy burden as state oil marketing companies absorbed “under-recoveries” on petrol, diesel, LPG and kerosene sold below cost, adding fiscal pressure and contributing to elevated inflation through 2008.
India’s Balance-of-Payments Crisis
What happened: By June 1991, India’s foreign exchange reserves had fallen to roughly $1.2 billion — barely enough to cover two to three weeks of imports. The government pledged gold reserves to the Bank of England and the Union Bank of Switzerland and took an IMF loan, then launched the 1991 liberalisation reforms.
Why it matters: Oil was one major pressure point, not the only cause. The 1990–91 Gulf War oil spike raised India’s import bill and cut remittances from Indian workers evacuated from the Gulf, compounding a crisis that was already building from a wide fiscal deficit, low reserves and years of import-substitution policy — this article does not claim oil alone triggered 1991.
Gulf War Oil Shock
What happened: Iraq’s invasion of Kuwait in August 1990 caused a sharp crude-price spike, with oil roughly doubling from about $17 to over $40 a barrel within months on fears over Gulf supply disruption.
Why it matters: The spike added pressure to India’s already fragile external finances, directly feeding into the balance-of-payments crisis that would force the 1991 reforms less than a year later.
Iran Revolution and Second Oil Shock
What happened: The Iranian Revolution disrupted Iran’s oil production and exports, and global crude prices roughly doubled over 1979–80 as fears of a wider supply shortfall spread through markets.
Why it matters: The second shock in six years reinforced how instability in a major oil-producing region could repeatedly expose import-dependent economies like India to sudden price spikes, feeding into inflation and current-account strain through the early 1980s.
First Oil Shock: The Arab Oil Embargo
What happened: Arab members of OPEC embargoed oil exports to nations seen as supporting Israel during the Yom Kippur War, and global crude prices near-quadrupled within months. This changed global energy politics and exposed oil-importing economies, including India, to sudden price shocks for the first time in the modern era.
Why it matters: India, then heavily import-reliant, recovering from war and facing drought years, felt sharp inflation and foreign-exchange strain. It was the first clear demonstration that Indian household economics move with Middle East politics — a pattern this timeline traces for the next 53 years.
OIL SHOCKS ARE NOT ONE EVENT.
THEY ARE THE SAME CHAIN, REPEATING, EVERY TIME MIDDLE EAST RISK RISES.
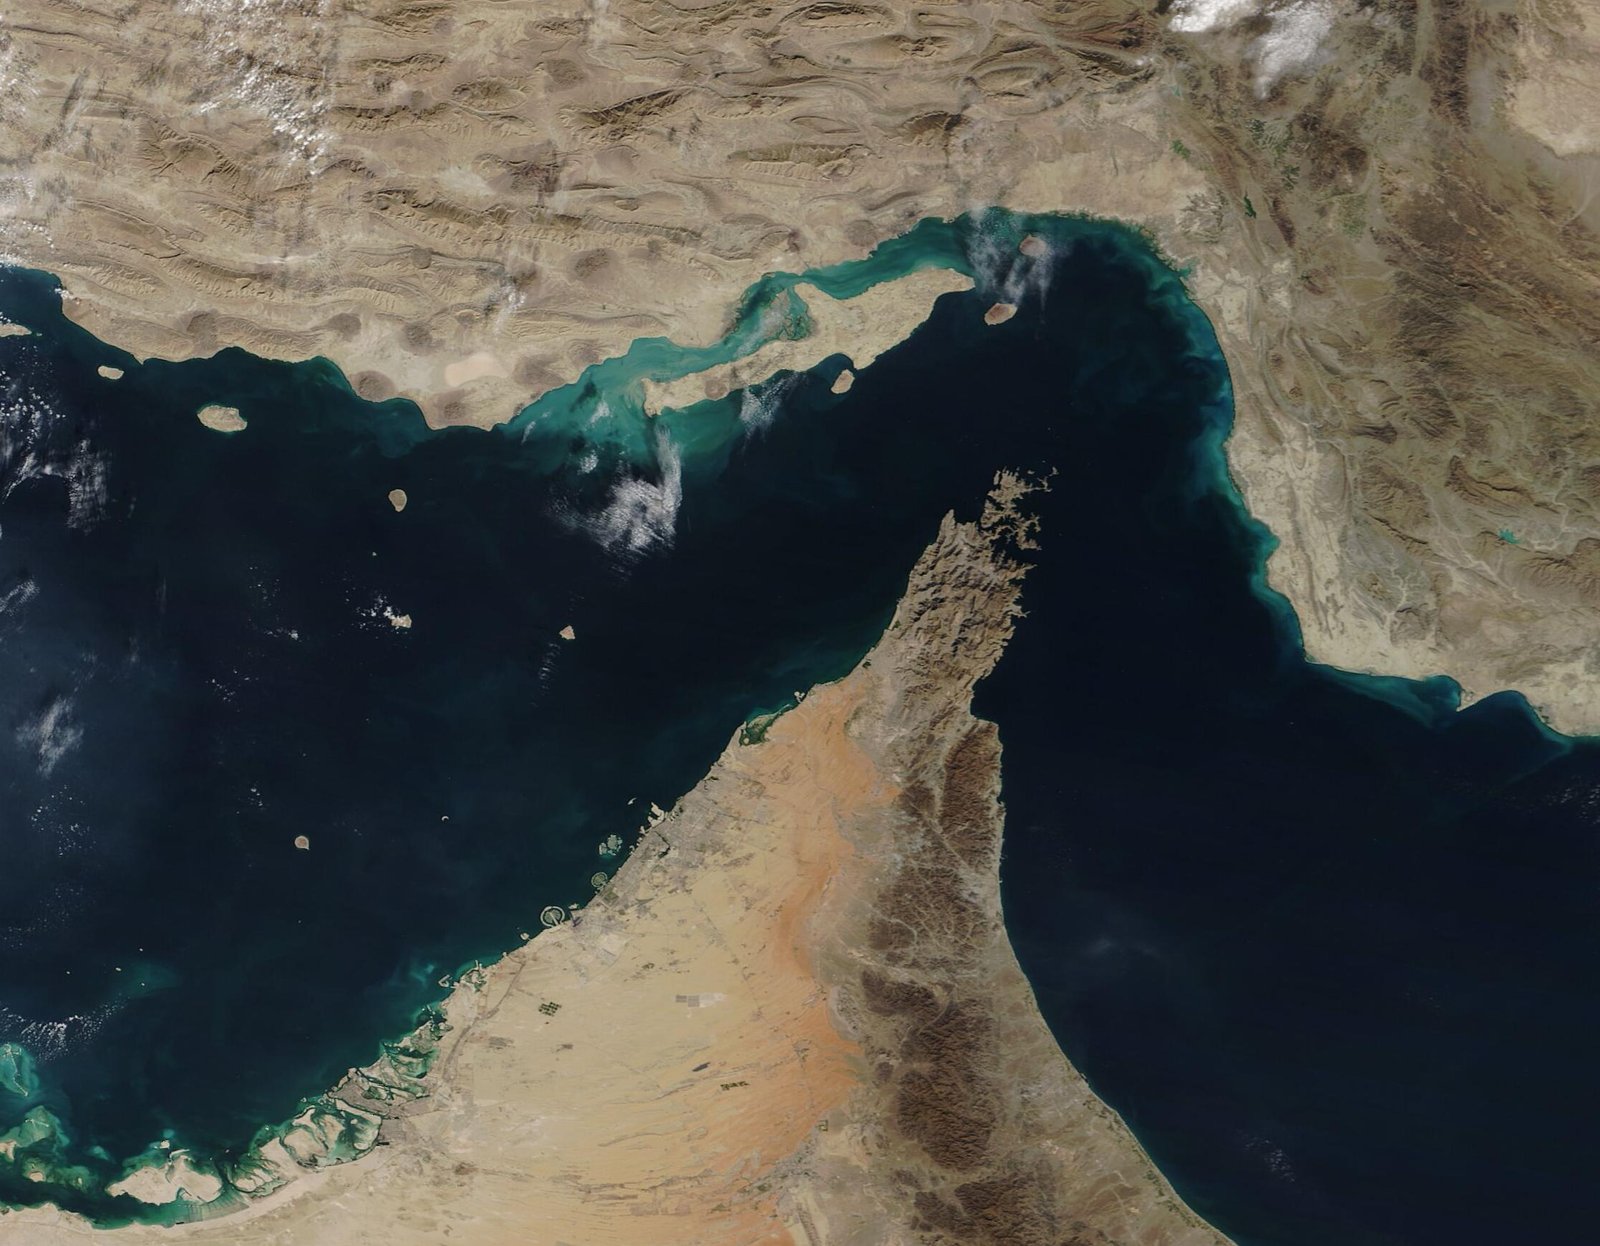
The Strait of Hormuz, seen from NASA’s Terra satellite — the narrow chokepoint through which roughly a fifth of the world’s seaborne oil passes. Credit: NASA Earth Observatory / MODIS Land Rapid Response Team (public domain).
Why the Strait of Hormuz Matters for India
A 33km-wide chokepoint with an outsized effect on Indian pump prices
The Strait of Hormuz separates Iran from the Arabian Peninsula and connects the Persian Gulf to open water via the Gulf of Oman. At its narrowest point it is only about 33 kilometres wide, with shipping lanes just a few kilometres across in each direction — yet an estimated one-fifth of the world’s oil, and a large share of global liquefied natural gas, passes through it. Almost every major Gulf oil exporter — Saudi Arabia, Iraq, the UAE, Kuwait and Iran itself — relies on this single route to reach international markets.
For India, which sources a meaningful share of its crude and LNG from Gulf suppliers, that concentration matters more than the physical distance suggests. Markets do not wait for an actual blockade: a credible threat to Hormuz shipping — a seized tanker, a mined lane, a “restricted zone” announcement — is often enough to push crude prices up on the expectation of disruption, even if cargoes keep moving. That expectation effect is why Hormuz-linked headlines move Brent crude, and by extension India’s import bill, faster than most other single risk factors in the oil market.
Oil Shocks Compared: 1973–2026
Peak prices are approximate and widely reported; figures for 2025–26 are attributed in-text and may be revised
| Year | Event | Approx. peak price | India-side impact |
|---|---|---|---|
| 1973 | Arab oil embargo | ~$3 → $12/bbl | Sharp inflation, forex strain |
| 1979–80 | Iranian Revolution | Roughly doubled | Renewed inflation, current-account strain |
| 1990–91 | Gulf War (Iraq-Kuwait) | ~$17 → $40+/bbl | Fed directly into the 1991 BoP crisis |
| 2008 | Commodity boom | ~$147/bbl (intraday) | Heavy subsidy burden, fiscal pressure |
| 2014–16 | Shale-driven price crash | ~$115 → $27–30/bbl | Lower inflation, narrower CAD |
| 2020 | COVID demand collapse | WTI briefly −$37.63/bbl | Retail prices unaffected by negative futures |
| 2022 | Russia-Ukraine war | ~$139/bbl | India shifted to discounted Russian crude |
| 2026 (peak) | US-Iran-Israel conflict, Hormuz risk | Briefly above $140/bbl | Import-bill and rupee pressure spiked, then eased |
| 1–7 Sept 2026 | Renewed US-Iran strikes | ~$97.5/bbl | Six-week high, watch item for RBI and OMCs |
| 8–10 Sept 2026 | Tanker strikes escalate, Brent tops $100 | ~$101.25/bbl | Rupee weakest in ~2 weeks, RBI intervenes |
The Other Side of High Oil: India’s Shift to CNG, Hybrid and EV Cars
A running-cost story, not a “petrol is dead” story
One consistent side-effect of expensive, volatile crude has been a slow but real change in what Indians choose to drive. In August 2026, CNG/LPG, hybrid and electric passenger vehicles together outsold petrol and ethanol cars for the first time, according to FADA retail data — a milestone AiTimeline covers in depth in its India’s shift from petrol to CNG, hybrid and EV cars timeline. FADA attributed the change mainly to lower running costs and consumer unease over the E20 petrol transition, and rising Brent prices through 2025–26 sit squarely inside that running-cost calculation.
It would be an overstatement to call this “the end of petrol.” Petrol still remains the single largest individual fuel category in India’s car market, and the alternative-fuel category itself is split three ways — CNG/LPG alone (25.28%) is still the biggest driver, with hybrids (9.04%) and EVs (7.63%) growing from a smaller base. What the milestone does show is that when oil prices stay high or volatile for long enough, running-cost math starts to move real purchase decisions, not just headlines.
Facts Worth Knowing
- India’s dependence on imported crude has risen to a record ~88% in FY26, up from 85.5% in FY22, even as domestic output has declined.
- The Strait of Hormuz is only about 33km wide at its narrowest point, yet carries roughly a fifth of the world’s seaborne oil.
- India pledged 47 tonnes of gold to the Bank of England and the Union Bank of Switzerland during the 1991 balance-of-payments crisis.
- Central excise duty and state VAT, not the international crude price alone, make up the largest single component of India’s retail petrol price.
- Brent crude moved from briefly above $140 earlier in 2026, down near $97.5 by early September, then back above $100 by 10 September 2026 — a reminder that Hormuz-linked spikes can unwind and rebuild within the same month.
Explore More Timelines
People Also Ask
Frequently Asked Questions
Related AiTimeline Coverage
⚠️ Editorial & Sources Note
Author: The AiTimeline Editorial Team · Editor: AiTimeline Editorial · Last updated: 11 September 2026. This article does not claim India will definitely face an economic crisis if oil reaches $100, and it does not claim $120 oil is confirmed or forecast — the $120 scenario in this article is illustrative only, used to test a transmission mechanism. It does not claim the 1991 balance-of-payments crisis was caused solely by oil, and it does not characterise India’s CNG/hybrid/EV shift as the end of petrol. Historical oil-price figures for past decades are approximate and widely reported; figures for 2025–26 are attributed in-text to market data and FADA, and may be revised. This is editorial coverage, not investment advice.
Sources & further reading
Every dated entry above was checked against these references. Last reviewed 15 September 2026.
- PIB - India's crude oil import dependence (government data)
- Petroleum Planning & Analysis Cell (PPAC), Ministry of Petroleum and Natural Gas
- Reserve Bank of India - Database on Indian Economy
- US Energy Information Administration - Petroleum & Crude Oil Data
- The Tribune - FADA August 2026 data: alternative fuels overtake petrol
- Trading Economics - Brent Crude Oil live price and news
- NASA Earth Observatory / Wikimedia Commons - Strait of Hormuz satellite imagery (public domain)