India GDP Rank: The Climb to No. 5, and Why It’s Sixth in 2026
India GDP rank explained: how India reached fifth in 2019 and 2022, was projected fourth in 2025, and why IMF 2026 tables put it sixth at $4.15 trillion.
Latest Story
India’s GDP rank is sixth in the world by nominal GDP, at about $4.15 trillion, in the International Monetary Fund’s April 2026 projections, behind the United States, China, Germany, Japan and the United Kingdom. That is a step down from the fourth place India was given in the IMF’s April 2025 projections, and from the fifth place it first reached in 2019. The economy did not shrink: a new GDP series and a much weaker rupee lowered the dollar figure. This timeline follows India from independence and the planning era through the 1991 crisis, the IT boom, the economies it overtook and the reversal of 2026.
💡 Short Answer
India is the world’s sixth-largest economy by nominal GDP, at about $4.15 trillion, in the IMF’s April 2026 projections. It first became fifth in 2019 by passing the UK, fell back in 2020, regained fifth in 2022 and was projected fourth, just ahead of Japan, in April 2025. A downward GDP revision in February 2026 and a weaker rupee pushed it back to sixth. By purchasing power parity it ranks third.
India GDP Rank: Key Questions
India’s GDP Rank in Ten Points
- 1950: India produced about 4% of world output, on Angus Maddison’s estimates, after long colonial stagnation.
- 1950s–70s: planning built industry, but growth averaged about 3.5% a year.
- 1991: a reserves crisis led to devaluation and sweeping reforms; GDP was about $270 billion.
- Late 1990s on: IT and services exports became a major source of dollars.
- 2007: GDP passed $1 trillion; $2 trillion followed in 2014 and $3 trillion in 2021.
- 2015–17: India passed Brazil, Russia, Italy and France.
- 2019: India became fifth for the first time, passing the UK.
- 2022: after slipping in 2020, India passed the UK again.
- 2025: an IMF projection put India fourth, by under $1 billion over Japan.
- 2026: a GDP revision and a weak rupee left India sixth in the IMF’s April tables.
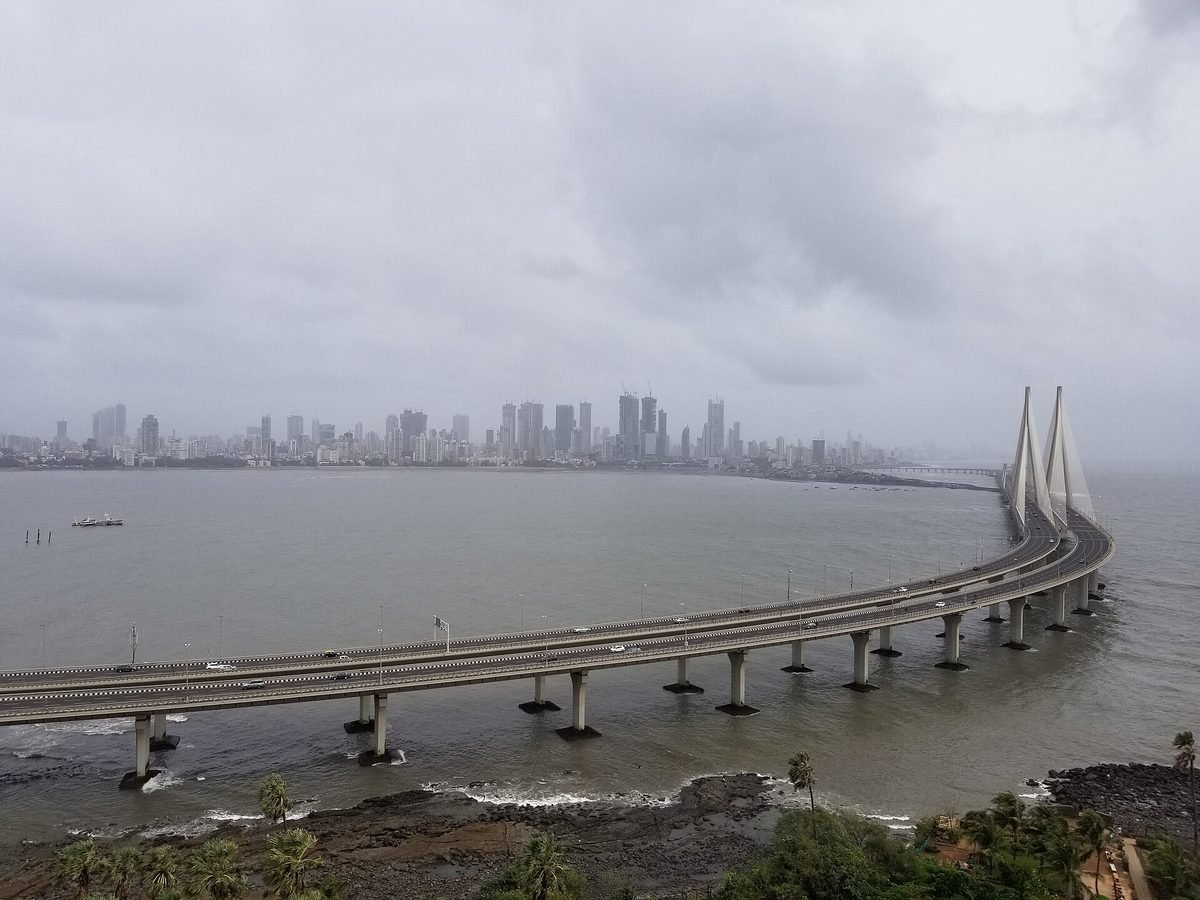
Where did India stand, and on whose numbers?
Tap a year to see India’s rank, its GDP in dollars and the data behind the claim. Nothing you click is recorded.
Choose a year above
India GDP Rank Timeline, 1947–2026
Newest first. Tags show whether a moment was a change in rank, a policy decision, a growth phase or a shock.
A weaker rupee and the next IMF update Shock
The rupee ends the week of 9 October near ₹96.72 per dollar, close to its record low of about ₹96.96 set on 20 May, as high oil prices and foreign outflows persist. The Reserve Bank raises its repo rate to 5.50% on 7 October and opens a dollar window for state oil companies from 12 October. The IMF’s October World Economic Outlook, due during the Annual Meetings in Bangkok, will show whether the weaker rupee has widened India’s gap with the UK and Japan.
Why it matters: real growth is strong, but the dollar figure that sets the ranking depends heavily on the exchange rate. A rupee near ₹97 makes a quick return to fifth harder.
2026
Growth of 7.8% in April–June Growth
Official data show India’s real GDP grew 7.8% in April–June 2026 from a year earlier, beating economists’ forecasts of about 7.1–7.3%. Nominal GDP grew 10.3%. Financial, real-estate and professional services grew 12.1% and manufacturing and construction 8.6%; agriculture grew 3.6%.
Why it matters: it shows the slide in rank is not about output. In rupees, India is still one of the fastest-growing large economies.
IMF puts India sixth at about $4.15 trillion Rank down
The IMF’s April 2026 World Economic Outlook estimates India’s 2026 GDP at about $4.15 trillion, behind Japan (about $4.38 trillion) and the United Kingdom (about $4.26 trillion), so India drops from the fourth place it held in the April 2025 projections to sixth. The IMF still expects India to grow about 6.5% in 2026-27, the fastest of any major economy.
Why it matters: the ‘fourth-largest economy’ headline of 2025 no longer holds on the IMF’s own numbers. Indian Express analysis of the tables shows India regaining fourth around 2027 and reaching third around 2031, but those are projections.
2026
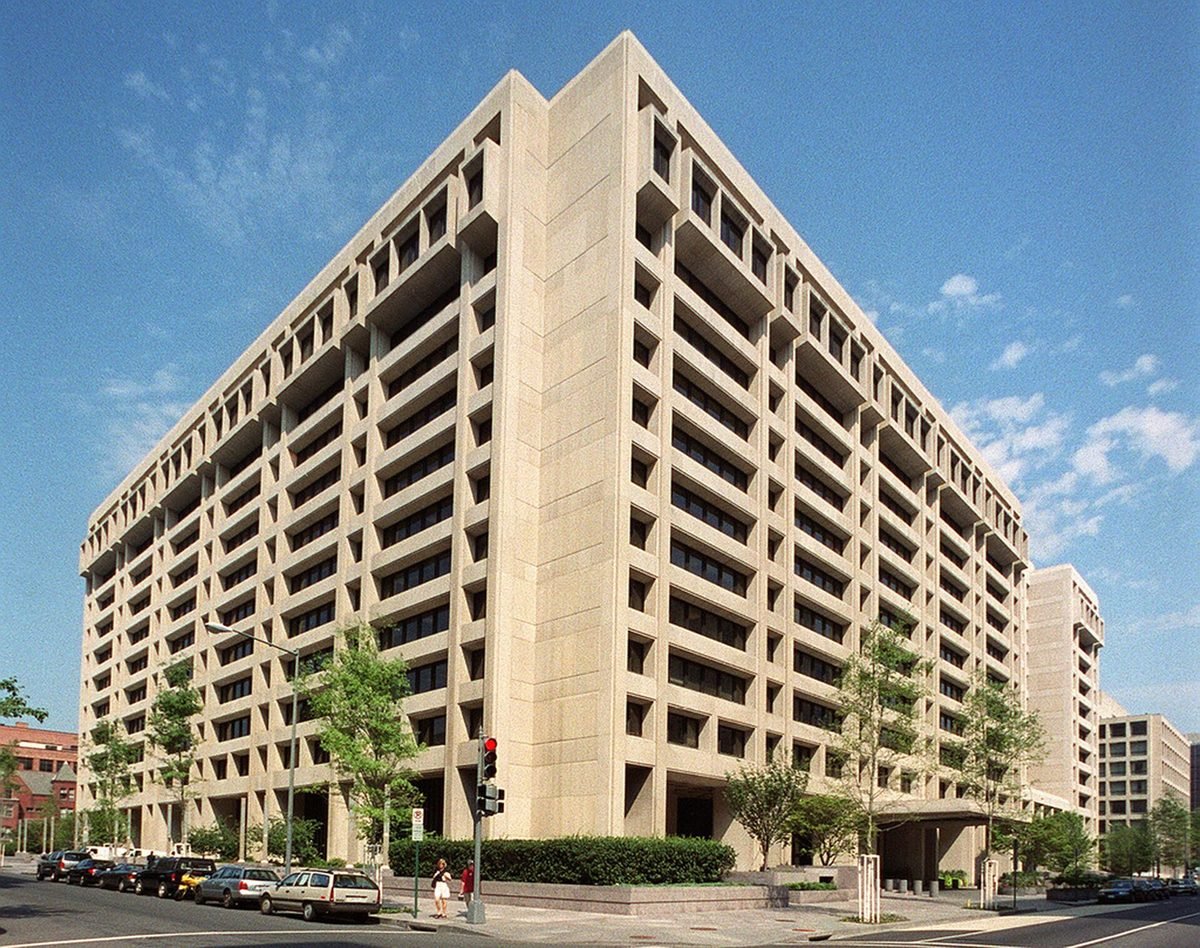
New GDP series lowers the size of the economy Policy
The Ministry of Statistics releases India’s new national-accounts series with 2022-23 as the base year. It estimates 2025-26 nominal GDP at about ₹345 lakh crore, 3.4% below the ₹357 lakh crore of the old series, while raising real growth for the year to 7.6%. The new series uses newer data sources and updated methods.
Why it matters: a smaller rupee base means a smaller dollar figure. Together with the weaker rupee, it explains most of India’s drop in the April 2026 tables.
Tariffs and a falling rupee Shock
The United States doubles tariffs on many Indian goods to 50% from late August, and foreign investors pull money out of Indian shares. The rupee falls past ₹88 and then past ₹90 per dollar for the first time on 3 December. Its 2025 average of about ₹87.2 compares with about ₹83.7 in 2024.
Why it matters: each rupee lost against the dollar shaves roughly 1% off India’s dollar GDP. The 2025 fall started to erase India’s thin lead over Japan.
2025
‘India is now the fourth-largest economy’ Rank
NITI Aayog CEO B.V.R. Subrahmanyam says India has overtaken Japan to become the world’s fourth-largest economy, citing IMF data. The IMF’s April 2025 projections put India’s 2025 GDP at about $4.187 trillion and Japan’s at about $4.186 trillion, a difference of less than $1 billion, for a year that had not yet ended.
Why it matters: it was a projection, not a measured result, and the gap was tiny. It is the main reason headlines from 2025 and 2026 disagree.
India passes the UK again Rank
Bloomberg calculates, using IMF data and quarter-end exchange rates, that India’s economy was larger than Britain’s in the January–March 2022 quarter, at about $854.7 billion against $816 billion. The report comes as the pound weakens sharply and India recovers from the pandemic.
Why it matters: this is the ‘fifth-largest economy’ milestone most people remember, though India had first passed the UK on annual IMF data for 2019.
Pandemic contraction, then recovery Shock
A strict national lockdown from late March 2020 shuts much of the economy. Output in April–June 2020 falls about 24% from a year earlier on first estimates, and the 2020-21 financial year ends close to 6% smaller. With the rupee also weaker, the UK moves back ahead of India in the 2020 dollar rankings. Recovery in 2021 lifts India past $3 trillion.
Why it matters: the shock showed how a large but mostly informal economy can lose jobs and incomes quickly, even as headline GDP later rebounds.
Fifth for the first time Rank
On IMF data, India’s 2019 GDP of about $2.94 trillion passes the United Kingdom’s $2.83 trillion and France’s $2.71 trillion, making India the fifth-largest economy. The ranking is widely reported in February 2020, weeks before the pandemic.
Why it matters: India first reached fifth in 2019, not 2022. Because rankings were then reshuffled in 2020, many later reports date the milestone to 2022.
India overtakes France Rank
World Bank figures released in July 2018 show India’s 2017 GDP at about $2.597 trillion, narrowly ahead of France’s $2.582 trillion, making India the sixth-largest economy. India’s population then was about 20 times France’s, so its income per person was a small fraction of France’s.
Why it matters: it was the first time India entered the world’s top six in modern dollar rankings.
Demonetisation, UPI and GST Policy
The National Payments Corporation of India launches the Unified Payments Interface (UPI) in 2016. On 8 November 2016 the government withdraws ₹500 and ₹1,000 notes, about 86% of the currency in circulation; its economic effects remain debated. On 1 July 2017 the Goods and Services Tax replaces a patchwork of central and state indirect taxes.
Why it matters: UPI and GST changed how money moves and how businesses are taxed. Demonetisation was a separate shock and should not be confused with the longer rise of digital payments.
$2 trillion, a new GDP series and seventh place Rank
India’s GDP crosses $2 trillion in 2014. Jan Dhan bank accounts and Make in India are launched that year. In January 2015 a new GDP series with base year 2011-12 raises measured growth rates. In 2015 the currencies of Brazil and Russia collapse and the euro weakens, so World Bank dollar figures put India seventh, ahead of Brazil, Russia and Italy.
Why it matters: several of India’s climbs up the table came partly from other countries’ currency crashes, just as its 2026 fall came partly from its own.
The global financial crisis Shock
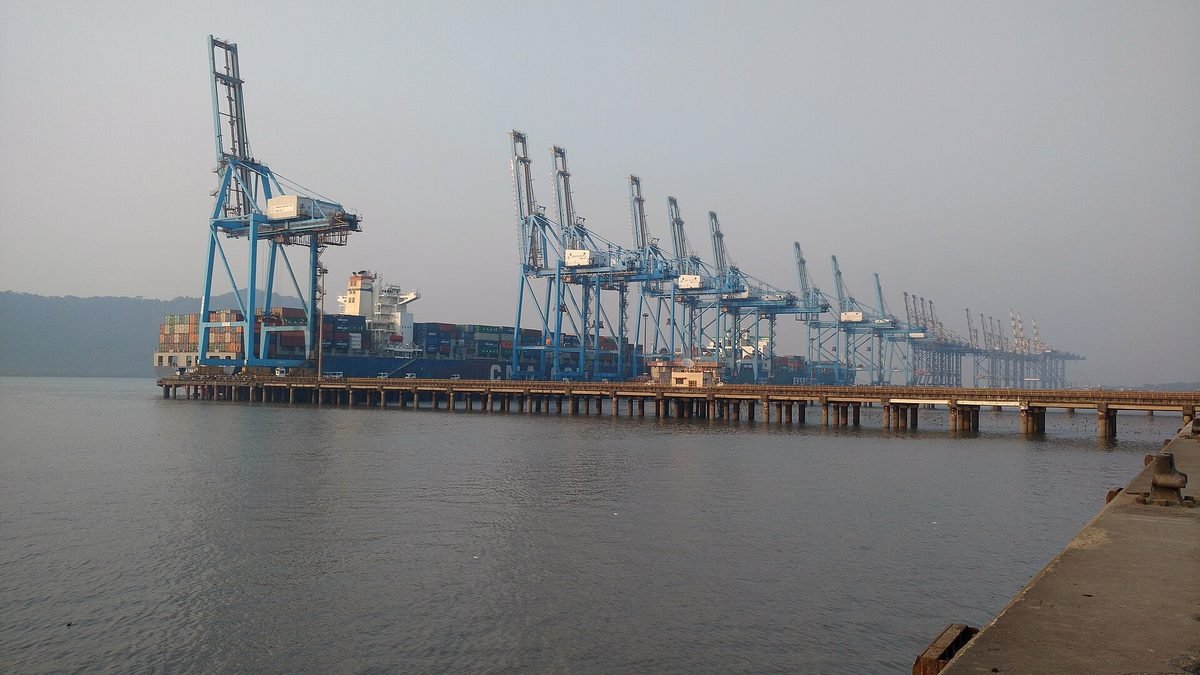
After Lehman Brothers collapses in September 2008, foreign money leaves India and exports fall. Growth slows sharply in 2008-09. The government and the RBI respond with tax cuts, spending and lower interest rates, and growth rebounds in 2009-10 and 2010-11.
Why it matters: India was hit less hard than many economies, but the crisis showed its dependence on global capital flows.
The first trillion dollars Rank
India’s GDP passes $1 trillion for the first time, about 60 years after independence and 16 years after the 1991 reforms. On World Bank figures it ranks around 12th, behind economies such as Brazil, Russia, Spain and Canada.
Why it matters: it took six decades to reach the first trillion; the next three took about seven years each.
The high-growth years Growth
Strong investment, rising savings, booming services exports and cheap global credit push growth to around 8–9% a year in the mid-2000s, the fastest in India’s history to that point. Telecom, construction and finance expand rapidly.
Why it matters: this boom lifted India’s dollar GDP quickly, and a strong rupee in 2007 helped the dollar figure further.
The IT and services boom Growth
Indian software firms win large overseas contracts, helped by Y2K work and lower costs. Infosys lists on Nasdaq in March 1999, the first Indian company on a US exchange. Business-process outsourcing grows in the 2000s, and cities such as Bengaluru, Hyderabad, Pune and Chennai become global technology hubs.
Why it matters: services exports became a steady source of dollars and well-paid jobs, although they employed a small share of India’s workforce.
Crisis and the reforms that changed direction Policy
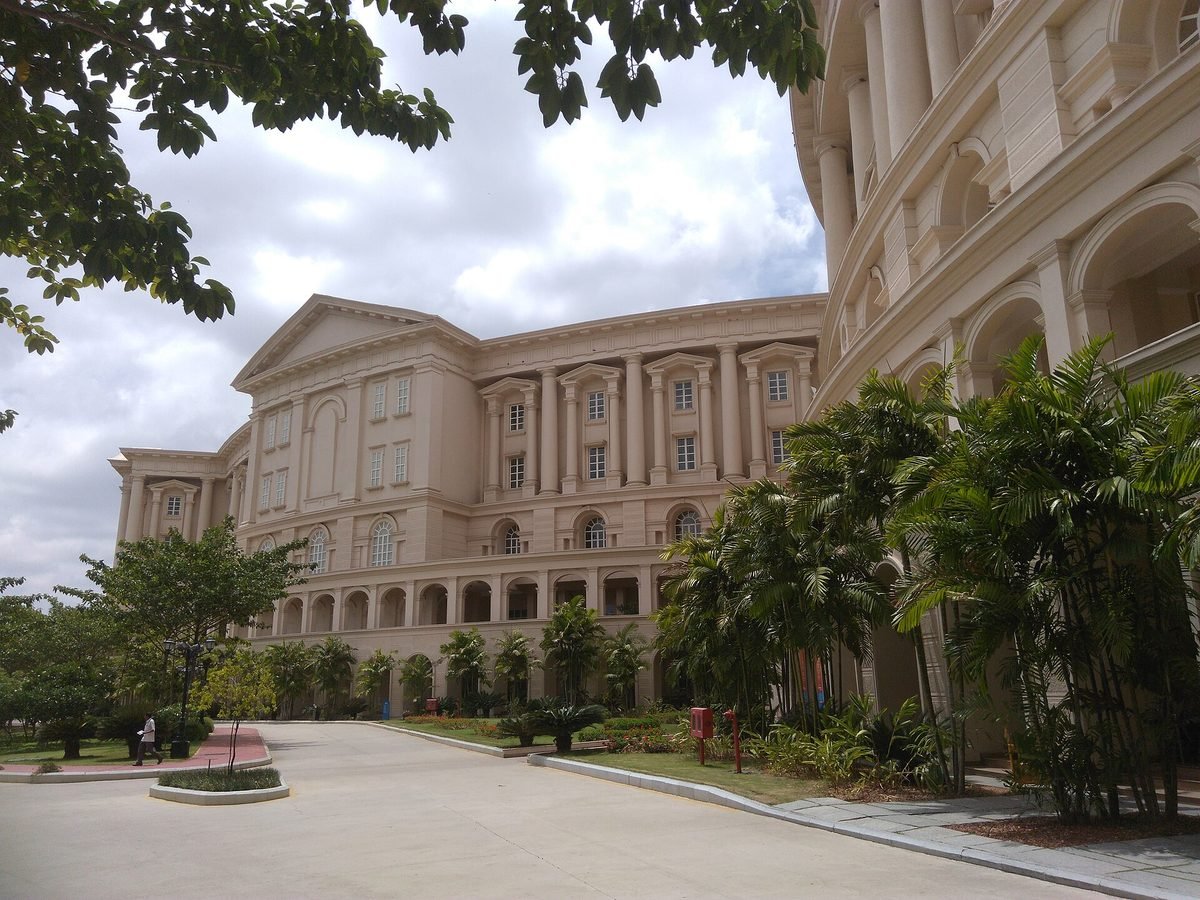
The Gulf War raises oil prices and cuts remittances, and India’s foreign-exchange reserves fall to cover only a few weeks of imports. India pledges gold abroad for emergency loans. The new Narasimha Rao government, with Finance Minister Manmohan Singh, devalues the rupee on 1 and 3 July and, on 24 July, ends most industrial licensing and opens more sectors to private and foreign investment. Trade barriers are lowered over the following years.
Why it matters: the 1991 reforms are the starting point for India’s modern climb. India’s GDP in 1991 was about $270 billion, outside the world’s top ten.
Faster growth, building imbalances Growth
Growth picks up to around 5.5% a year as controls ease at the margin and public spending rises. But the government runs large fiscal deficits and borrows more abroad, often short term.
Why it matters: the faster growth was real, but the borrowing behind it set up the 1991 crisis.
Planning, public industry and the ‘Hindu rate of growth’ Policy
The Planning Commission is set up in March 1950 and the First Five-Year Plan starts in 1951. India builds steel plants, dams such as Bhakra Nangal, and scientific institutions, while licensing and import controls restrict private business. The Green Revolution from the late 1960s raises food output. Growth averages about 3.5% a year, a pace economist Raj Krishna called the ‘Hindu rate of growth’.
Why it matters: the era built industrial and scientific foundations, but slow growth meant India fell behind East Asian economies that grew faster.
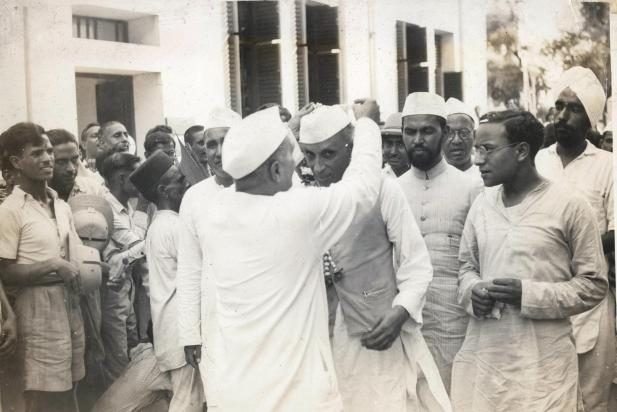
Independence from a stagnant colonial economy Policy
India becomes independent after decades of near-stagnant income per person under colonial rule. Economic historian Angus Maddison’s estimates put India at about 4% of world output in 1950, down from far higher shares in earlier centuries. Most people work in farming, and literacy and life expectancy are low.
Why it matters: it is the low starting point against which the later climb is measured.
How Are GDP Rankings Calculated?
The rankings most often quoted come from the IMF’s World Economic Outlook, published each April and October, and from the World Bank. Both take each country’s GDP in its own currency and convert it into US dollars at market exchange rates. For the current year the figures are projections, and they are revised several times as real data arrive.
That means a country’s rank can change for reasons unrelated to how much it produces: its currency can fall, its statisticians can revise the data, or another country’s currency can rise. India’s climb past Brazil, Russia and the UK and its 2026 slip behind Japan and the UK all owe a great deal to exchange rates.
Same economy, different rupee: where would India rank?
Illustrative arithmetic only. It assumes India’s nominal GDP of about ₹380 lakh crore (2025-26 under the new series plus about 10% nominal growth) and holds Japan ($4.38tn) and the UK ($4.26tn) at the IMF’s April 2026 figures. Pick a rupee rate.
Choose a rate above
About ₹91.5 per dollar reproduces the IMF’s $4.15 trillion. At October 2026’s rate near ₹97, the same rupee economy is worth about $230 billion less in dollars. Real-world figures also move with the yen and the pound.
Nine moments on the way up, and back
Swipe or scroll sideways, then see who India passed and where things stand. Dollar rankings reflect both countries’ currencies.
~$270bn
Outside the top ten after the crisis.
$1 trillion
About 12th; strong rupee helps.
Brazil, Russia, Italy
Their currencies fall; India about 7th.
France
Sixth, by about $15 billion.
UK
Fifth for the first time.
Back to 6th
Pandemic and a weaker rupee.
UK again
Fifth again in Jan–Mar quarter.
Japan?
Fourth in the April 2025 projection.
6th
Behind Japan and the UK in April 2026.
| Economy | When India passed it | What helped | Position in IMF April 2026 |
|---|---|---|---|
| Brazil | By 2015 | Brazil’s recession and the real’s collapse | India ahead |
| Russia | By 2015 | Oil crash, sanctions and a halving of the rouble | India ahead |
| Italy | 2015 | Slow Italian growth and a weaker euro | India ahead |
| France | 2017 (reported July 2018) | Faster Indian growth; margin about $15bn | India ahead |
| United Kingdom | 2019, then again 2021–22 | Indian growth and a weak pound after 2016 and in 2022 | UK ahead (~$4.26tn vs ~$4.15tn) |
| Japan | 2025 (projection only) | A weak yen; margin under $1bn | Japan ahead (~$4.38tn) |
| Germany | Not yet | — | Germany well ahead; IMF tables point to around 2031 |
Most overtakes happened in years when the other country’s currency fell. The 2026 slip is the same mechanism in reverse.
Why Did India Become One of the Largest Economies?
A huge domestic market. About 1.47 billion people create demand for food, housing, transport, phones and financial services. Population alone does not make an economy rich, but it gives a growing economy scale.
Reforms and private enterprise. The 1991 reforms removed licensing, opened sectors to investment and lowered trade barriers. Later changes such as GST and the insolvency code built on them.
Services exports. Software, business services and, more recently, global capability centres earn steady foreign income and pay well, though they employ a small share of workers.
Digital public infrastructure. Aadhaar identity, Jan Dhan bank accounts and UPI payments cut the cost of transactions and brought millions into the formal financial system.
Infrastructure and manufacturing. Public spending on roads, railways, ports and power has risen sharply since the late 2010s, and production-linked incentives since 2020 have drawn investment into electronics, including smartphone assembly.
Four numbers, four different Indias
Each measure answers a different question. Scroll the table sideways on a phone.
| Measure | What it compares | India’s position | What it tells you |
|---|---|---|---|
| Nominal GDP | Output at market exchange rates, in US$ | 6th (~$4.15tn, IMF April 2026) | Weight in trade, markets and global influence |
| GDP at PPP | Output adjusted for local price levels | 3rd, behind China and the US | How much the economy can buy at home |
| GDP per person | GDP divided by population | Roughly $2,800 (≈$4.15tn ÷ 1.47bn) | Average output per person, not household income |
| Real GDP growth | Change in output after inflation | ~7.6% in 2025-26; 7.8% in Apr–Jun 2026 | How fast the economy is actually expanding |
A big total economy and a modest income per person are both true at once. Rankings by total size say little about how most households live.
What India Must Do to Reach the Top Three
Becoming third in dollar terms needs fast real growth and a stable rupee, and the goal that matters more is higher incomes.
✅ What would move India up
- Real growth of 6.5% or more, sustained for years
- Low inflation, so the rupee does not weaken sharply
- More manufacturing and exports, beyond assembly
- More formal jobs, and more women in paid work
- Better schools, skills and health, raising productivity
- Reliable power, water and logistics to attract investment
❌ What a higher rank will not do by itself
- Raise average incomes to rich-country levels
- Create jobs for the millions entering the workforce
- Close gaps between richer and poorer states
- Protect the dollar figure from a falling rupee
- Guarantee a fixed year for third place
Fact Check: Common Claims, Corrected
Checked against IMF, World Bank and Ministry of Statistics data and Bloomberg, Indian Express and Business Standard reports, up to 11 October 2026.
“India is the world’s fourth-largest economy”
Not in the latest IMF tables. The April 2026 projections put India sixth at about $4.15 trillion, behind Japan and the UK. The fourth-place figure came from the April 2025 projection.
“India first became fifth in 2022”
India first passed the UK on IMF data for 2019. It fell back in 2020 and passed the UK again in 2021–22, the milestone Bloomberg reported in September 2022.
“India’s economy shrank in 2026”
No. Real GDP grew 7.6% in 2025-26 and 7.8% in April–June 2026. The rank fell because of the dollar conversion and a statistical revision.
“India overtook Japan by a wide margin”
The April 2025 projection had India ahead by less than $1 billion, about 0.02% of either economy, for a year that had not yet ended.
“The new GDP series made India look bigger”
The opposite for size: the 2022-23 base series cut 2025-26 nominal GDP by about 3.4%, to ₹345 lakh crore, while raising the real growth rate.
“A top-five economy means a rich country”
India’s GDP per person is roughly $2,800, a fraction of Japan’s or the UK’s. Total size reflects population as much as prosperity.
What to Watch Next
The IMF’s October 2026 World Economic Outlook. Due during the IMF–World Bank Annual Meetings in Bangkok (12–18 October), it will update every country’s dollar GDP for 2026 and beyond.
The rupee. At around ₹96–97 per dollar in October 2026, the rupee is far weaker than in early 2025. See our rupee depreciation timeline for the full story.
GDP data. India’s July–September 2026 GDP estimate is due at the end of November. Strong real growth narrows the gap; a weak rupee widens it.
Japan and the UK. A stronger yen or pound would push their dollar GDP up and India’s rank further from fourth.
Explore More Timelines
People Also Ask
Frequently Asked Questions
The Ranking Is a Milestone, Not the Destination
India’s journey from a stagnant post-colonial economy to the world’s top six is a story of reforms, entrepreneurship, technology and a vast domestic market. Its move from fifth, to fourth on paper, to sixth in the space of a year is a reminder that dollar rankings move with currencies and statistics, not only with output.
The more important test is not whether India is fifth, fourth or third in a given IMF table, but whether growth turns into productive jobs, higher household incomes and wider access to opportunity.
Related AiTimeline Stories
⚠️ Editorial Note
Last updated 11 October 2026. GDP figures are rounded and come from different sources: World Bank current-dollar series for past years, IMF World Economic Outlook projections for 2025 and 2026, and India’s Ministry of Statistics for rupee figures and growth rates. IMF and World Bank figures for the same year can differ, and projections are revised. The exchange-rate converter is illustrative arithmetic, not a forecast. This article is for information only and is not investment advice.
Sources & further reading
Every dated entry above was checked against these references. Last reviewed 11 October 2026.
- IMF - World Economic Outlook (April 2026 and later editions)
- PIB / MoSPI - Second advance estimates of GDP 2025-26 on new base year 2022-23 (27 Feb 2026)
- Vision IAS (Indian Express summary) - How Indian economy slid to 6th-largest in the world, with Japan, UK overtaking (18 Apr 2026)
- Asia News Network - India slips to sixth-largest economy in IMF list due to weakening rupee (Apr 2026)
- DD News - India overtakes Japan to become world's 4th largest economy: NITI Aayog CEO (May 2025)
- Business Today - India overtakes UK to become fifth largest economy in the world (Sep 2022)
- Business Today - India surpasses France, UK to become world's 5th largest economy: IMF (Feb 2020)
- Business Today - India becomes sixth-largest economy, squeezing past France (Jul 2018)
- World Bank - GDP (current US$), India