Private Credit Risk Timeline 2008–2026: SRTs, Leverage and the Shadow-Banking Shift
Track private-credit risk from 2008 to 2026: the $1.5-$2 trillion market, the $41 trillion myth, SRTs, NAV financing, loan markdowns and bank links.
Private credit has a numbers problem. Ask how big it is and you may hear $2 trillion, $3 trillion, $30 trillion or $41 trillion — all in credible financial commentary, and all measuring different things. The Financial Stability Board estimates the actual market at roughly $1.5–$2 trillion. Some large asset managers describe a $40–$41 trillion addressable opportunity. That is not the same as $41 trillion already invested in risky loan funds. This private credit risk timeline tracks how the market grew from the 2008 crisis to 2026, what synthetic risk transfers and NAV financing actually do, and why regulators are watching the connections between funds, banks and insurers — without declaring a bubble that no regulator has declared.
Data last verified: 3 September 2026. This article separates observed market data, regulatory findings, industry estimates and risk scenarios. It contains no investment advice, no recommendation to buy or sell any fund, BDC, bond or strategy, and no prediction of a financial crash as fact.
🧠 AI Overview Summary
The Financial Stability Board estimates the global private-credit market at roughly $1.5–$2 trillion in assets at end-2024. Larger figures of $30–$41 trillion describe a broad addressable credit market — loans that could in theory be financed privately — not money already in direct-lending funds; even the industry disagrees, with PIMCO putting a disciplined estimate at $6–$8 trillion. Banks did not leave private credit: they lend to funds (around $220 billion in FSB data, higher in commercial estimates), share borrowers, and transfer credit risk through synthetic risk transfers (about €750 billion of protected assets, roughly 1.1% of bank assets, in a February 2026 Basel Committee analysis). In 2026, loan markdowns, rising non-accruals, redemption limits and software-sector stress became more visible — a Reuters review of 44 US BDCs found aggregate fair value slipping from 99.25% to 97.57% of cost between end-2025 and mid-2026, and non-accruals rising from 2.5% to 3.4%. The IMF assessed systemic risk as contained to date; the FSB says the interconnections warrant closer monitoring before a severe downturn tests them.
Private Credit Risk: Key Questions
What the private-credit debate is really about
- Market size is not addressable market. Private-credit funds and direct lending are roughly $1.5–$2 trillion. The $40–$41 trillion number is a much broader addressable-market concept, mostly investment-grade, and the industry itself disagrees on it.
- The risk question is about location, not just size. The concern is where the risk sits and who is connected to it — funds, banks, insurers, pension funds and shared borrowers.
- Banks did not disappear from private credit. They lend to funds, share borrowers, provide subscription and NAV lines, and buy and sell credit protection through SRTs.
- Private credit is one part of non-bank financial intermediation, not all of “shadow banking.” The terms are not interchangeable.
- Private loans have less continuous price discovery. Many use periodic, model-based fair values, which can smooth reported volatility even when economic risk exists.
- 2026 stress is visible but not systemic. Loan markdowns, higher non-accruals, redemption limits and software-sector weakness are real; the IMF still assessed systemic risk as contained to date.
- Regulators are monitoring, not forecasting collapse. Basel called SRT risks “modest at present”; the FSB is mapping interconnections before a severe downturn tests them.
- The structure is different from 2008. Closed-end private-credit funds often have long-dated, committed capital and no demand-deposit base — not “banks without deposits.”
- The core question: can a roughly $2 trillion market become systemic through its connections to a much larger financial system?
🔴 Reading the status labels used throughout this article
🟢 OBSERVED DATA — a measured figure from filings, official statistics or a regulator’s data collection. 🔵 REGULATORY FINDING — an assessment or estimate published by a supervisor or standard-setter. 🟡 RISK SCENARIO — a hypothetical stress path or “what could happen,” not a forecast. ⚪ INDUSTRY ESTIMATE — a figure or framing from an asset manager or market participant, useful but not neutral. 🔴 NOT ESTABLISHED — not documented as current fact; do not assume it.
Private credit is not a $41 trillion shadow-banking bubble. It is a roughly $2 trillion market whose real question is whether its growing connections to banks, insurers and borrowers could amplify the next credit downturn.
How Big Is Private Credit, Really?
Three different numbers that keep getting mixed together
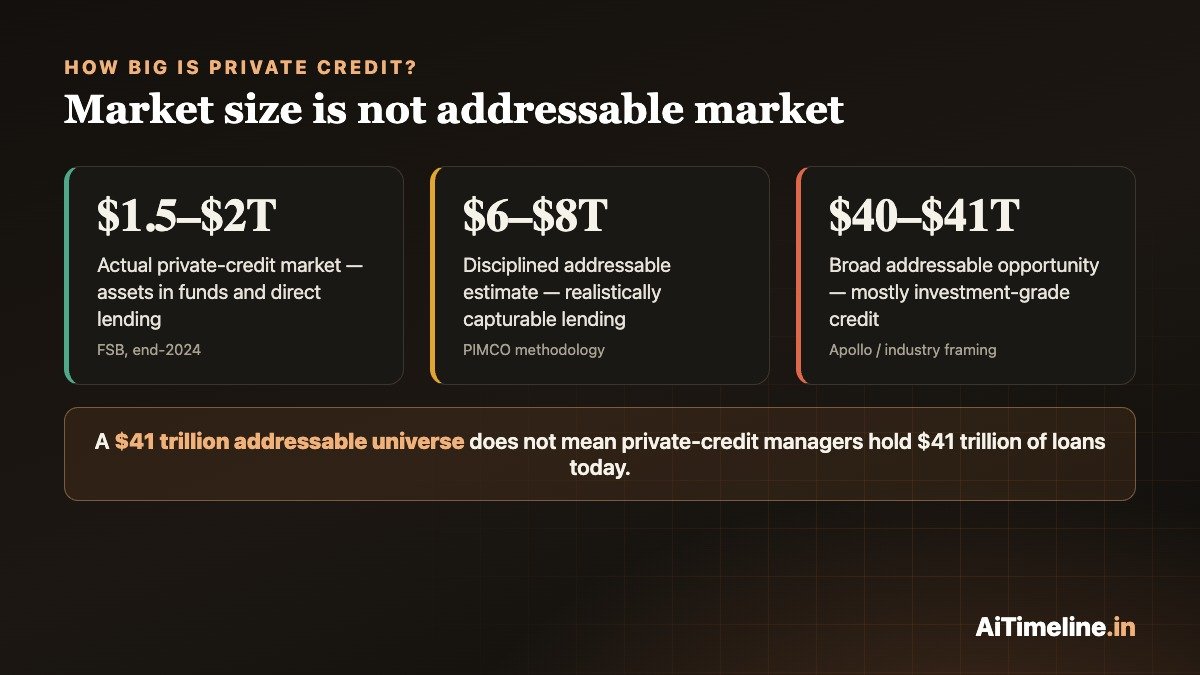
Ask “how big is private credit?” and the honest answer is “it depends what you count.” Strict private-credit funds and direct lending are roughly $1.5–$2 trillion. Broader definitions add investment-grade private lending, asset-backed finance, mortgages, infrastructure credit and other privately originated assets, which produces $30 trillion or $40 trillion-plus addressable estimates. Apollo’s CEO has described a $40 trillion universe, about 95% of it investment grade, with only around $2 trillion in the levered direct lending at the centre of most risk commentary. PIMCO has pushed back: it argues that popular addressable-market sizing lumps in every loan that could theoretically be refinanced privately, and puts a disciplined long-run estimate at $6–$8 trillion once loans already securitised, held by insurers or owned by existing funds are stripped out.
Market size is not addressable market. A $41 trillion addressable universe does not mean private-credit managers currently hold $41 trillion of loans.
Every number needs a source, a date and a definition. FSB: $1.5–$2 trillion, assets, end-2024. Apollo: $40 trillion-plus, addressable / private investment-grade credit definition. Writing “the $41 trillion private-credit market” collapses those into one figure that no regulator uses. The accurate phrasing is “the $40–$41 trillion addressable credit market cited by some industry participants.”
Is Private Credit Really a $41 Trillion Market?
✅ What the $1.5–$2T figure means
- Assets in private-credit funds and direct-lending strategies
- Measured by the FSB across member jurisdictions, end-2024
- Concentrated in the US, then Europe, then a long tail
- The number regulators use to gauge financial-stability exposure
⚠ What the $40–$41T figure means
- A theoretical addressable market of privately financeable credit
- Mostly investment grade — not high-yield direct lending
- Includes asset-backed finance, mortgages, infrastructure, receivables
- An industry framing; PIMCO estimates $6–$8T is realistically capturable
Private Credit in Plain English
A traditional corporate bond goes from a company, through the public bond market, to many investors. A bank loan goes from a company to a bank. Private credit goes from a company to a private fund or institutional lender, through a negotiated loan that is generally not publicly traded and whose terms can be bespoke.
There is no single “private credit”
Risk differs substantially across segments: direct lending, investment-grade private placements, asset-backed finance, distressed and special situations, mezzanine, real-estate debt and infrastructure debt. A senior investment-grade infrastructure loan and a second-lien loan to a leveraged software company are both “private credit,” and they are not the same asset. Private credit has also expanded from middle-market lending into large corporate deals and asset-backed finance — consumer loans, equipment, aircraft, data centres, royalties and receivables — a structural shift, not just growth.
Private Credit Is Not All of “Shadow Banking”
“Shadow banking” is a reader-friendly historical term for non-bank financial intermediation (NBFI) — credit provided outside the regulated banking system. Private credit is one component. Others include money-market funds, hedge funds, finance companies and securitisation vehicles. Pension funds and insurers can invest in private credit without themselves becoming “shadow banks.” Regulators increasingly use “NBFI” precisely because “shadow banking” implies money vanishing into a separate system, when the reality is a network that stays tightly connected to banks.
Private credit is also not “unregulated.” Managers and vehicles are subject to securities law, fund rules, fiduciary duties, investor-protection requirements and, in some vehicles, leverage limits. What differs is prudential regulation: private-credit vehicles are less directly prudentially regulated than bank balance sheets, not exempt from oversight.
Bank Lending vs Private Credit
| Feature | Bank lending | Private credit |
|---|---|---|
| Funding | Deposits, wholesale funding, capital | Institutional and retail fund capital plus financing structures |
| Prudential regulation | Extensive | Depends heavily on vehicle, investor and jurisdiction |
| Loan pricing visibility | Limited for private bank loans; institution-level public disclosure | Limited loan-level price discovery |
| Valuation | Bank loans are not all marked to market daily | Many private assets use periodic, model-based fair values |
| Liquidity | Banks provide liquidity but face liquidity regulation | Closed-end funds often lock capital; semi-liquid vehicles allow limited redemptions |
| Leverage | Heavily regulated | Varies significantly by fund and vehicle |
| Bank connection | Originates and holds loans | Can borrow from banks, share borrowers and buy transferred risk |
| Main vulnerability | Credit, liquidity and funding risk | Credit, valuation, leverage and liquidity/interconnection risk |
Bank accounting is not “everything marked to market daily” — some assets are held at amortised cost, some fair-valued. The accurate contrast is that private credit has less continuous market price discovery.
If a Private Loan Doesn’t Trade Every Day, What Is It Worth?
A public bond has a market price that updates continuously. A private loan may not trade at all, so its value can depend on manager marks, third-party valuation, models, comparable securities and borrower fundamentals. This can smooth reported volatility — but the economic risk still exists, and can show up later and more abruptly than in public markets. PIMCO and Apollo spent much of 2026 publicly disagreeing about how often private assets should be re-marked and how conservative those marks should be.
September 2026: Loans Are Being Marked Down
The clearest fresh evidence that stress is becoming visible
On 2 September 2026, Reuters published an analysis of regulatory filings from 44 US business development companies (BDCs). Their combined investments were worth $92.88 billion in fair value on 30 June against $95.19 billion of reported cost. The aggregate fair-value-to-cost ratio fell from 99.25% at end-December 2025 to 97.77% in the first quarter and 97.57% by mid-2026 — portfolio values moving below cost overall. Across 10 BDCs with comparable filings, loans on non-accrual — where a borrower is significantly behind or considered unlikely to pay, so interest is no longer recognised normally — rose from 2.5% of portfolio cost at end-2025 to about 3.4% by end-June. Non-accrual is not the same as total loss, but rising non-accruals are a stress indicator. Software loans were marked down more frequently than loans in other industries.
📊 Why BDCs are where the stress shows first
Business development companies are publicly regulated investment vehicles, many listed on stock exchanges, that disclose valuations, non-accruals and financial statements. That transparency means the earliest visible signs of private-credit stress often appear in listed BDCs — a 44-BDC sample is useful, but it is one part of the ecosystem, not a read on the entire global private-credit market, much of which discloses far less.
What Happens When AI Threatens the Businesses Private Credit Funded?
Private equity bought software companies; those companies borrowed, often from private-credit funds; higher rates increased the debt-service burden; and now AI may challenge some of those business models and valuations. Cash-flow pressure can then affect debt service. This is a specific sector-concentration test, not a claim that AI has caused every markdown. It also cuts both ways: private credit is financing large AI-infrastructure and data-centre debt while simultaneously absorbing disruption risk in the software borrowers it already lent to.
Both Sides of the Argument
✅ Why private credit may be more resilient than headlines suggest
- Long-dated, committed capital in many vehicles
- Limited daily redemptions in closed-end structures
- Bespoke covenants and direct borrower negotiation
- No bank-like demand-deposit base to run
- Post-2008 bank regulation is stronger; SRTs get more scrutiny than many pre-crisis structures
⚠ Why regulators still worry
- Opacity and limited loan-level price discovery
- Borrower leverage and fund-level leverage
- Valuation uncertainty and incentive to mark optimistically
- Semi-liquid structures with redemption mismatch
- Bank, insurance and private-equity interconnections
- Data gaps: regulators themselves struggle to map the system
Liquidity, Semi-Liquid Vehicles and Redemption Pressure
Traditional closed-end private-credit funds often have long-term committed capital, which reduces classic run risk. The liquidity story changed as wealth and retail-oriented products grew: the IMF estimates about 15%, or roughly $300 billion, of the ~$2 trillion direct-lending universe now sits in semi-liquid structures that permit periodic — often quarterly — redemptions. Many of these funds cap withdrawals. In June 2026, one large Apollo semi-liquid fund limited redemptions after quarterly exit requests reached around 17% of the fund, reviving debate about whether these vehicles promise more liquidity than their assets can support.
Redemption gates protect remaining investors and reduce forced asset sales, but they also mean investors cannot always withdraw everything immediately. This is not identical to a bank run: banks promise deposit liquidity on demand, while private funds have different redemption contracts. The accurate term is redemption pressure, and “bank run” should be used only as a clearly labelled analogy.
A Fund Can Hurt Investors Without Causing a Financial Crisis
Levels 1–3 are investor pain. Only Levels 4–5 approach the systemic-risk question — and that is where bank interconnections matter.
Banks Never Really Left Private Credit
The myth is that private credit replaced banks. In reality, banks originate loans, finance private-credit funds, lend to private-credit borrowers, provide subscription lines, provide NAV loans, create securitisations, execute synthetic risk transfers and distribute private-credit products. The FSB’s May 2026 report captured around $220 billion of drawn and undrawn bank credit lines to private-credit funds across available member data; commercial estimates run to $270–$500 billion. The range is wide because definitions differ, reporting differs and granular data are missing — and that uncertainty is itself one of the regulatory concerns.
Direct exposure can look small while connections are complex. EU banking-sector data compiled by the European Banking Authority has put direct bank exposures to private-credit funds and related managers at roughly €150 billion in mid-2025 — a small share of assets overall, but concentrated in some institutions. A bank with limited direct fund exposure may still share borrowers with funds, provide their credit lines, hold SRT relationships and have insurer links. Headline direct exposure does not reveal the whole network.
What Is a Synthetic Risk Transfer?
A synthetic risk transfer (SRT), also called a significant risk transfer, lets a bank buy protection against some default losses on a portfolio of its loans. An investor agrees to absorb defined losses on a reference portfolio; the loans stay on the bank’s balance sheet; the credit risk is partially transferred; and if regulatory tests are met, the bank may obtain capital relief.
Two corrections matter. First: in a synthetic SRT the bank does not sell the loans to a fund — it transfers defined credit risk while keeping the assets. Second: “insurance” is a useful lay analogy but technically wrong. An SRT is a securitisation / credit-risk-transfer structure with an insurance-like economic effect, not an ordinary insurance policy. Structures split into funded (the investor posts collateral upfront, lowering counterparty-risk concern) and unfunded (the investor provides a guarantee, so collateral is not necessarily upfront and counterparty dependence is greater).
The Basel Committee’s February 2026 SRT Analysis
On 17 February 2026 — not September — the Basel Committee on Banking Supervision published an analysis of synthetic risk transfers. Across Canada, the euro area, the United States and the United Kingdom, protected bank assets were estimated at about €750 billion, roughly 1.1% of total bank assets, with a jurisdictional range of roughly 0.9–1.8%. SRTs have been especially popular in the EU, where new transactions more than tripled between 2016 and 2024 after regulatory changes gave some synthetic securitisations preferential treatment. The SRT investor base is dominated by private investment funds, creating a direct bank-to-nonbank credit-risk connection.
The Committee’s conclusion is the sentence that matters: SRT-related risks — including banks’ increased dependence on non-bank financial intermediaries — appear modest at present, are to some extent actively managed, but merit continued monitoring by supervisors as the market grows and structures become more complex. That is “a fast-growing market needs closer monitoring,” not “Basel sounds a crisis alarm.” In its July 2026 Financial Stability Report, the Bank of England noted UK banks exploring riskier unfunded SRTs and said the Prudential Regulation Authority is testing complex or less robust structures; SRT-protected loans still represent only a small share of major UK banks’ loan books.
Did the bank really transfer the risk?
Partly. A bank may finance the SRT investor, have other exposures to the same fund, share the same underlying borrowers, or depend on nonbank protection. One regulatory question is circularity: if a bank finances the same nonbank that is selling it credit protection, some of that protection may be economically less independent than it looks. This does not mean all SRTs are circular — but risk transfer can coexist with new interconnections.
A NAV loan is borrowing by a fund against the value and cash flows of its portfolio assets, used to provide liquidity or finance distributions, new investments or refinancing. As of April 2026, Moody’s reported the global fund-finance market had passed $1 trillion, with private-credit expansion an important driver. That $1 trillion is fund finance overall — subscription facilities, NAV loans and hybrids — not $1 trillion of NAV loans alone.
NAV loans are not automatically dangerous: they can bridge timing mismatches and reduce pressure to sell assets. Risk depends on loan-to-value, asset quality, covenants, maturity, diversification and leverage already present. The concern is layered leverage: a portfolio company may be leveraged, the fund may borrow, the fund’s investor may also use leverage, and a bank may finance one or more layers. Moody’s has also flagged NAV facilities’ exposure to payment-in-kind (PIK) loans.
PIK and “amend and extend”
With PIK, instead of paying all interest in cash, a borrower adds some interest to the loan balance — temporary breathing room, but a rising debt balance. PIK is not automatically a default, though rising PIK use can be a stress indicator. “Amend and extend” — a lender extending maturity or modifying terms — can avoid an immediate default but can also delay recognition of borrower stress. This is why reported private-credit default rates vary so much: whether the number counts only payment defaults, or also selective defaults, distressed exchanges and PIK modifications, changes the answer.
What Could Happen in a Severe Stress Scenario?
🟡 Scenario, not forecast. Private credit generally does not reprice every millisecond, so stress is more likely to arrive as a slow, quarter-by-quarter feedback loop than a “flash crash.”
Is This 2008 Again?
There are real echoes: opaque credit, securitisation and risk transfer, leverage and complex connections. There are also real differences. Private-credit funds often have longer-duration, committed capital and do not rely on demand deposits, so the classic run dynamic is weaker. Post-2008 bank regulation is stronger, and SRTs receive greater prudential scrutiny than many pre-crisis structures. The market has also not yet been tested through a prolonged, severe downturn. The analogy helps frame the research question about correlated automated behaviour — it does not describe a documented repeat of the global financial crisis.
⚠ Similarities to 2008
- Opaque, hard-to-price credit
- Securitisation and credit-risk transfer
- Borrower and fund leverage
- Complex bank / nonbank connections
✅ Differences from 2008
- Long-dated, committed fund capital
- No demand-deposit base in most vehicles
- Stronger post-crisis bank capital and liquidity rules
- SRTs face more prudential scrutiny than many pre-2008 structures
What Regulators Actually Say
Monitoring and assessing — not forecasting a crash
| Institution | 2026 message |
|---|---|
| IMF | Stress emerging — redemptions accelerating, borrower credit quality softening — but systemic impact appears contained to date; liquidity mismatch largely confined to semi-liquid structures |
| Financial Stability Board | Rapid growth and complex interlinkages with banks create vulnerabilities; borrower credit quality, valuation opacity, leverage, concentration and data gaps warrant closer monitoring |
| Basel Committee | SRT-related risks modest at present and partly managed, but merit continued monitoring as the market grows and structures become more complex |
| Bank of England | SRT use growing, including riskier unfunded structures; NBFI interlinkages create channels that transmit risk back to banks; PRA testing complex structures |
| European Banking Authority | Direct EU bank exposures to private-credit funds limited overall but concentrated in some institutions; indirect links matter |
| European supervisors | Data gaps, including limited granular US information, complicate cross-border risk assessment |
Private Credit Risk Map
⚠️ About this map
This is an AiTimeline editorial risk map based on cited regulator evidence, not an official regulator colour rating. “Amber” means identified as a vulnerability that warrants monitoring; “not present” means no authoritative body has declared it as of September 2026.
Private Credit Risk: The Full Timeline (2008–2026)
Newest first. Each entry carries a status label.
Reuters: BDC Loan Markdowns and Non-Accruals Rise
What happened: Portfolio values across 44 business development companies moved further below cost — aggregate fair-value-to-cost ratio 99.25% at end-2025, 97.77% in Q1, 97.57% by mid-2026 ($92.88bn fair value vs $95.19bn cost at 30 June). Non-accrual loans across 10 comparable BDCs rose from 2.5% to about 3.4% of portfolio cost. Software borrowers saw disproportionate markdowns.
Why it matters: The clearest fresh evidence that stress is becoming visible in the most transparent corner of private credit. It is a sample of listed BDCs, not proof of insolvency across the global market.
Bank of England FSR: Unfunded SRTs and NBFI Links
What happened: The Bank flagged UK banks exploring riskier unfunded synthetic risk transfers — essentially credit guarantees, often bought by insurers — and said the PRA is thoroughly testing complex or less robust structures. It stressed that bank interlinkages with non-bank lenders create channels through which risk can be transmitted back to banks.
Why it matters: SRT use is growing and its structures are getting more complex, but protected loans remain a small share of major UK banks’ loan books.
European Supervisors Push for Better Private-Credit Data
What happened: European regulators pressed for better cross-border private-credit exposure data, reporting difficulty obtaining granular information on US exposures in particular.
Why it matters: The data gap is not theoretical — supervisors themselves have trouble mapping the system, which is one reason exposure estimates vary so widely.
A Large Semi-Liquid Fund Limits Redemptions
What happened: An Apollo semi-liquid credit fund curbed withdrawals after quarterly redemption requests reached around 17% of the fund, reigniting debate about whether wealth-oriented private-credit vehicles offer more liquidity than their assets support.
Why it matters: A real example of redemption pressure and gating in action. It is investor-liquidity stress, not a fund collapse or a systemic event.
EBA: EU Bank Exposures Limited but Concentrated
What happened: EBA data put EU/EEA bank exposures to private-credit funds and related managers at roughly €150 billion as of mid-2025 — a relatively small share of assets on average, but concentrated in some institutions.
Why it matters: Small headline direct exposure does not capture shared borrowers, fund credit lines, SRT relationships and insurer links.
FSB Publishes “Vulnerabilities in Private Credit”
What happened: The FSB estimated the market at $1.5–$2 trillion at end-2024, concentrated in a few jurisdictions (the US around $1 trillion). It captured about $220 billion of drawn and undrawn bank credit lines to funds, noted commercial estimates of $270–$500 billion, and identified complex bank interlinkages, borrower credit quality, valuation opacity, leverage, concentration and liquidity mismatch as vulnerabilities. It urged authorities to close data gaps and harmonise definitions.
Why it matters: The central regulatory reference point — and it frames the issue as vulnerabilities to monitor, not a crisis under way.
IMF Global Financial Stability Report
What happened: The IMF cited a direct-lending universe of about $2 trillion, with roughly 15% (~$300 billion) in semi-liquid structures. It noted investors accelerating redemptions and signs of more borrower defaults ahead, especially for highly leveraged borrowers exposed to AI disruption — but assessed systemic impact as appearing contained, with liquidity mismatch largely limited to semi-liquid vehicles. Scenario analysis pointed to higher default rates under rate or earnings stress without concluding an imminent global crisis.
Why it matters: “Systemic risk contained to date, vulnerabilities rising” is the balanced framing the whole debate should use. The IMF is not forecasting collapse.
Fund-Finance Market Passes $1 Trillion
What happened: Moody’s reported the global fund-finance market — subscription lines, NAV loans and hybrids — had surpassed $1 trillion, driven by demand from the growing private-credit market, and had become a “critical backstop” for private-credit lenders. It flagged NAV facilities’ exposure to PIK loans and weakening asset quality in US direct lending.
Why it matters: Fund-level borrowing is now a $1 trillion-plus layer sitting on top of borrower-level leverage — not $1 trillion of NAV loans alone.
Basel Committee Analysis of Synthetic Risk Transfers
What happened: The Committee estimated about €750 billion of bank assets protected by SRTs across Canada, the euro area, the US and the UK — roughly 1.1% of total bank assets (jurisdictional range ~0.9–1.8%). EU transactions more than tripled from 2016 to 2024. The investor base is dominated by private investment funds. Assessment: risks “modest at present” and partly managed, but they “merit continued monitoring by supervisors as SRT markets continue to grow.”
Why it matters: This is the correct SRT reference — February, not a fictional September alarm — and its tone is monitoring, not warning of a crash.
2026
Private-Credit Stress Becomes More Visible
What happened: Stress clustered around selected funds, redemption requests, valuations and software-heavy portfolios, including high-profile defaults in non-direct-lending private credit that pointed to loose standards and thin collateral in parts of the market.
Why it matters: The point at which “private credit risk” moved from a theoretical discussion to visible data — without any single fund failure defining the whole market.
Bank Partnerships Deepen; Semi-Liquid Products Expand
What happened: Bank–private-credit partnerships continued to grow, SRT use accelerated, and semi-liquid products widened retail and wealth access to private credit. Scrutiny intensified after borrower failures and credit concerns.
Why it matters: The interconnections regulators now worry about were built here — and the investor base widened beyond institutions.
–23
Rates Rise; Floating-Rate Loans Cut Both Ways
What happened: Rapid rate rises boosted lender income on floating-rate private-credit loans but also raised borrower debt-service burdens. A slower private-equity exit environment increased demand for alternative financing.
Why it matters: Higher-for-longer rates are the pressure now showing up as markdowns, PIK and non-accruals in the most leveraged borrowers.
–21
Ultra-Low Rates Scale the Market
What happened: Very low rates and large refinancing markets accelerated private-credit growth, with the market moving into larger corporate deals and asset-backed finance.
Why it matters: Much of today’s outstanding stock was originated in an environment that no longer exists.
–19
Private Equity and Yield Demand Drive Direct Lending
What happened: Private-equity growth, low rates and institutional demand for yield supported the expansion of direct lending, with private funds increasingly financing buyout debt.
Why it matters: The link between private-equity valuations, borrower performance and private-credit loan quality was established in this period.
–12
Post-Crisis Bank Rules Reshape Incentives
What happened: The 2008 crisis was a bank-credit and securitisation crisis. Post-crisis regulation raised bank capital, liquidity and risk-management requirements, making some credit more capital-intensive for banks and contributing to a structural migration of lending toward non-banks.
Why it matters: Capital rules were one driver of private credit’s growth — but not the only one. Private-equity expansion, investor demand for yield, and borrower demand for speed, confidentiality and flexibility all mattered too.
📝 Update History
- 3 September 2026 — Full rewrite: corrected “$41 trillion shadow bubble / biggest financial risk of 2026” framing to the verified “roughly $2 trillion market, $40–$41 trillion addressable, growing interconnections plus emerging stress” picture. Added the 2 September Reuters BDC markdown data, PIMCO’s $6–$8 trillion counter-estimate, the correct February 2026 Basel SRT date and numbers, the 6 May FSB report, the April IMF assessment, Moody’s fund-finance milestone and the June Apollo redemption gating.
- 2 September 2026 — Reuters analysis of 44 US BDC filings.
- July 2026 — Bank of England FSR on unfunded SRTs; European data-gap concerns.
- June 2026 — EBA risk assessment; large semi-liquid fund limits redemptions.
- 6 May 2026 — FSB “Report on Vulnerabilities in Private Credit.”
- April 2026 — IMF Global Financial Stability Report; Moody’s fund-finance >$1T.
- 17 February 2026 — Basel Committee analysis of synthetic risk transfers.
People Also Ask
Frequently Asked Questions
Related AiTimeline Coverage
⚠️ Editorial and Accuracy Note
This article separates observed market data (BDC filings via Reuters, Moody’s), regulatory findings (Financial Stability Board, International Monetary Fund, Basel Committee on Banking Supervision, Bank of England, European Banking Authority), industry estimates (Apollo, PIMCO) and hypothetical risk scenarios, and labels each. Figures were verified as of 3 September 2026. Nothing here is investment advice, a trading signal, or a recommendation to buy, sell or allocate to any fund, BDC, bond or strategy. “Addressable market” is not “assets under management,” “stress signal” is not “systemic crisis,” “non-accrual” is not “total loss,” and “scenario” is not “forecast.” No regulator has declared private credit a bubble.