Gold Bull Markets Explained: History, Drivers and the Scenarios Ahead
Gold price history from 1944 to 2026: real interest rates, central-bank buying and World Gold Council data explained -- historical fact, not a prediction.
Latest Story
On a Tuesday morning in early 2026, an investor in Mumbai watches the gold price on her trading app tick past a level she never expected to see in her lifetime. Headlines about central-bank buying, a softening dollar and a slower-than-hoped global economy scroll past. She adds to a gold position she has held for six years, treating it as insurance she hopes she never has to fully cash in. A floor below her, in the same building, a friend looks at the identical set of headlines and does the opposite: he moves a similar sum into a diversified equity fund, reasoning that his twenty-year horizon and higher risk tolerance are better served by assets that can compound through growth, not just preserve value. Neither of them is wrong. The same economic backdrop — the same inflation data, the same interest-rate path, the same geopolitical noise — can justify very different decisions once you factor in a person’s goals, time horizon and appetite for risk. That tension, not a single “right answer” about where gold is headed, is what this guide is actually about.
This is a reference, not a forecast. It traces gold’s price history from the Bretton Woods era through the record levels reached in 2025 and early 2026, explains the mechanics of what actually moves the gold price, and separates historical fact, official statistics (World Gold Council, Federal Reserve, IMF, RBI), analyst opinions (attributed to the institution or analyst making them) and scenario analysis at every point they diverge. It does not predict where gold will trade next month, next year, or at any specific future date — no one can do that reliably, and any source that claims otherwise is a reason for caution, not confidence.
Both scenes above are deliberately ordinary. Financial media coverage of gold tends to compress a genuinely complex asset into a single narrative — “gold is exploding,” “the bull market’s next half has begun,” “central banks are stockpiling gold before a crisis” — because that version of the story travels further than a careful one. The version supported by the actual public record — World Gold Council demand data, Federal Reserve rate decisions, LBMA price history — is slower, more nuanced, and considerably more useful for an investor trying to make an actual decision than a headline built to be shared. This guide is built entirely from that public record.
📋 Executive Summary
Gold is a physical, globally traded asset that investors hold for portfolio diversification, as a potential inflation hedge, and as a store of value during uncertainty — not because it guarantees returns. Its price is set continuously through spot and futures markets (COMEX, LBMA) and moves with real interest rates, the US dollar, central-bank demand, inflation expectations and geopolitical risk. Gold’s 2025 annual average price was $3,431.50/oz, up 44% year-on-year per World Gold Council data, and it crossed $4,000/oz for the first time in October 2025; the LBMA price averaged a record $4,873/oz in Q1 2026. Central banks bought a combined 863 tonnes in 2025 and have bought over 1,000 tonnes annually in three of the last four years. This guide explains those drivers in full, without predicting what happens next.
🧠 60-Second Overview
Gold is a globally traded precious metal that investors use for portfolio diversification, as a potential hedge against inflation and currency weakness, and as a store of value during economic uncertainty. Its price, quoted in US dollars per troy ounce, is set continuously in spot and futures markets and moves with real interest rates, the US dollar, central-bank purchases, inflation expectations and geopolitical risk. After a multi-decade history of both long bull markets and extended weak periods, gold’s 2025 annual average price rose 44% to $3,431.50/oz per the World Gold Council, crossing $4,000/oz for the first time in October 2025, with the LBMA price averaging a record $4,873/oz in the first quarter of 2026. Whether that trend continues, stalls or reverses depends on factors — Federal Reserve policy, inflation data, central-bank demand, currency movements — that this guide explains but does not predict.
⚠️ Editorial Note & Scope
This is a YMYL (Your Money or Your Life) topic involving investment decisions. This guide separates historical facts (documented price levels and events), official statistics (World Gold Council, Federal Reserve, IMF, RBI, LBMA data, cited with their reporting date), analyst opinions (attributed to the specific analyst or institution making them, never presented as fact), and scenario analysis (multiple possible outcomes, not a single prediction) at every point they diverge. It does not promise, predict or guarantee any future price, return or outcome. Past performance, including every historical bull and bear market described here, does not indicate or guarantee future results. This is educational content, not personalized financial, investment or tax advice — consult a qualified, licensed financial adviser before making investment decisions, and evaluate your own goals, risk tolerance and time horizon rather than relying on any single article. It is maintained as a living reference and revised as the World Gold Council, Federal Reserve, RBI, IMF, World Bank or LBMA publish new data.
Who, What, When, Where, Why and How
What the Record Actually Shows
- Gold has had both long bull markets and extended weak periods: after the January 1980 peak, gold spent roughly two decades below that level in nominal terms — a reminder that past performance does not guarantee future results.
- Gold’s price is set by multiple interacting factors, not one indicator: real interest rates, the US dollar, central-bank demand, inflation expectations and geopolitical risk all move it, often in different directions at once.
- 2025 was gold’s strongest year since 1979 by percentage gain: the annual average price rose 44% to $3,431.50/oz, and gold crossed $4,000/oz for the first time in October 2025, per World Gold Council and widely reported market data.
- Central banks have been consistent net buyers since 2022: purchases exceeded 1,000 tonnes annually in three of the last four years, though 2025’s 863 tonnes was 21% below 2024’s record.
- Official figures are sometimes revised: the World Gold Council’s initially reported Q1 2026 central-bank net purchase figure of 244 tonnes was revised to 57 tonnes in a July 2026 erratum after reclassifying 187 tonnes to OTC demand — a useful reminder to treat any single-quarter figure as provisional.
- Gold and equities do not always move in opposite directions: both have risen together in some periods and diverged sharply in others, so “gold as a hedge against stocks” is a tendency observed at times, not a guaranteed relationship.
- Physical gold and gold ETFs serve different purposes: they track similar prices but differ meaningfully in storage, liquidity, costs and counterparty considerations, detailed later in this guide.
- No institution covered in this guide claims to predict gold’s price with certainty: the World Gold Council, IMF and major banks all publish scenario ranges and probability-weighted outlooks, not single-number guarantees.
- Central-bank demand and jewellery demand often move in opposite directions: 2025’s record-high prices coincided with an 18% drop in jewellery tonnage even as central-bank and bar/coin buying stayed elevated — price sensitivity differs sharply by buyer type.
- This is a living reference: as the World Gold Council, Federal Reserve, RBI, IMF or World Bank publish new data, this guide will be revised, not replaced.
What Gold Actually Is as an Asset
The vocabulary this guide uses precisely, because the distinctions shape real decisions.
Gold as an asset is a physical, chemically stable, globally recognized precious metal with no counterparty — meaning its value does not depend on any government, company or institution honoring a promise, unlike a bond or a bank deposit. It generates no income (no interest, no dividend), so its investment case rests entirely on price appreciation, wealth preservation, and portfolio diversification benefits rather than yield.
Why investors buy gold varies by investor, but the most commonly cited, documented reasons are: diversification (gold’s price often, though not always, moves differently from stocks and bonds); a potential hedge against inflation and currency devaluation over long periods; a store of value during geopolitical or financial-system stress; and, for central banks specifically, reserve diversification away from any single currency.
Investing versus speculation is a distinction worth making precisely. Investing in gold typically means holding a position, often a modest percentage of a diversified portfolio, for years, based on its historical role as a diversifier and store of value. Speculation means trading gold or gold derivatives for short-term price movements, often using leverage through futures or options — a materially different activity with materially different risk, more akin to active trading than portfolio construction. This guide is written for the former use case; it is not a trading strategy guide.
Safe-haven assets are assets investors have historically turned to during periods of financial stress, war, or currency instability, because they are expected to hold value when other assets fall. Gold, certain government bonds (like US Treasuries), and some currencies (like the Swiss franc) are commonly cited examples. “Safe haven” describes a historical tendency, not a guarantee — gold has fallen during some crisis periods too, as the 2008 timeline entry later in this guide documents.
The role of central banks is central to gold’s modern market structure. Central banks hold gold as part of their foreign-exchange reserves, alongside currencies like the US dollar and euro, as a way to diversify reserve holdings and reduce reliance on any single currency. Their collective buying or selling can materially influence gold’s price, and the World Gold Council’s quarterly Gold Demand Trends reports are the most-cited public source tracking this activity.
Why gold prices fluctuate comes down to the same supply-and-demand mechanics as any globally traded asset, but with unusually diverse buyer types — central banks, jewellery consumers, industrial users, ETF investors and futures traders — who often respond to different signals at different times. A later section of this guide walks through each of these demand sources and the macroeconomic variables that move them.
It is worth remembering that gold’s role as a freely priced investment asset is, historically speaking, relatively recent. For most of the roughly six decades before the 1971 Nixon Shock documented in this guide’s timeline, gold’s value was fixed by international monetary agreement rather than set by trading — first under the classical gold standard, then under Bretton Woods. Everything this guide describes as gold’s “price history” — its bull markets, its bear markets, its record highs — is a phenomenon of the market-priced era since 1971, not of gold’s much longer history as money itself.
📈 Market Insight
Gold prices are influenced by multiple interacting factors rather than a single event or indicator. A rate cut, a weaker dollar, strong central-bank buying and rising geopolitical risk can all push in the same direction at once — which is part of why 2025’s rally was unusually broad-based, per World Gold Council reporting, but it is also why no single headline reliably explains or predicts a price move on its own.
Core Concepts, Defined
Fourteen terms this guide uses precisely and consistently throughout.
Bull Market
A sustained period of rising prices, generally understood as a broad, extended uptrend rather than a single rally — gold’s bull markets are dated in this guide’s timeline, though their exact start and end points are a matter of interpretation, not official record.
Bear Market
A sustained period of falling prices, commonly defined as a decline of 20% or more from a recent peak, though definitions vary by source and asset class.
Spot Price
The current market price for immediate delivery of gold, set continuously through global trading and benchmarked twice daily by the LBMA Gold Price auction in London.
Futures
Standardized contracts to buy or sell gold at a set price on a future date, traded primarily on COMEX in New York — used for both hedging and speculation, and a major source of price discovery.
Gold ETF
An exchange-traded fund that holds physical gold (or, less commonly, gold derivatives) and trades on a stock exchange, letting investors gain price exposure without arranging physical storage themselves.
Inflation Hedge
An asset expected to hold or gain value as the purchasing power of a currency falls — gold has functioned this way over long historical periods, though not reliably over every shorter period, as this guide’s history section documents.
Real Interest Rates
A nominal interest rate minus the inflation rate — the “real” return a saver actually earns, and one of the most consistently cited drivers of gold’s opportunity cost to hold.
US Dollar Index (DXY)
An index measuring the US dollar’s value against a basket of major currencies — since gold is priced in dollars globally, a weaker dollar tends to make gold cheaper for non-dollar buyers, and vice versa.
Central-Bank Reserves
Assets, including gold and foreign currencies, held by a central bank to back its currency, settle international obligations and provide a financial buffer — gold’s share of these reserves varies widely by country.
Portfolio Diversification
Holding a mix of assets whose prices do not all move identically, intended to reduce overall portfolio volatility — gold is commonly cited as a diversifier, though its correlation with other assets changes over time and is not fixed.
Safe-Haven Asset
An asset investors have historically turned to during financial stress or uncertainty, expected (not guaranteed) to hold value when riskier assets decline.
COMEX
The Commodity Exchange, part of CME Group, the primary US exchange for gold futures and options contracts, and a major source of global gold price discovery.
LBMA
The London Bullion Market Association, which sets the twice-daily LBMA Gold Price benchmark used as a reference price across the global bullion market.
Store of Value
An asset that maintains its purchasing power over time without deteriorating — one of gold’s most commonly cited properties, owing to its physical durability and limited, slowly growing supply.
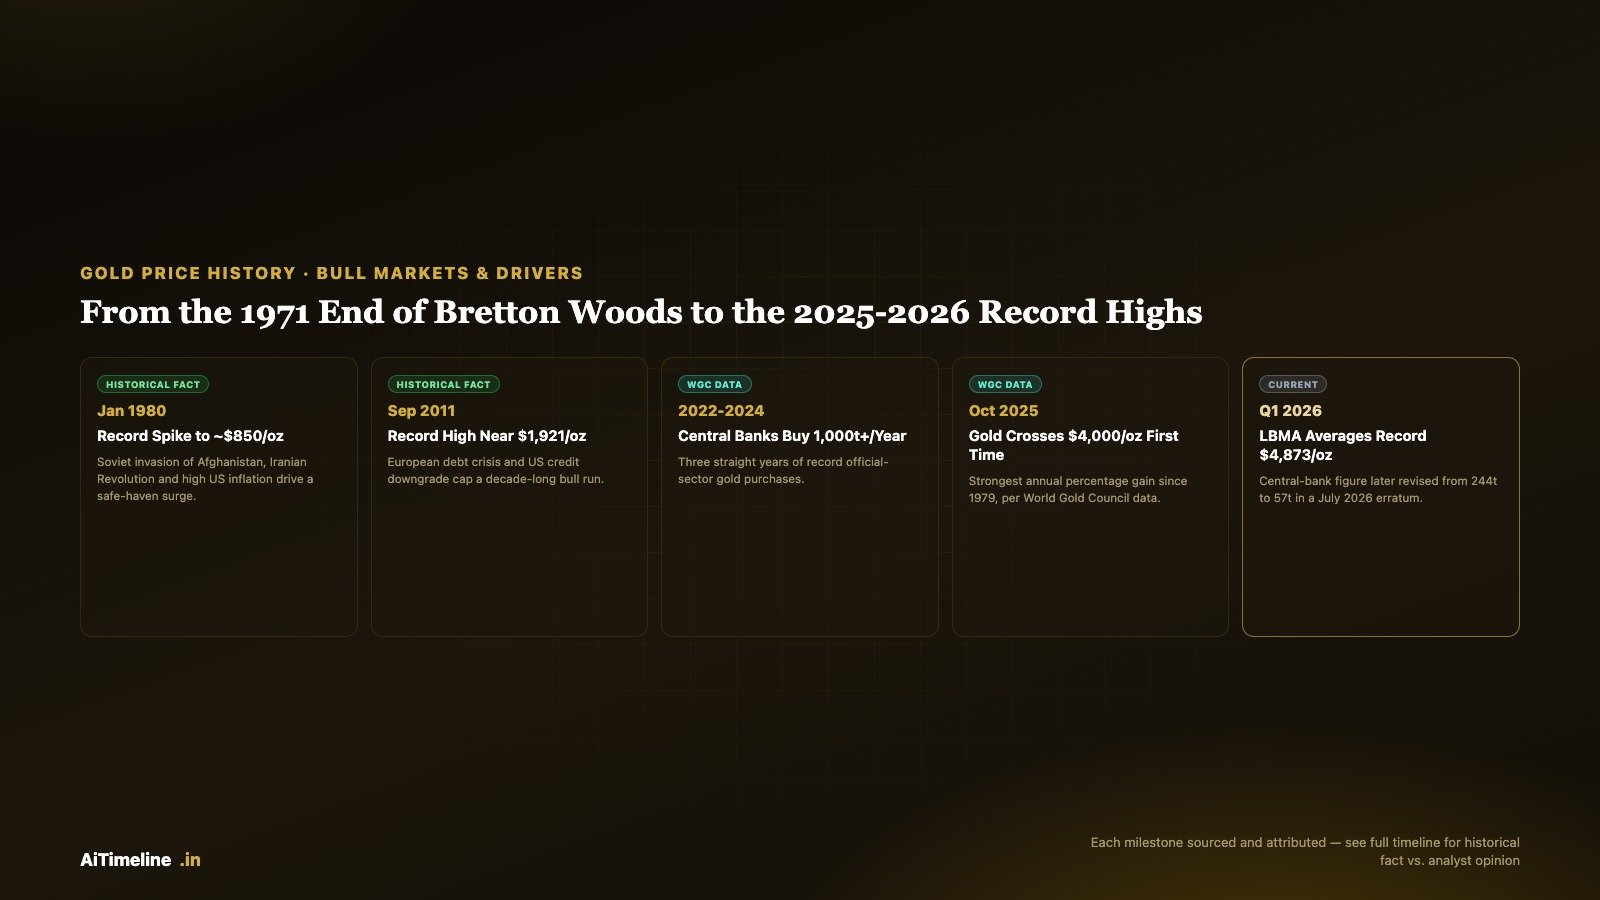
The Complete Timeline: From 1944 to the Present
Reverse-chronological. Each entry separates global economic background, gold-market development, and current relevance — tagged by source type.
2026
LBMA Price Averages a Record $4,873/oz; Central-Bank Figure Is Later Revised
Gold-market development: The LBMA (PM) gold price averaged a record US$4,873/oz for the quarter, per the World Gold Council’s Q1 2026 Gold Demand Trends report. Total Q1 gold demand, including OTC, reached 1,231 tonnes, 2% higher year-on-year.
Central-bank activity: The report initially stated central banks bought 244 tonnes net in Q1, up 3% year-on-year. A July 2026 erratum revised this to 57 tonnes after reclassifying 187 tonnes to OTC demand — a transparent, documented correction this guide treats as a reminder that quarterly figures can be revised.
Current relevance: This is the most recent officially reported data point in this guide’s timeline as of this update.
FULL YR
2025 Becomes Gold’s Strongest Year Since 1979 by Percentage Gain
Global economic background: Gold rose more than 50% during 2025, its largest calendar-year percentage gain since the inflationary shock of 1979, against a backdrop of Federal Reserve rate cuts, persistent central-bank buying and episodic geopolitical stress including the June 2025 Israel-Iran tensions.
Gold-market development: The World Gold Council’s full-year 2025 Gold Demand Trends report recorded an annual average price of $3,431.50/oz (+44% year-on-year from 2024’s $2,386.20), total annual demand of 4,999.4 tonnes excluding OTC (5,002.3 tonnes including OTC — the first time this threshold was exceeded), and combined demand value of $555 billion (+45% y/y).
Sector breakdown (WGC): Jewellery fabrication fell 18% to 1,542.3 tonnes even as its value hit a record $172 billion (+18%); bar and coin investment rose 16% to 1,374.1 tonnes, a 12-year high; ETF holdings rose by 801.2 tonnes, compared with a 2.9-tonne outflow in 2024; central-bank purchases totalled 863 tonnes, down 21% from 2024’s record 1,092.4 tonnes.
Current relevance: This is the most complete, officially reported annual dataset available as of this update and the baseline this guide’s other 2025-2026 figures build on.
Gold Crosses $4,000/oz for the First Time
Gold-market development: Gold exceeded $4,000 per troy ounce for the first time in its trading history in October 2025, a milestone widely reported across financial media and consistent with the World Gold Council’s full-year figures above.
Investor sentiment: The move followed a year of already-strong gains and came alongside continued Federal Reserve easing and sustained central-bank and bar/coin demand, per the sourced data in the entries above and below.
Current relevance: A frequently cited psychological and technical milestone in gold-market commentary, though this guide treats a round-number threshold as notable, not as evidence of future direction.
Israel-Iran Tensions Drive a Safe-Haven Price Surge
Global economic background: Heightened geopolitical tensions between Israel and Iran in June 2025 prompted investors to seek refuge in safe-haven assets, contributing to a gold price surge during the month.
Investor sentiment: This episode is a clear, documented example of geopolitical risk as a short-term gold-price driver, distinct from the slower-moving monetary and central-bank factors that shaped the broader 2025 rally.
Current relevance: Geopolitical spikes like this one are, by nature, difficult to anticipate — this guide documents the episode as a historical example of a driver, not as a pattern investors can time.
-DEC 2025
The Federal Reserve’s Easing Cycle
Central-bank activity: The Federal Reserve cut its target rate six times across this period: September 18, 2024 (-50bp, to 4.75-5.00%), November 7, 2024 (-25bp), December 18, 2024 (-25bp, to 4.25-4.50%), September 17, 2025 (-25bp, to 4.00-4.25%), October 29, 2025 (-25bp, to 3.75-4.00%), and December 10, 2025 (-25bp, to 3.50-3.75%), reversing the aggressive hikes of 2022-2023.
Economic Insight: Falling nominal rates, especially alongside moderating inflation, generally reduce the opportunity cost of holding non-yielding assets like gold — a widely cited, historically observed tendency, though the relationship is not mechanical or guaranteed in every cycle.
Current relevance: This easing cycle forms the monetary-policy backdrop for the 2025-2026 price entries elsewhere in this timeline.
FULL YR
Central-Bank Buying Sets a New Record; Gold Averages $2,386/oz
Gold-market development: Gold’s 2024 annual average price was $2,386.20/oz, per the World Gold Council, itself a strong year that the 2025 rally would go on to significantly exceed.
Central-bank activity: Central banks bought a record 1,092.4 tonnes in 2024, the third consecutive year of purchases above 1,000 tonnes — a sustained pace independent analysts have linked to reserve diversification amid a more fragmented global monetary and geopolitical order.
Current relevance: The three-year run of 1,000-tonne-plus annual central-bank buying (2022-2024) is the structural demand base most frequently cited by analysts discussing gold’s 2025-2026 strength.
War, Inflation and Aggressive Rate Hikes — Yet Gold Holds Up
Global economic background: Russia’s invasion of Ukraine in February 2022 triggered a surge in energy prices and inflation across major economies; the Federal Reserve and other major central banks responded with the fastest rate-hiking cycle in decades through 2022-2023.
Central-bank activity: Despite sharply rising real rates — historically a headwind for gold — central banks became unusually large gold buyers themselves, with purchases reported around 1,136 tonnes in 2022, a level widely described at the time as a modern record.
Economic Insight: This period is frequently cited by analysts as evidence that gold’s price is not governed by real rates alone — geopolitical risk and official-sector demand offset what standard models would have predicted from rate moves alone.
Current relevance: The elevated central-bank buying that began here continued through 2024 and, at a somewhat reduced pace, into 2025.
Gold Reaches a COVID-Era Record Near $2,067/oz
Global economic background: Amid the COVID-19 pandemic, unprecedented monetary and fiscal stimulus, and near-zero interest rates across major economies, gold reached a then-record price near $2,067/oz in August 2020.
Investor sentiment: The rally reflected both safe-haven demand during acute uncertainty and the extremely low real-rate environment created by emergency central-bank policy.
Current relevance: Gold subsequently traded below this level for an extended period before the 2022-onward rally eventually surpassed it — another documented instance of gold not moving in a straight line even after a record high.
A New Uptrend Begins Amid Trade Tensions and a Fed Pause
Global economic background: US-China trade tensions and a shift in Federal Reserve policy from rate hikes toward pauses and eventual cuts supported renewed investor interest in gold after several range-bound years.
Current relevance: Many analysts retrospectively date the start of gold’s current multi-year uptrend to this period, though the exact starting point is a matter of interpretation, not an official designation.
The “Taper Tantrum” Produces Gold’s Worst Year in Decades
Global economic background: When the Federal Reserve signalled it would begin tapering its quantitative-easing bond purchases, government bond yields rose sharply — an episode known as the “taper tantrum.”
Gold-market development: Gold fell roughly 28% during 2013, one of its steepest annual declines in decades, as rising real yields sharply increased the opportunity cost of holding a non-yielding asset.
History Insight: This remains one of the clearest historical illustrations of real interest rates moving against gold, and a useful counterweight to any narrative that gold only ever rises.
Gold Reaches a Record Near $1,921/oz
Global economic background: The European sovereign-debt crisis and the August 2011 downgrade of the US credit rating by S&P drove intense safe-haven demand.
Gold-market development: Gold reached a then-record price near $1,921/oz in September 2011, capping a bull run that had extended, with interruptions, since roughly 2001.
Current relevance: Gold subsequently entered a multi-year decline from this peak, not surpassing it in nominal terms again until 2020 — a nine-year gap illustrating how long a post-peak period can last.
The Global Financial Crisis: An Initial Selloff, Then a Safe-Haven Rally
Global economic background: As the 2008 financial crisis intensified, gold initially fell alongside other assets in late 2008, as investors sold liquid holdings broadly to raise cash — a pattern that complicates any simple “gold always rises in a crisis” narrative.
Gold-market development: Gold subsequently began a sustained rally as central banks slashed interest rates toward zero and launched quantitative easing, a rally that would extend, with pauses, through the September 2011 peak documented above.
History Insight: 2008 is one of this guide’s clearest examples of why “safe haven” describes a historical tendency, not an automatic, moment-by-moment guarantee.
Central Banks Agree to Limit Gold Sales
Central-bank activity: A group of European central banks signed the Washington Agreement on Gold (also called the Central Bank Gold Agreement) in September 1999, agreeing to limit their collective gold sales to less than 400 tonnes a year, after a period of substantial official-sector selling had weighed on prices.
Current relevance: This agreement marked a turning point from central banks as net sellers to, eventually, the sustained net buyers documented in this guide’s 2022-2026 entries — a multi-decade shift in official-sector behaviour.
The Modern Gold Bull Market Begins
Global economic background: Around 2000-2001, gold began a sustained climb from roughly $270/oz, a level near its two-decade low, as the dot-com bubble burst and central-bank selling under the Washington Agreement slowed.
Investor sentiment: This period marked a broad shift in investor sentiment toward gold as a portfolio diversifier, a role that would strengthen further after the 2008 crisis.
Current relevance: Many analysts treat this as the starting point of gold’s modern, multi-decade bull market, running (with the interruptions documented in this timeline) through the record levels reached in 2025-2026.
Gold Spikes to a Record $850/oz
Global economic background: The Soviet Union’s invasion of Afghanistan, the Iranian Revolution and years of high US inflation and oil-price shocks combined to drive intense safe-haven and inflation-hedge demand.
Gold-market development: Gold reached approximately $850/oz in January 1980, a record that, in nominal terms, would not be exceeded until 2008.
History Insight: The nearly three-decade gap before this nominal record was surpassed is one of the most important historical facts for any investor to understand before assuming gold moves in one direction.
The Nixon Shock Ends the Gold Standard
Global economic background: On August 15, 1971, US President Richard Nixon unilaterally ended the direct convertibility of the US dollar into gold, effectively ending the Bretton Woods system that had pegged the dollar to gold since 1944.
Gold-market development: This “Nixon Shock” allowed exchange rates to float freely and transformed gold from a fixed monetary anchor into a market-priced, freely traded commodity for the first time in the modern era.
Current relevance: Every gold-price movement in the rest of this timeline occurs within the market-determined pricing system this event created.
-1933
The Classical Gold Standard Era
Global economic background: From roughly the 1870s, most major economies operated under the classical gold standard, in which paper currency was directly convertible into a fixed quantity of gold on demand — a system intended to anchor monetary stability and facilitate international trade.
Gold-market development: Under this system, gold effectively was money rather than a separately priced investment asset; the concept of a fluctuating “gold price” as this guide otherwise discusses it did not meaningfully exist, since currencies were fixed to gold rather than gold floating against currencies.
Current relevance: The classical gold standard broke down gradually through the 1914-1933 period, strained first by World War One’s financing needs and then by the Great Depression, when the US suspended domestic gold convertibility in 1933 — setting the stage for the Bretton Woods system’s more limited, dollar-centered gold peg in 1944, documented below.
Bretton Woods Fixes Gold at $35 per Ounce
Global economic background: The 1944 Bretton Woods Agreement established a system in which the US dollar was pegged to gold at $35 per troy ounce, and other major currencies were pegged to the dollar — the foundation of the postwar international monetary system.
Current relevance: This fixed-price era is the baseline against which every subsequent price move in this guide’s timeline is measured, and its 1971 collapse is the starting point of gold’s modern, market-priced history.
| Year | Event | Market Importance |
|---|---|---|
| 1944 | Bretton Woods fixes gold at $35/oz | Foundation of the postwar fixed-price system |
| 1971 | Nixon Shock ends gold convertibility | Gold becomes a freely traded, market-priced asset |
| 1980 | Record spike to ~$850/oz | First modern demonstration of gold as inflation/safe-haven hedge |
| 1999 | Washington Agreement on Gold | Turning point from central-bank selling toward later buying |
| 2008 | Global Financial Crisis | Shows gold can fall, then rally, within a single crisis |
| 2011 | Record high near $1,921/oz | Peak of the 2001-2011 bull run; not exceeded for 9 years |
| 2020 | COVID-era record near $2,067/oz | Extreme-stimulus, near-zero-rate environment |
| 2022-2024 | Record central-bank buying (1,000t+/year) | New structural demand base despite high real rates |
| Oct 2025 | Gold crosses $4,000/oz first time | Strongest annual gain since 1979 |
| Q1 2026 | LBMA quarterly record avg $4,873/oz | Most recent confirmed data as of this update |
Infographic Concepts for This Guide
- Gold price history: a line chart from the 1944 Bretton Woods peg through the 2025-2026 record levels, marking each bull and bear phase documented above.
- The gold market cycle: a circular diagram showing how rate cuts, dollar weakness, inflation surprises and geopolitical risk feed into demand, and how demand feeds into price.
- Gold supply and demand: a flow diagram from mine production and recycling (supply) to jewellery, technology, investment and central-bank demand (the four demand categories detailed below).
- Central-bank gold purchases by year: a bar chart of annual net central-bank buying, 2010-2025, highlighting the 2022-2024 run above 1,000 tonnes.
- Portfolio allocation examples: illustrative pie charts showing how a 5%, 10% or 15% gold allocation changes a hypothetical stock/bond portfolio’s composition — for illustration only, not a recommendation.
- Inflation versus gold: a dual-axis chart comparing US CPI inflation with gold’s price over the same decades, showing where the relationship held and where it visibly did not.
📊 Economic Insight
Periods of inflation, lower real interest rates or heightened uncertainty have historically coincided with stronger investor interest in gold, although outcomes vary — 2013’s “taper tantrum” and late-2008’s initial liquidity selloff are two clear, documented exceptions to any simple version of this pattern.
How Gold Prices Are Actually Determined
Supply, demand, and the macroeconomic variables that move both.
Mining production adds new supply slowly and predictably — global mine output changes only a few percentage points year to year, since new mines take years to develop, making supply relatively inelastic compared to the swings in demand documented below. Recycled gold (from jewellery, electronics and other scrap) is the other major supply source, and tends to rise when prices are high, as owners sell existing holdings.
Jewellery demand is historically the largest single demand category by tonnage, concentrated heavily in India and China, but it is also the most price-sensitive: the World Gold Council’s 2025 data showed jewellery tonnage falling 18% even as record prices pushed its total value to a record $172 billion — consumers bought less gold, but the gold they bought cost far more.
Industrial and technology demand — gold’s use in electronics, dentistry and other applications — is a smaller, more stable demand category, less sensitive to investment sentiment than to broader electronics-manufacturing activity.
Central-bank purchases have become one of the most closely watched demand categories since 2022, when annual buying first exceeded 1,000 tonnes. Analysts, including World Gold Council researchers, have linked this to central banks diversifying reserves away from concentration in any single currency, though individual banks’ specific motivations are not always publicly disclosed in detail.
Investment demand — bar and coin purchases, and ETF flows — is the most sentiment-driven category, and the most volatile: 2025’s ETF inflows of 801.2 tonnes reversed a 2.9-tonne outflow in 2024, per World Gold Council data, illustrating how quickly this category can swing.
Interest rates, and specifically real (inflation-adjusted) interest rates, affect gold’s opportunity cost: because gold pays no yield, it becomes relatively more attractive when real rates fall (as in 2020 and 2024-2025) and relatively less attractive when they rise sharply (as in 2013). This is a well-documented historical tendency, not a mechanical formula — 2022’s combination of sharply rising real rates and near-record central-bank buying, discussed in this guide’s timeline, is a clear case where other forces outweighed the standard rate relationship.
Inflation and inflation expectations influence gold both directly (as a potential hedge) and indirectly (through their effect on real rates and central-bank policy) — the two channels are related but distinct, and this guide treats them separately rather than conflating “inflation is high” with “gold will rise,” since the historical record, again, includes exceptions.
Currency movements, particularly in the US dollar, matter because gold is globally priced in dollars: a weaker dollar mechanically makes gold cheaper for buyers using other currencies, which can support demand, and vice versa — the US Dollar Index (DXY) is the most commonly cited reference for this relationship.
Geopolitical risk — war, sanctions, political instability — tends to produce short, sometimes sharp gold-price moves, as the June 2025 Israel-Iran episode in this guide’s timeline illustrates, distinct from the slower-moving monetary and structural demand factors that shape multi-year trends.
Recession expectations can cut both ways: fear of economic weakness can boost gold’s safe-haven appeal, while an actual severe downturn can, as in late 2008, trigger broad liquidity-driven selling across asset classes including gold, at least temporarily.
None of these ten factors operates in isolation, and they frequently point in different directions at once — which is precisely why this guide avoids reducing gold’s price to a single explanatory variable. The 2022-2023 period in this guide’s timeline is the clearest illustration: real interest rates rose sharply (a historical headwind), yet gold held up because central-bank demand and geopolitical risk from Russia’s invasion of Ukraine outweighed that headwind. Any explanation of a gold-price move that cites only one of these ten factors is, by definition, incomplete.
💰 Portfolio Insight
Many investors consider gold one component of a diversified portfolio rather than a standalone strategy. Financial advisers who discuss gold allocations publicly have suggested ranges as varied as low single digits to 15% or more of a portfolio depending on an individual’s goals and risk tolerance — this guide does not recommend a specific percentage, since that depends on circumstances only a qualified adviser assessing your full financial picture can evaluate.
Physical Gold, ETFs, and Gold Against Other Assets
Practical distinctions investors weigh, and how gold has compared with equities, bonds and Bitcoin.
Once an investor decides gold has a role in their portfolio — a decision this guide does not make on anyone’s behalf — a second set of practical questions follows: which form of gold exposure, and how does it sit alongside the other assets already in that portfolio. Those two questions are the subject of this section, and both have real trade-offs rather than a single obviously correct answer.
Physical gold versus gold ETFs is often an investor’s first practical decision. Physical gold (coins, bars, jewellery) requires secure storage and insurance, typically involves a wider buy-sell spread and, in some jurisdictions, different tax treatment, but carries no counterparty risk beyond the physical security of the holding itself. Gold ETFs trade like stocks, offer high liquidity and no storage burden, but introduce fund-structure and counterparty considerations, and in most jurisdictions do not give the holder a claim on specific, identifiable physical gold bars.
Gold versus equities is frequently framed as a hedge relationship, but the historical record is mixed: both asset classes rose together through parts of 2019-2021 and again in 2024-2025, while diverging sharply in other periods, including parts of the 2013 “taper tantrum” year. Equities have historically offered a return stream tied to corporate earnings growth and dividends that gold, generating no income, cannot replicate — a structural difference more important than any short-term correlation statistic.
Gold versus bonds involves a similar structural distinction: bonds pay a contractual interest rate and return of principal (subject to issuer credit risk), while gold offers neither, relying instead on price appreciation and store-of-value characteristics. Government bonds and gold are both commonly cited safe-haven assets, but they respond differently to the same economic signal — rising real rates, for instance, are usually explicitly the mechanism through which newly issued bonds become more attractive precisely as gold’s relative appeal, per the pattern discussed above, tends to fall.
Gold versus Bitcoin is a comparison that has grown more common as some investors and commentators describe Bitcoin as “digital gold.” Both are non-yielding, dollar-priced assets with capped or slow-growing supply, and both have been described as inflation hedges or stores of value by some proponents. They differ enormously in price history and volatility: gold has a multi-century trading history and materially lower historical volatility, while Bitcoin, launched in 2009, has a much shorter track record and has experienced far larger percentage price swings in both directions. Whether Bitcoin functions as a genuine substitute for gold in a portfolio is a matter of active, unresolved debate among analysts, not a settled fact this guide will adjudicate.
Tax considerations for gold investments vary significantly by country, by holding structure (physical, ETF, futures, mining-stock exposure) and by holding period, and can change with new legislation. This guide describes the existence of these differences in general terms only; it is not tax advice, and readers should consult a qualified tax professional in their own jurisdiction before making decisions based on tax treatment.
Risk management around gold, as with any asset, typically involves position sizing relative to a portfolio’s total value, understanding the liquidity and cost structure of the specific vehicle used (physical, ETF or futures), and avoiding leverage unless an investor fully understands and can bear the risk of loss it introduces. Gold’s price can and has fallen substantially and for extended periods, as this guide’s 1980-2000 and 2011-2015 timeline entries document.
Regional markets add another layer worth understanding before generalising about “the gold price.” India and China are historically the two largest jewellery-consuming markets by tonnage, and India’s rupee-denominated gold price moves with both the global dollar price and the rupee-dollar exchange rate, meaning a weaker rupee raises the local price of gold even when the dollar price is flat — a dynamic the RBI monitors closely given its dual role as both a reserve holder and the regulator of India’s gold-import market. The Shanghai Gold Exchange plays an equivalent regional role in China, while London and New York (via the LBMA and COMEX respectively) remain the two dominant venues for global institutional price discovery. None of these markets sets “the” gold price in isolation; they are linked through arbitrage and continuous trading, which is why a headline gold-price figure quoted in London, Mumbai and Shanghai converges to the same underlying value once currency differences are accounted for.
📜 History Insight
Gold has experienced both long bull markets and extended periods of weak performance, reminding investors that past performance does not guarantee future results. The nearly three-decade gap between the January 1980 peak and its eventual nominal recovery is the single clearest illustration of this in gold’s modern history.
Who Publishes Gold Market Data
The institutions behind every figure in this guide, and what each one actually does.
Every statistic in this guide traces back to one of a small number of institutions, each with a distinct role. Knowing which is which matters, because they are not interchangeable: a mining-industry association’s demand data, a central bank’s own reserve disclosure, and an exchange’s traded price are three different kinds of evidence, and conflating them is a common source of confusion in casual gold-market commentary.
The World Gold Council is an industry association funded by major gold-mining companies. It does not set prices or trade gold itself; its role is research and market development, and its quarterly Gold Demand Trends report — the single most-cited public dataset in this guide — aggregates data from mints, refiners, central-bank disclosures and its own market intelligence network. The London Bullion Market Association (LBMA) is the industry body that administers the twice-daily LBMA Gold Price auction, the reference benchmark most global bullion contracts are priced against. COMEX, part of CME Group, is a US futures exchange — its role is to provide a regulated venue for trading gold futures and options, and its settlement prices are a second major global price reference alongside the LBMA benchmark.
On the official-sector side, the Federal Reserve sets US monetary policy and is the single most closely watched influence on real interest rates and the US dollar, both central to this guide’s explanation of gold-price drivers. The European Central Bank plays an equivalent role for the eurozone and, through its member states, was central to the 1999 Washington Agreement on Gold. The Reserve Bank of India both holds gold as part of India’s reserves and regulates India’s large domestic gold-import and jewellery market — a dual role few other central banks combine at similar scale. The International Monetary Fund and World Bank do not set gold prices, but their economic outlooks on global growth, inflation and currency stability are widely used by analysts as macroeconomic context for gold-demand forecasting.
Worth noting for readers weighing how much confidence to place in any given figure: the World Gold Council is industry-funded, which does not make its data unreliable — its Gold Demand Trends methodology is publicly documented and widely relied upon by central banks and independent researchers alike — but it is a relevant fact about the source, in the same way a company’s own investor-relations materials are a different kind of source than an independent audit. This guide cites the World Gold Council because it is, by a wide margin, the most comprehensive public dataset available, while still noting its institutional origin rather than treating it as a disinterested government statistic.
| Institution | Type | Role in the Gold Market |
|---|---|---|
| World Gold Council | Industry association | Publishes quarterly Gold Demand Trends research |
| London Bullion Market Association | Market body | Administers the twice-daily LBMA Gold Price benchmark |
| COMEX (CME Group) | Futures exchange | Primary US venue for gold futures and options trading |
| Federal Reserve | Central bank | Sets US policy rates; most-watched driver of real rates and the dollar |
| European Central Bank | Central bank | Sets eurozone policy; party to the 1999 Washington Agreement on Gold |
| Reserve Bank of India | Central bank | Holds gold reserves; regulates India’s gold-import and jewellery market |
| International Monetary Fund | International institution | Holds gold reserves; publishes global economic outlooks used as market context |
| World Bank | International institution | Publishes global commodity-price data and research |
Comparing Gold to Other Assets
Four comparisons this field’s public discussion most often oversimplifies.
Casual commentary about gold regularly compresses complex, multi-factor relationships into simple rules — “gold always beats stocks in a crisis,” “gold and Bitcoin are interchangeable,” “silver just follows gold.” The comparisons below are drawn directly from the sourced facts established earlier in this guide, set side by side specifically to make those oversimplifications harder to repeat by accident.
A useful habit when reading any gold-versus-X comparison, including the four below, is to separate the structural difference (does the asset pay a yield, does it have a physical form, how deep and old is its market) from the correlation claim (does it move opposite to the other asset). Structural differences are durable facts; correlation claims are statistical observations over a specific historical window and can and do change across different periods, as the gold-versus-equities comparison below illustrates directly.
Gold
- No yield; return comes only from price appreciation
- Lower historical volatility than silver, Bitcoin or equities
- Deep, centuries-old market; central-bank and jewellery demand provide a large, diverse buyer base
- Higher absolute price per ounce; industrial demand is a small share of total demand
Silver
- No yield; return comes only from price appreciation
- Historically more volatile than gold, moving by a larger percentage in both directions
- Smaller, less liquid market than gold; more price-sensitive to shifts in industrial demand
- Industrial and electronics demand (including solar-panel manufacturing) is a much larger share of total demand than for gold
Gold
- Multi-century trading history; well-established valuation and risk characteristics
- Historically lower volatility; large, diversified buyer base (central banks, jewellery, investment)
- Physical delivery, ETF and futures markets all deep and liquid
Bitcoin
- Trading history since 2009; shorter track record across fewer full economic cycles
- Historically much higher volatility; buyer base concentrated among retail and, increasingly, institutional investors
- Entirely digital; no physical-delivery market, though futures and ETF products exist
Physical Gold
- No counterparty risk beyond physical security of the holding
- Requires storage and insurance; typically wider buy-sell spreads
- Direct ownership of a tangible asset
Gold ETFs
- Introduces fund-structure and counterparty considerations
- Highly liquid; trades like a stock with no personal storage burden
- Typically does not confer a claim on specific, identifiable physical bars
Bull Market
- A sustained, extended period of rising prices
- Gold examples: 1970s-1980, 2001-2011, 2018-present (per this guide’s timeline)
- Exact start/end dates are analyst interpretation, not official record
Bear Market
- Commonly defined as a decline of 20% or more from a recent peak
- Gold examples: 1980-2000 (nominal terms), 2011-2015
- Can occur within a longer-term uptrend, not only at its final end
| Year | Annual Average Price (USD/oz) | Source |
|---|---|---|
| 1971 (pre-shock) | $35.00 (fixed peg) | Bretton Woods system |
| Jan 1980 (peak) | ~$850 | Widely reported historical record |
| ~2001 (cyclical low) | ~$270 | Widely reported historical low |
| Sep 2011 (peak) | ~$1,921 | Widely reported historical record |
| Aug 2020 (peak) | ~$2,067 | Widely reported historical record |
| 2024 (annual avg) | $2,386.20 | World Gold Council |
| 2025 (annual avg) | $3,431.50 | World Gold Council |
| Q1 2026 (quarterly avg) | $4,873 | World Gold Council / LBMA |
| Year | Net Central-Bank Purchases (tonnes) | Note |
|---|---|---|
| 2022 | ~1,136 | Widely described as a modern record at the time |
| 2023 | ~1,037 | Second consecutive year above 1,000 tonnes |
| 2024 | 1,092.4 | Record per World Gold Council; third consecutive 1,000t+ year |
| 2025 | 863 | World Gold Council; -21% y/y but still historically high |
| Q1 2026 | 57 (revised) | Initially reported as 244t; revised in July 2026 erratum |
| Demand Category (2025) | Tonnes | Year-on-Year Change |
|---|---|---|
| Jewellery | 1,542.3 | -18% (value hit a record $172bn, +18%) |
| Bar & Coin Investment | 1,374.1 | +16% (12-year high) |
| ETFs & Similar Products | 801.2 | vs. -2.9t outflow in 2024 |
| Central Banks | 863 | -21% |
| Total (excl. OTC) | 4,999.4 | First time approaching/near the 5,000t threshold |
Explore More Timelines
Why Central Banks Hold Gold, and How a Bull Market Forms
Two of the most frequently searched explainer questions on this topic.
Why central banks hold gold comes down to reserve diversification and crisis resilience. Unlike a currency reserve, gold carries no default or counterparty risk tied to another government’s fiscal position, and it is universally recognized and liquid across borders even during periods of severe financial-system stress. The shift documented in this guide’s timeline — from net-selling central banks under the 1999 Washington Agreement to net-buying central banks purchasing over 1,000 tonnes annually from 2022-2024 — is widely interpreted by analysts as reflecting a more fragmented, multipolar global monetary environment, though individual central banks rarely publish detailed reasoning for specific purchases.
What creates a gold bull market, based on the historical episodes in this guide’s timeline, is typically a combination rather than a single cause: falling or low real interest rates, a weakening US dollar, sustained central-bank or investment demand, and often (though not always) a geopolitical or inflationary trigger that draws in additional safe-haven buying. No single one of these factors has, on its own, reliably produced a multi-year bull market in gold’s documented history — it is the combination, and the combination’s persistence, that has mattered.
Equally instructive is what has ended a gold bull market historically: the 2011-2015 decline followed the European debt crisis’s resolution and the 2013 “taper tantrum,” as real rates rose and acute safe-haven demand faded together. There is no official definition of when a bull market “ends” — it is a retrospective label analysts apply once a sustained reversal is clear, not a status any institution declares in real time. Anyone claiming to know in advance exactly when the current uptrend will end is making a claim the historical record does not support making with confidence.
Check the real interest rate environment
Compare current central-bank policy rates against inflation expectations — falling real rates have historically coincided with stronger gold demand, though not in every cycle.
Watch US dollar strength
Track the US Dollar Index (DXY); a weakening dollar has historically made gold cheaper for non-dollar buyers and tended to support demand.
Review World Gold Council demand data
The quarterly Gold Demand Trends report breaks down central-bank, jewellery, bar/coin and ETF demand — the most detailed public dataset on who is actually buying.
Note geopolitical and inflation triggers
Sudden safe-haven spikes, like June 2025’s Israel-Iran episode, are typically short-lived catalysts layered on top of the slower-moving structural drivers above.
Assess persistence, not a single data point
Historical bull markets in this guide’s timeline lasted years and survived multiple pullbacks — a single strong quarter or weak quarter does not, on its own, confirm or end a longer trend.
Cross-check against official sources
Verify claims against World Gold Council, Federal Reserve, IMF or LBMA data directly rather than relying on a single secondary summary, including this one.
👀 Did You Know?
Central banks have remained significant buyers of gold in recent years, contributing to long-term demand alongside jewellery, technology and investment sectors. Even in 2025, a year when jewellery tonnage fell 18% on record prices, central banks and bar/coin investors together still bought well over 2,000 tonnes — a reminder that different buyer types respond to price very differently.
👀 Future Watch
What to watch for next, based only on official channels: the World Gold Council’s next quarterly Gold Demand Trends report; Federal Reserve policy decisions and the pace of any further rate changes; IMF World Economic Outlook updates on global growth and inflation; and any further revisions to previously reported central-bank purchase figures, as occurred with the Q1 2026 data above. Some analysts and institutions have published scenario ranges for gold’s medium-term path — this guide does not adopt or repeat any single-number forecast as fact, since none of the sources it draws on present their own outlooks that way either.
Frequently Asked Questions
100 questions, from foundational definitions through current 2025-2026 market data.
Invest in US Stocks From India: LRS, Taxes and More
Electric Car Sales and Oil Prices: A 190-Year History
The AI Boom: Stocks, Markets and the Global Economy
The U.S. Economy: 250 Years of Growth, Slowdown and Inflation
Explore All AiTimeline Stories
⚠︓ Sources, Methodology & Update Policy
This guide draws on the World Gold Council’s Gold Demand Trends reports (full-year 2025 and Q1 2026, including the July 2026 erratum), historical price data widely reported across financial media and reference sources including Wikipedia’s “Gold as an investment” article, the Federal Reserve’s published policy statements and rate-decision history, and general reference data on the Reserve Bank of India’s foreign-exchange reserves. Every price figure, demand statistic and central-bank data point is attributed to its source and dated, because gold-market data — especially central-bank and OTC figures — is sometimes revised, as this guide explicitly documents with the Q1 2026 example. Where a figure could not be independently verified against a primary source, this guide describes it as approximate or widely reported rather than presenting it as an exact, audited number.
This is educational reference content on an actively evolving market, not personalized financial, investment or tax advice. Nothing in this guide should be read as a recommendation to buy, sell or hold gold or any other asset, or as a prediction of future price movements. If you are evaluating a specific investment decision, verify current data against the official sources named above and consult a qualified, licensed financial adviser who can assess your full financial circumstances — this guide’s last update may predate more recent market developments.
Why Gold Remains One of the World’s Most Watched Assets
Set against the sweep of this guide’s timeline — from a fixed $35 peg in 1944 to a record $4,873 quarterly average in early 2026 — gold’s history is not a straight line, and it was never going to be. It has been a fixed monetary anchor, a freely traded commodity, a two-decade laggard after 1980, a crisis-era safe haven that briefly sold off before rallying in 2008, and, since 2022, the object of the most sustained central-bank buying in decades. Each phase had a different, documented cause. None of them was inevitable, and none of them guarantees what the next phase looks like.
Gold has historically served different roles for different investors — a store of value, a portfolio diversifier, a potential hedge during certain economic conditions — but its future performance depends on a combination of monetary policy, inflation, interest rates, investor sentiment and global events that no single article, analyst or institution can forecast with certainty. The investor in Mumbai and her friend choosing equities, from the opening of this guide, were both responding rationally to the same facts through the lens of their own goals and risk tolerance — exactly the approach this guide has tried to support throughout.
Readers evaluating any specific claim about gold — a headline forecast, a dealer’s sales pitch, a single quarter’s strong number — are best served by returning to primary data: the World Gold Council’s quarterly reports, Federal Reserve policy statements, IMF and World Bank outlooks, and the LBMA’s published price history. Consider multiple scenarios, not one. Weigh your own financial objectives, time horizon and risk tolerance. And treat any source — including this one — that claims to know exactly where gold is going next with the scepticism that claim deserves.
What this guide’s roughly eight decades of documented history shows, more than any single number, is persistence through discontinuity: a fixed peg that lasted until it didn’t, a market-priced era that has now run longer than the peg it replaced, bull markets that lasted a decade and bear markets that lasted nearly three, and a central-bank buying pattern that reversed direction entirely between the 1990s and the 2020s. Gold’s most durable characteristic, on this record, is not a fixed relationship to any one economic variable — it is the fact that a sufficiently wide range of investors, across a sufficiently wide range of economic environments, have continued to find a reason to hold it. Whether that continues to be true of any specific investor, in any specific portfolio, going forward, is a question this guide has tried to equip you to think through, not one it has tried to answer for you.
Sources & further reading
Every dated entry above was checked against these references. Last reviewed 15 September 2026.