Container Shipping Rates: Spikes & Drops Since 2020
Explore the container shipping rate timeline from the COVID-19 surge and 2021 peak to the 2023 crash, Red Sea disruption and 2026 freight costs.
Latest Story
In 2019 it cost about $1,420 to ship a 40-foot container on the world’s main trade lanes. In September 2021 it cost $10,377. Two years later it was back below $1,400, and since then two more shocks, the Red Sea attacks and the 2026 Iran war, have each tripled the price from its low. This timeline of container shipping rates since 2020 uses one benchmark, Drewry’s World Container Index, wherever it can, so the spikes and crashes can be compared directly, and explains what drove each one and what it means for the price of the goods inside the box.
💡 Short Answer
Container shipping rates soared during the pandemic: Drewry’s World Container Index hit a record $10,377 per 40-foot container on 23 September 2021, more than seven times the 2019 average of $1,420. Rates then crashed to $1,342 by October 2023, rose again to $5,937 in July 2024 when ships avoided the Red Sea, fell to $1,651 by October 2025, and climbed to $4,639 in July 2026 after the Iran war pushed up fuel costs. On 8 October 2026 the index was $4,351, with Asia–Europe rates falling and transpacific rates high.
Container Shipping Rates: Key Questions
Six Years of Shipping Rates in Ten Points
- 2019: the pre-pandemic baseline is about $1,420 per 40-foot container (Drewry WCI average).
- 2020: lockdown cancellations, then a goods-buying boom, leave ships and boxes in short supply.
- Mar 2021: the Ever Given blocks Suez for six days, adding to the squeeze.
- Sep 2021: the WCI peaks at $10,377, more than seven times the 2019 level.
- 2022–23: demand cools and ships return; the index falls 87% to $1,342 by October 2023.
- 2024: Red Sea diversions push it back up to $5,937 by July.
- 2025: a short tariff rush in June, then a slide to $1,651 in October as new ships arrive.
- 2026: the Iran war lifts fuel costs and surcharges; the WCI hits $4,639 in July.
- Oct 2026: Asia–Europe rates fall as ships return to Suez, while transpacific rates stay high.
- Always: an index is a benchmark; the price on a real shipment depends on route, contract and surcharges.
The Rate Roller Coaster on One Chart
Selected weekly readings of Drewry’s World Container Index, the composite of eight East–West routes, with the 2019 average as a reference line.
Container Shipping Rates Timeline, 2020–2026
Newest first. Tags mark spikes, falls, shocks and policy moves. Where a figure is not from Drewry’s index, the benchmark is named; different indices are not interchangeable.
2026
$4,351, and two markets moving apart Fall
Drewry’s World Container Index fell 2% to $4,351 per 40-foot container as demand weakened during China’s Golden Week. Shanghai–Rotterdam fell 2% to $3,337 and Shanghai–Genoa held at $3,696, but the transpacific stayed far higher: Shanghai–Los Angeles $7,624 and Shanghai–New York $10,220. Drewry said Asia–Europe rates had now declined for 13 consecutive weeks and that the “faster-than-expected return to the Suez route” was the biggest threat to carriers’ attempts to raise them in late October. It expected rates to hold steady the following week.
2026
Transpacific climbs while Europe slides Spike
The composite index barely moved, between $4,297 (6 August) and $4,500 (17 September), but underneath it the two big trades went opposite ways. Freightos reported Asia–US East Coast rates at a new high of about $9,400 per FEU in mid-August, pointing to higher fuel costs, port congestion and Panama Canal draft restrictions, with surcharges of $200–1,000 per FEU planned from mid-September. Asia–Europe rates fell as Maersk, Hapag-Lloyd, MSC, CMA CGM and others moved services back through the Red Sea and Suez.
2026
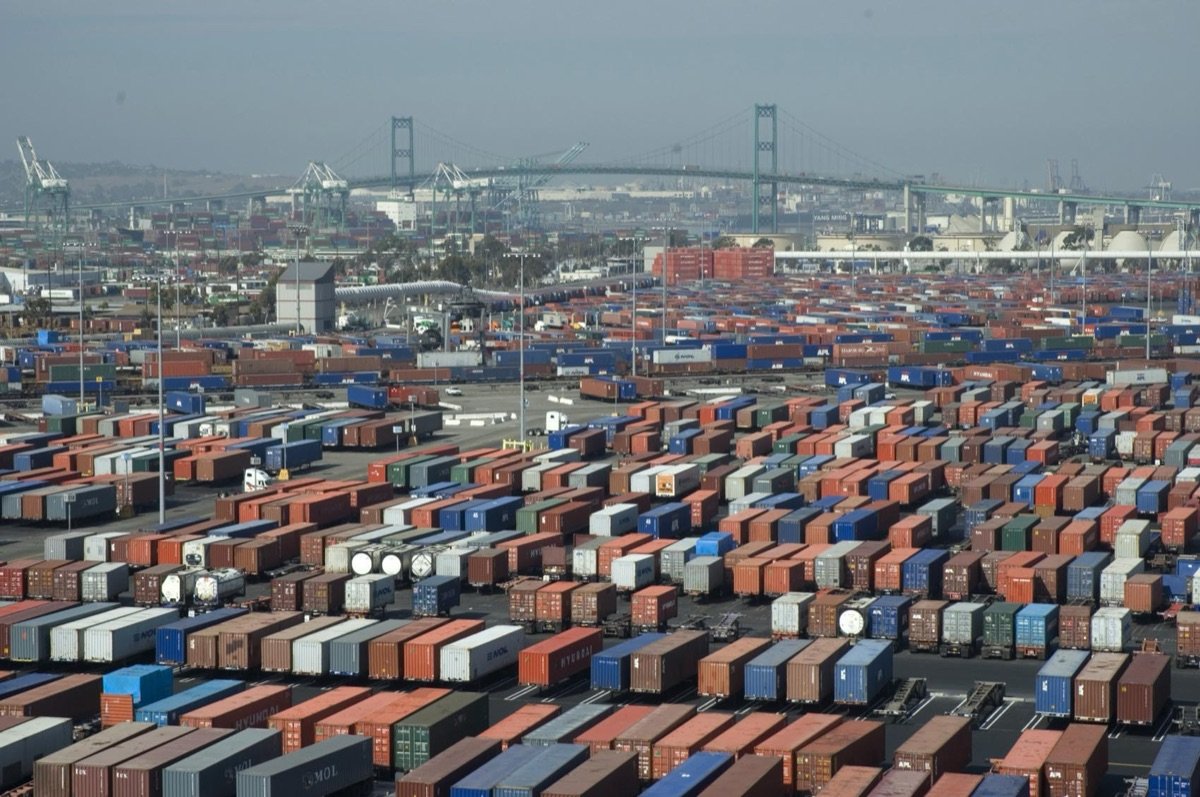
A 2026 high: $4,639 Spike
Drewry’s index rose 2% to $4,639, its highest since September 2024 and well over double the early-March level. Asia–Europe led: Shanghai–Rotterdam $4,933 and Shanghai–Genoa $6,463. Shanghai–Los Angeles was $6,482 and Shanghai–New York $7,904. Carriers scheduled few blank sailings and announced more rate increases for mid-July. A week later Drewry said the peak-season momentum was “beginning to subside”.
The Iran war hits fuel and surcharges Shock
The war that began with US and Israeli strikes on Iran on 28 February disrupted shipping through the Strait of Hormuz, sent oil prices higher and stranded ships in the Gulf. Carriers including CMA CGM and Maersk announced emergency fuel surcharges of several hundred dollars per FEU, plus emergency, peak-season and general rate increases that Freightos said in some cases added thousands of dollars per container. The WCI rose 3% to $1,958 on 5 March and to $2,172 by 19 March. Maersk also abandoned a tentative return to the Red Sea.
A short pre-holiday spike Spike
As every year, exporters rushed cargo out before the Lunar New Year factory shutdowns. The WCI jumped 16% to $2,557 on 8 January, then fell for two weeks to $2,212. In early February 2026 Maersk and Hapag-Lloyd began testing Red Sea transits after months without attacks on merchant ships.
2025
The 2025 floor: $1,651 Fall
Drewry’s index fell for the 17th consecutive week to $1,651, its lowest since January 2024 and only about 16% above the 2019 average. New ships ordered during the pandemic boom kept arriving while demand was soft. In August Freightos had reported Asia–US West Coast rates at $1,940 per FEU, back to pre-Red Sea levels, and Asia–North Europe at $3,273.
2025
The tariff rush Policy
US tariffs announced in April 2025 froze many China–US bookings. When Washington and Beijing agreed on 12 May to cut their tariffs for 90 days, importers rushed to ship before the window closed. The WCI jumped 41% in the week to 5 June to $3,527, and Drewry said it had risen 59% in a month. The rush faded within weeks, and rates fell through the summer.
Below the 2024 floor Fall
The Freightos Baltic Global Index slipped below its lowest point of 2024, even though most big ships were still going round Africa. The longer Cape voyages had absorbed spare ships for a year; by 2025 so many new vessels had been delivered that the detour no longer kept the market tight.
2024
The Red Sea peak: $5,937 Spike
Drewry’s index reached $5,937, 43% below the 2021 record but four times the 2019 average. The Freightos Baltic Global Index had risen 43% in May 2024 to $3,413 per FEU and another 30% in June to $4,446. Retailers shipped their peak-season goods early to beat delays, congestion built up at Asian transhipment hubs such as Singapore, and ships tied up on the Cape route could not be used elsewhere. UNCTAD later named the Red Sea diversions as the main driver of 2024’s rise.
Jan 2024
Ships leave the Red Sea Shock
After a series of Houthi attacks on merchant ships near the Bab el-Mandeb strait, Maersk, Hapag-Lloyd, MSC and CMA CGM paused Red Sea transits in mid-December 2023 and sent ships round the Cape of Good Hope, which the World Bank estimated adds 3,000–3,500 nautical miles and 7–10 days to an Asia–Europe trip. Drewry’s index rose 61% in one week to $2,670 on 4 January 2024 and to $3,072 a week later. Rates rose because each ship was at sea longer, not because the world was buying more.
2023
Below pre-pandemic levels: $1,342 Fall
Drewry’s index fell 2% to $1,342, its lowest in three years and below the 2019 average. In July it had been $1,474, 86% below the peak. UNCTAD reported that the Shanghai Containerized Freight Index, which set its record of 5,109.6 points in January 2022, had fallen below 1,000 by mid-2023, a drop of more than 80%. Shippers could now play carriers off against each other.
2022
Halfway down: $5,662 Fall
A year after the peak, Drewry’s index was down to $5,662, about 45% lower. Consumers were spending on travel and services again, US retailers had overstocked, and port queues were clearing. The fall sped up in the second half of 2022 as bookings dropped and carriers cancelled sailings.
The SCFI’s record Spike
While Drewry’s index had already peaked, the Shanghai Containerized Freight Index set its all-time high of 5,109.6 points in early January 2022. Annual contracts signed around this time locked in record prices for many shippers, which is one reason shipping costs kept feeding into goods prices well after spot rates fell.
2021
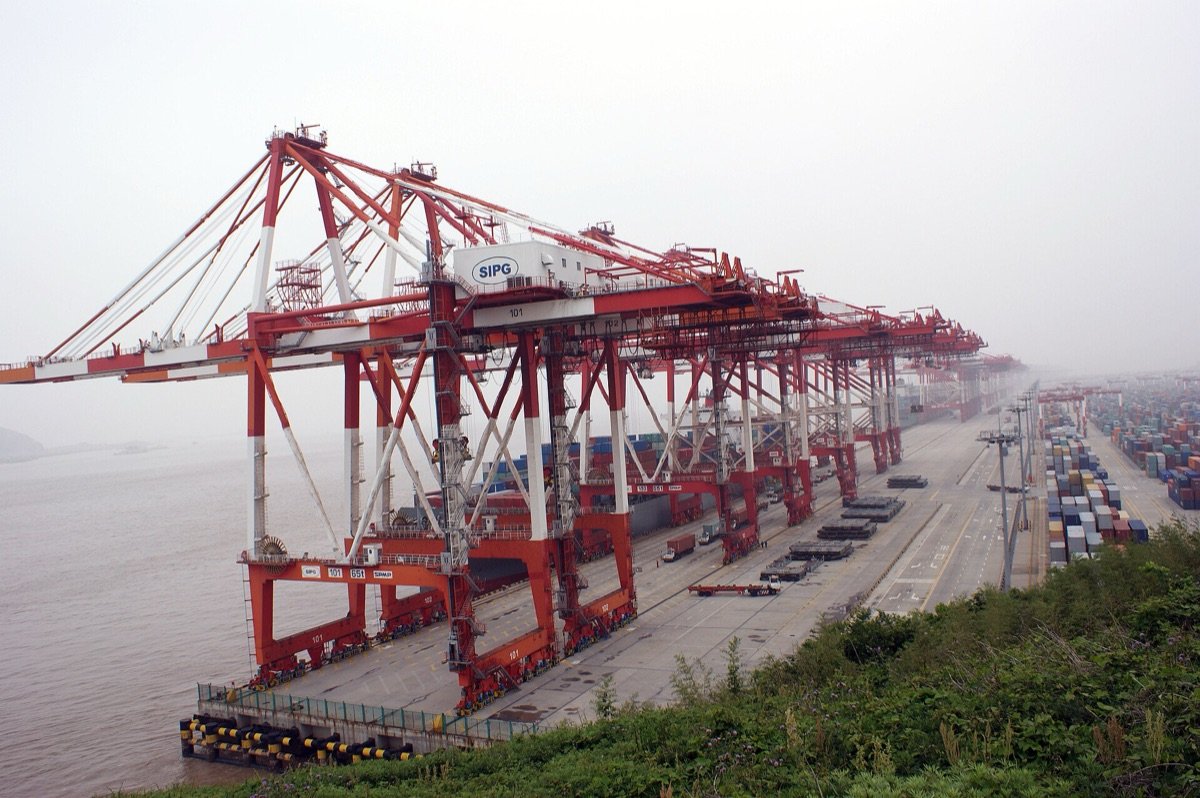
The record: $10,377 per box Spike
Drewry’s World Container Index reached $10,377 per 40-foot container, about 300% above a year earlier and more than seven times the 2019 average. Shanghai–Rotterdam spot rates were above $14,000. Dozens of ships waited at anchor off Los Angeles and Long Beach, schedule reliability collapsed, and some shippers paid premiums on top of the index to get a box on board at all. The index then flattened, ending 22 weeks of increases.
2021
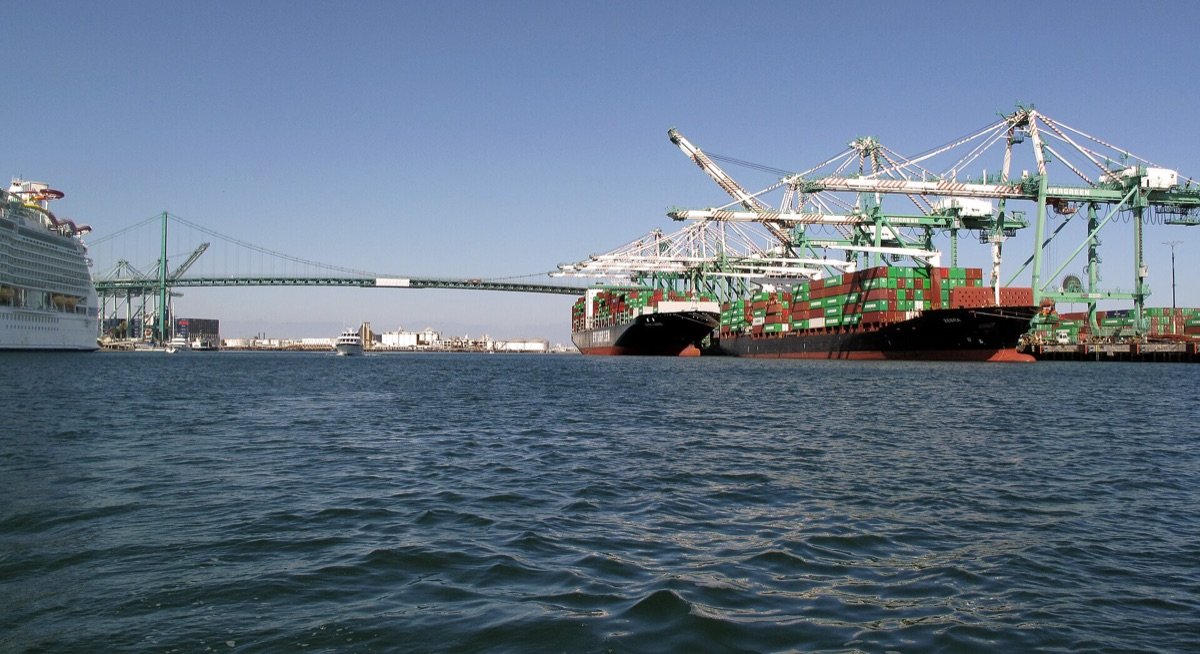
The Ever Given blocks Suez Shock
The 400-metre Ever Given ran aground across the Suez Canal on 23 March 2021 and was refloated on 29 March. Hundreds of ships waited at each end, and when they arrived together European ports were swamped. It came on top of a market already short of ships and containers, and rates kept climbing for six more months.

Lockdown, then a buying boom Shock
When the pandemic struck, carriers cancelled sailings, expecting trade to collapse. Instead, consumers in the US and Europe shut out of restaurants and travel spent on electronics, furniture and home goods. Imports surged faster than ships and ports could adjust; containers piled up in importing countries and were scarce in Asia. UNCTAD described rising import demand, container shortages and port bottlenecks pushing freight rates to historic levels by the end of the year.
Pick a moment. See what one box cost, and why
Every figure is the same benchmark, Drewry’s World Container Index, in US dollars per 40-foot container, so the moments can be compared directly.
October 2026: One Index, Two Markets
The composite index has barely moved since July. The routes inside it have moved a lot, in opposite directions.
| Route (from Shanghai) | 9 Jul 2026 | 8 Oct 2026 | Change | Main driver |
|---|---|---|---|---|
| Rotterdam | $4,933 | $3,337 | −32% | Ships back on the shorter Suez route |
| Genoa | $6,463 | $3,696 | −43% | Suez return; Mediterranean gains most |
| Los Angeles | $6,482 | $7,624 | +18% | Fuel costs, congestion |
| New York | $7,904 | $10,220 | +29% | Fuel, congestion, Panama Canal limits |
| Composite WCI | $4,639 | $4,351 | −6% | Weighted mix of eight routes |
Asia–Europe rates have fallen for 13 weeks because ships are going back through the Suez Canal. A voyage via Suez is one to two weeks shorter than one round Africa, so every ship that returns adds capacity to the trade without a single new vessel being built. Drewry called the “faster-than-expected return to the Suez route” the biggest threat to carriers’ plans to push Asia–Europe rates back up in the second half of October.
The transpacific has gone the other way. Freightos linked higher US-bound rates to fuel costs, which rose again as the Iran conflict dragged on, to congestion, and to Panama Canal draft restrictions that limit how much cargo ships to the US East Coast can carry. That is why Shanghai–New York, at $10,220, is now three times Shanghai–Rotterdam.
Pick a route and a product. See the freight cost per item
Rates are Drewry’s 8 October 2026 spot assessments. Items per box are rough AiTimeline illustrations; real loads depend on packaging and weight.
Why Do Container Shipping Rates Spike and Crash?
Five forces explain most of the moves since 2020.
Goods demand moves faster than ships
Retailers can double orders in months; a new container ship takes two to three years to deliver. When demand jumps, as in 2020–21 or before a tariff deadline, shippers bid for limited space.
It is not just the number of ships
Congestion, slow turnarounds, blank sailings and longer routes all shrink the capacity available for new bookings. The Red Sea detour absorbed ships in 2024 even as the fleet grew.
Equipment in the wrong place
A container stuck at an inland depot in the US cannot carry the next load out of China. In 2021 empty boxes were scarce in Asia while they piled up in importing countries.
Chokepoints and fuel
Suez, the Red Sea, Panama and Hormuz affect sailing distance, fuel use, insurance and schedules. The 2026 Iran war worked mainly through fuel prices and surcharges.
Spot, contract and surcharges
Spot rates react within days; annual contracts follow with a lag. Fuel, war-risk, peak-season and congestion surcharges can be a large share of the bill, and some are not in every index.
New ships alone don’t make shipping cheap
Record deliveries in 2024–25 did not stop the 2026 rise. More capacity pulls rates down only when it is not tied up by detours, congestion or chokepoint closures.
Which Freight Index Is Which?
Headlines quote different benchmarks. Their levels are not interchangeable.
| Benchmark | Publisher | Unit | Published | Pandemic peak |
|---|---|---|---|---|
| World Container Index (WCI) | Drewry | US$ per 40-ft box, 8 routes | Thursdays | $10,377, 23 Sep 2021 |
| Shanghai Containerized Freight Index (SCFI) | Shanghai Shipping Exchange | Index points, exports from Shanghai | Fridays | 5,109.6 points, 7 Jan 2022 |
| Freightos Baltic Index (FBX) | Freightos and the Baltic Exchange | US$ per FEU, global and by lane | Daily lanes, weekly reports | $11,109 global, 10 Sep 2021 |
How Shipping Rates Reach Everyday Prices
Higher freight raises the cost of getting goods from factory to shop. Importers can absorb it, cut margins, pass it on, or switch suppliers, and the effect varies hugely by product. A 40-foot container can hold thousands of phones or tens of thousands of T-shirts, so a few thousand dollars of freight adds little to each. The same box holds only a few dozen sofas, so bulky, low-value goods feel freight spikes most. The cost-per-item calculator above shows the difference.
The effect also arrives late. Much cargo moves on contracts set months earlier, and shops sell stock bought before a spike. IMF research found that a jump in shipping costs feeds through to import prices and then consumer prices over many months, peaking about a year later. That is why the 2021 spike was still showing up in inflation in 2022, after spot rates had started to fall.
What It Means for India
Drewry’s index has no Indian route, but Indian trade moves on the same ships and lanes.
Electronics and machinery
Components, phones, solar modules and machinery from China and East Asia carry freight in their landed cost. Spikes hit thin-margin importers and small manufacturers first.
Europe and the US East Coast
Engineering goods, textiles, chemicals and farm exporters ship to Europe through the Red Sea and to the US East Coast. Small exporters booking spot space had the least bargaining power in 2021 and 2024.
Dollar-priced freight
Ocean freight is billed in dollars. A weaker rupee in 2026 made the same rate dearer in rupee terms for Indian importers and exporters alike.
Shorter route to Europe again
Maersk and Hapag-Lloyd’s India–Europe ME2 service moved back to the Suez route in September 2026, cutting transit times, for as long as the Red Sea stays usable.
What to Watch Next
- Suez and the Red Sea: every service that returns adds capacity to Asia–Europe; a new attack would reverse it.
- Fuel and the Iran war: bunker prices and emergency surcharges drove the 2026 rise.
- New ship deliveries: more capacity pulls rates down when it isn’t tied up by detours.
- US trade policy: tariff deadlines make importers ship early and create short spikes, as in June 2025.
- Panama Canal and congestion: draft limits and port delays tighten transpacific capacity.
- Lunar New Year 2027: exporters usually rush cargo before the factory holiday.
- Contract season: annual contracts negotiated for 2027 will set what most big shippers actually pay.
Corrections and Clarifications
Claims in the brief this page was built from, checked against Drewry’s weekly releases, UNCTAD, the Baltic Exchange and Freightos.
“2026: shipping costs remain volatile”
The brief left out the main 2026 driver. After the US and Israel struck Iran on 28 February, fuel costs and surcharges rose and the WCI more than doubled, from $1,958 on 5 March to $4,639 on 9 July, its highest since September 2024.
“2023: closer to pre-pandemic conditions”
Drewry’s index actually went below the 2019 average: $1,342 on 26 October 2023, its lowest in three years. The July 2023 figure of $1,474 in the brief is correct.
“2025: rates ease”
2025 also had a sharp spike: the WCI jumped 41% in the week to 5 June, to $3,527, after the 12 May US–China tariff truce. Rates then fell to $1,651 on 9 October 2025, the lowest since January 2024.
SCFI “peak of 5,067 points”
The Shanghai Containerized Freight Index’s record was 5,109.6 points, set in early January 2022. By mid-2023 it was below 1,000, a fall of more than 80%, as the brief says.
The Ever Given came first
The brief listed the Suez blockage after the September 2021 peak. It happened on 23–29 March 2021, six months before the record, and was one of the pressures that led up to it.
“Increasing Suez transits adding capacity”
Drewry’s 8 October note went further: Asia–Europe rates had fallen for 13 straight weeks, and the faster-than-expected Suez return was the biggest threat to carriers’ rate increases. Transpacific rates, by contrast, were far above their July levels.
Explore More Timelines
People Also Ask
Frequently Asked Questions
The Bottom Line
Since 2020 the price of moving a 40-foot container has gone from about $1,400 to more than $10,000, back below $1,400, and up again twice. Each spike had a different cause, a goods boom, a war at sea and a war on land that drove up fuel, and each crash came when ships were freed up again. In October 2026 the composite rate is about three times its 2019 level, falling on the routes to Europe and still climbing on the routes to America. More ships do not automatically mean cheaper shipping, and no crisis keeps rates high forever.
Related AiTimeline Stories
⚠️ Editorial Note
Last updated 11 October 2026. Index readings are Drewry World Container Index weekly composite and route assessments in US dollars per 40-foot container, taken from Drewry’s releases as published by Drewry and the trade press; the chart shows selected readings, not the full weekly series. FBX figures are from Freightos and the Baltic Exchange, SCFI figures from the Shanghai Shipping Exchange as reported. Rates are historical spot benchmarks, not quotes. Items-per-container figures in the calculator are rough AiTimeline illustrations. AiTimeline has no commercial relationship with any carrier, freight forwarder or index provider.
Sources & further reading
Every dated entry above was checked against these references. Last reviewed 11 October 2026.
- Drewry: World Container Index, assessment of 8 October 2026
- UNCTAD: Shipping during COVID-19: why container freight rates have surged
- Container freight rates stabilise after 22 weeks of increases (September 2021)
- Drewry's World Container Index, 1 September 2022
- UNCTAD: Review of Maritime Transport 2023
- World Bank: Will prolonged rerouting of ships away from Suez trigger a new supply chain crisis?
- FBX Index June 2024: Market summary
- UNCTAD: Review of Maritime Transport 2025, Chapter 3
- Freightos: Transpac container rates slide back to pre-Red Sea levels (20 August 2025)
- Freightos: Ocean braces for wave of Iran-war surcharges (17 March 2026)
- Freightos: Congestion playing a bigger role in container rates (18 August 2026)
- IMF: How soaring shipping costs raise prices around the world (March 2022)