US Healthcare Costs: Why Americans Are Delaying or Skipping Care
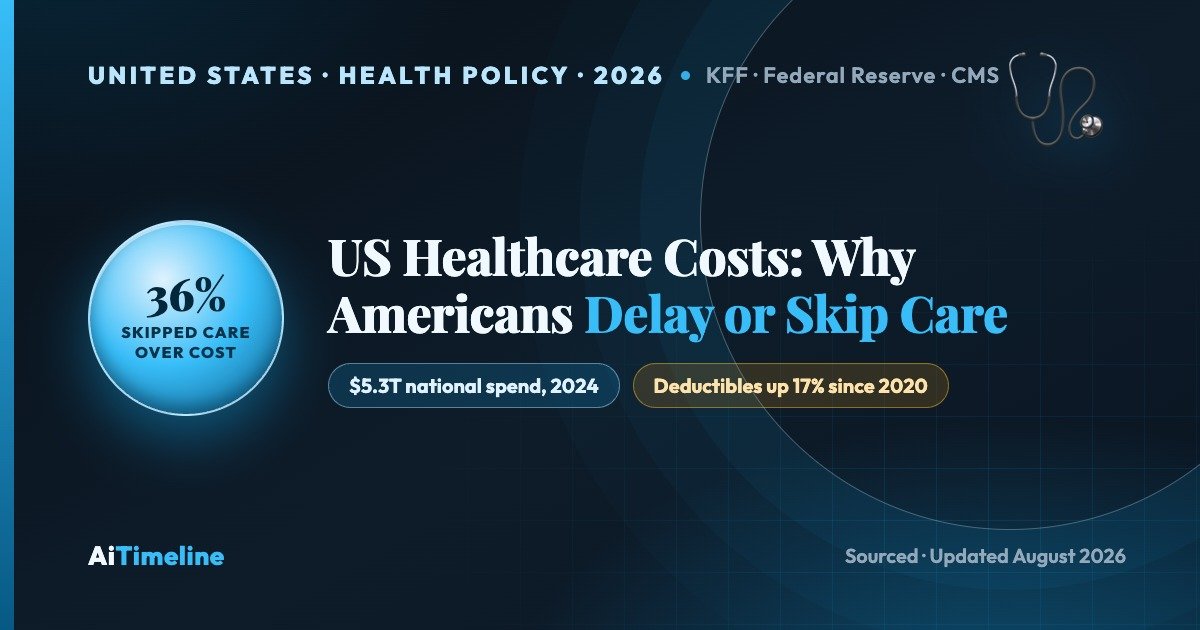
Insurance doesn't guarantee affordability. See why 36% of US adults skipped or delayed care over cost in 2025, per new KFF and Federal Reserve data.
Latest Story
A person can carry health insurance, hold a steady job and still decide not to make the appointment. Not because they doubt something is wrong, but because they have done the arithmetic: a deductible that has not been met yet, a copay that competes with the electric bill, a prescription that costs more than a tank of gas. Insurance in the United States is not the same thing as affordability, and for a large share of adults, the real question before a doctor’s visit is not “what if this is serious,” it is “can I afford to find out?” That distinction — cost as a trigger for a behavioral decision, not just a line item on a bill — is the throughline of this article. National surveys from KFF and the Federal Reserve, verified below with exact wording and dates, put a number on how often that decision goes toward waiting. This is not a story about people refusing care. It is a story about a health system where price, deductible design and medical debt can change what a person does next, sometimes with real medical consequences and sometimes not, and where cost is one reason among several — alongside appointment availability, transportation, work schedules and trust — that care gets delayed.
🧠 US Healthcare Costs in 60 Seconds
The US spent $5.3 trillion on healthcare in 2024 — $15,474 per person, 18.0% of GDP (CMS). Two separate, non-contradictory 2026 surveys show cost is changing behavior: KFF found 36% of adults skipped or postponed needed care in the prior 12 months because of cost (April 2026 poll), while the Federal Reserve’s household survey found 26% skipped some medical treatment in 2025 specifically because they could not afford it — a narrower measure that fell from 28% in 2024. Insurance reduces this risk but does not remove it: 24% of insured adults still skipped treatment in 2025, versus 45% of uninsured adults. Deductibles, copays, coinsurance and medical debt are the mechanics behind that gap.
Why it matters: three separate 2026 developments — expired ACA subsidies, a stable-but-fragile uninsured rate, and a court ruling that reopens how billing disputes get priced — are converging on the same underlying question: what does a patient actually pay, and does that price change whether they seek care at all.
US Healthcare Costs: Key Questions
What the Evidence Actually Shows
- Cost-driven care avoidance is real and measured two ways: KFF’s 36% (skipped/postponed any needed care, 12 months) and the Fed’s 26% (skipped some medical treatment, 2025) are complementary, not contradictory.
- Insurance reduces the risk but does not remove it: 24% of insured adults still skipped treatment in 2025 versus 45% of uninsured adults.
- Deductibles turn timing into a financial decision: the average single-coverage employer deductible reached $1,886 in 2025, up 43% over ten years.
- Dental care is skipped most often: 18% of adults went without dental care in 2025 due to cost, ahead of doctor visits (15%) and prescriptions (9%).
- Prescription cost-coping is widespread: 43% of adults took at least one cost-saving step on medication in the past year — not filling a script, cutting pills, or substituting an OTC drug.
- Medical debt is large but imprecisely measured: at least $220 billion held by roughly 20 million adults, based on the most recent nationally representative federal survey data (December 2021, published February 2024).
- 2026 policy is adding pressure, not relieving it: enhanced ACA premium tax credits expired, and a federal court vacated the CFPB’s rule banning medical debt from credit reports.
- Surprise-billing protections for patients are unchanged by the August 2026 court ruling — what changed is the insurer-provider payment formula behind the scenes, not what a patient can be billed directly.
- The US spends the most per person among wealthy nations and still ranks last overall on access and affordability measures, per the Commonwealth Fund.
How Much Does America Spend on Healthcare?
OFFICIAL DATA — CMS National Health Expenditure Accounts, 2024 data
The Centers for Medicare & Medicaid Services (CMS) tracks national health spending through its National Health Expenditure Accounts (NHE) — the government’s authoritative count of every dollar spent on healthcare in the US, from hospital bills to insurance premiums to out-of-pocket copays. The most recent complete data, for 2024, put total national health expenditure at $5.3 trillion, or $15,474 per person, equal to 18.0% of US GDP — up from 17.6% in 2023. NHE data lags by roughly a year because it takes time to compile complete claims and spending records across the entire system; 2024 is the newest full-year figure as of this writing.
That single national number is not the same thing as what any individual household pays. National health expenditure includes hospital and physician spending, prescription drugs, nursing care, government public health activity, and the administrative cost of running insurance — most of it paid by employers, insurers and government programs, not directly out of a patient’s pocket. Household out-of-pocket spending — copays, coinsurance, deductibles and uninsured medical bills paid directly by patients — is a separate, smaller slice of that total, and it is the slice most directly tied to whether someone decides to seek care. Confusing a hospital’s list price, a national spending total, and a single patient’s final bill is one of the most common errors in healthcare reporting; this article keeps them separate throughout.
US vs. Peer Nations — Spending and Affordability
Source: Commonwealth Fund, Mirror, Mirror 2024 and U.S. Health Care from a Global Perspective, 2026 — comparing the US against Australia, Canada, France, Germany, the Netherlands, New Zealand, Sweden, Switzerland and the UK.
This is not a claim that other countries offer “free” healthcare — every system finances care through some mix of taxation, mandatory premiums or payroll contributions. The difference the Commonwealth Fund documents is that in the Netherlands, UK and Germany, a much smaller share of that financing lands on the patient at the point of care as an out-of-pocket bill.
Why Does US Healthcare Cost So Much?
AITIMELINE ANALYSIS — separating price, utilization and mix
Health economists generally split “why healthcare costs so much” into three distinct questions, and conflating them is a common source of bad analysis: price (how much does each service cost), utilization (how much care do people actually use), and mix (what kind of care — routine versus specialist, generic versus brand drug, outpatient versus inpatient). Research comparing the US with peer nations, including work cited by the Commonwealth Fund and OECD, consistently finds that Americans do not use dramatically more healthcare than people in other wealthy countries — in some categories, like average length of hospital stay, the US is lower. What differs is price: US hospitals, physicians and drug manufacturers charge more per service than their counterparts elsewhere, and no single factor explains all of it.
Hospital & facility prices
Hospital care is the single largest spending category in NHE data. Consolidation among hospital systems has reduced the number of competing providers in many markets, which research broadly associates with higher negotiated prices, and facility fees can apply even to routine outpatient visits performed in a hospital-owned clinic.
Physician & specialist services
US physician compensation and specialist care are priced higher on average than in peer countries. This is not simply “doctors are overpaid” — training costs, malpractice exposure and market structure all factor into how physician services are priced and billed.
Prescription drugs
Brand-name drug list prices in the US are typically several times higher than in comparable countries, in part because, unlike most peer governments, the US historically negotiated drug prices only for a limited set of Medicare drugs — a policy that itself changed with 2022’s Inflation Reduction Act.
Administrative & insurance overhead
Running a multi-payer system with thousands of distinct insurance plans, each with its own billing rules, prior-authorization requirements and claims process, adds administrative cost that single-payer or more standardized systems avoid — a widely cited factor in why US administrative spending outpaces peer nations.
No single driver — not hospital prices, not drug prices, not administration — explains the full gap on its own. They compound. This is why policy fixes aimed at only one lever (drug pricing alone, or price transparency alone) tend to produce partial, not complete, results.
Insurance Does Not Mean Free
Definitions every patient needs before reading a bill
Having health insurance caps financial risk — it protects against the worst-case, catastrophic bill. It does not make routine care free, and the gap between those two things is where cost-driven delay actually happens. Six terms do most of the work:
Premium
The amount paid — monthly, usually — just to keep insurance active, regardless of whether any care is used. Paid by the employer, the individual, or a mix of both.
Deductible
The amount a patient must pay out of pocket before the insurance plan starts paying its share for most services. A $2,000 deductible means the first $2,000 of covered care in a plan year is usually paid by the patient.
Copay & coinsurance
A copay is a fixed dollar amount per visit or prescription (e.g., $30 per office visit). Coinsurance is a percentage of the cost the patient still owes after the deductible is met (e.g., 20% of the bill).
Out-of-pocket maximum
The most a patient will pay in a plan year for covered care, combining deductible, copays and coinsurance. Once hit, the plan covers 100% of further covered costs for that year.
Network / out-of-network
Insurers negotiate discounted rates with a set of “in-network” providers. Care from an “out-of-network” provider is often billed at a much higher rate, or not covered at all, outside emergency-care protections.
Underinsurance
Having insurance whose deductible, premium or coverage gaps are still large relative to income — technically covered, but still financially exposed to a significant bill.
⚠️ Illustrative example — not an average US deductible
Consider a hypothetical worker with employer coverage and a $3,000 deductible. A visit that reveals the need for an MRI and a specialist referral can mean paying most of that cost directly, out of pocket, before insurance contributes meaningfully — even though the person has “good” insurance on paper. This is an illustration of how deductible design works, not a reported real patient case or a national average figure.
Why Some Americans Delay or Skip Care
Cost is one reason among several — not the only one
It would be inaccurate to say Americans are “refusing” doctors, and it would be inaccurate to say every skipped appointment is about money. Survey and health-services research point to a mix of overlapping reasons, several of which compound each other:
Reasons care gets delayed or skipped
- Cost of the visit itself — the copay, coinsurance or full self-pay price of an appointment.
- Deductibles — a plan year’s unmet deductible turning a routine visit into a large upfront bill.
- Prescription prices — a filled prescription competing directly with other monthly expenses.
- Lack of insurance — no coverage at all, and no negotiated rate to fall back on.
- Underinsurance — coverage that is technically active but leaves large gaps relative to income.
- Medical debt — existing unpaid bills making a person reluctant to add a new one.
- Appointment availability — long wait times for primary care and some specialists in many regions.
- Transportation — distance to a provider, especially in rural areas with fewer facilities.
- Work obligations — inability to take paid or unpaid time off during clinic hours.
- Childcare — no coverage for dependents during an appointment.
- Fear or anxiety — apprehension about a diagnosis, independent of cost.
- Lack of a regular doctor — no established primary-care relationship to prompt or coordinate care.
Cost is consistently one of the largest single reasons cited in national surveys, but it is not the only one, and the two are not mutually exclusive — someone without paid sick leave and a high deductible faces both a scheduling barrier and a financial one at once.
The 36% Figure: KFF’s Skipped-or-Postponed-Care Measure
SURVEY — KFF Health Tracking Poll
About one-third (36%) of adults say that in the past 12 months they have skipped or postponed getting health care they needed because of the cost — this exact figure and wording comes from KFF’s health-tracking polling, most recently reaffirmed in KFF’s April 2026 poll, “Health Care Costs, Expiring ACA Tax Credits, and the 2026 Midterms.” The question asks broadly about “needed” care in the prior 12 months — it is not limited to doctor visits, and it does not mean 36% of adults never see a doctor. The same polling found that 75% of uninsured adults under 65 went without needed care because of cost, that 18% of adults say their health got worse as a result of skipping or delaying care, and that 64% of the public is at least somewhat worried about affording healthcare costs, including insurance and out-of-pocket costs like office visits and prescriptions. The same poll found roughly 90% of respondents say healthcare costs will influence how they vote in the November 2026 midterms.
KFF is a nonpartisan health policy research and polling organization; its health-tracking poll is fielded periodically among a nationally representative sample of US adults. 36% should not be rewritten as “36% of Americans don’t see doctors” — that would misstate a broad, any-type-of-needed-care measure as a claim about routine doctor visits specifically, which the data does not support.
The 26% Figure: The Federal Reserve’s Skipped-Treatment Measure
SURVEY — Federal Reserve Survey of Household Economics and Decisionmaking (SHED)
In 2025, 26% of American adults skipped some form of medical treatment because they could not afford it, according to the Federal Reserve’s Survey of Household Economics and Decisionmaking (SHED), published in the Fed’s Economic Well-Being of U.S. Households report and reported by USAFacts on May 18, 2026. This is down from 28% in 2024 and is the lowest share since 2022. The SHED measure asks specifically about “some medical treatment” skipped due to affordability in the survey year — a narrower, more specifically cost-tied question than KFF’s broader “needed care” measure.
The two numbers — KFF’s 36% and the Fed’s 26% — are not contradictory. They measure related but distinct things: KFF asks about any needed care skipped or postponed over 12 months for any reason tied to cost; the Fed asks specifically about medical treatment not obtained because a household could not afford it, in a single survey year. Different question wording, different reference periods and different survey populations reliably produce different percentages even when both are measuring real, overlapping phenomena. Neither number is wrong; they simply are not the same measurement.
The Fed data also shows a sharp income gradient: 38% of adults in households earning under $25,000 skipped medical treatment in 2025, compared with 13% of those earning over $100,000 — a nearly threefold gap that is one of the clearest single predictors in the dataset.
Insured vs. Uninsured — Insurance Reduces Risk, Doesn’t Erase It
OFFICIAL DATA — Federal Reserve SHED, 2025
Insurance roughly halves the odds of skipping treatment for cost reasons in this dataset — a meaningful protective effect. But 24% of insured adults still went without care they needed because of cost, which is the core evidence behind this article’s central argument: coverage is not the same thing as affordability.
Who Is Most Affected?
Verified breakdowns only — income and coverage status
| Group | Skipped medical treatment (2025) | Source |
|---|---|---|
| Household income under $25,000 | 38% | Federal Reserve SHED |
| Household income over $100,000 | 13% | Federal Reserve SHED |
| Uninsured adults | 45% | Federal Reserve SHED |
| Insured adults | 24% | Federal Reserve SHED |
| Uninsured adults under 65 (any needed care) | 75% | KFF, April 2026 |
Income is the single strongest, most consistently documented predictor of cost-driven care avoidance in these datasets. Differences by age, chronic-disease status and other demographic factors are documented in various KFF and CDC surveys but require careful, source-specific interpretation rather than a single blended figure — this article reports only the breakdowns directly verified above.
The Deductible Problem
OFFICIAL DATA — KFF 2025 Employer Health Benefits Survey
A deductible is why a technically-insured patient can still face a real financial barrier before coverage pays substantially. In 2025, the average general annual deductible for single coverage in employer plans was $1,886 — up 17% over five years and 43% over ten. Roughly 34% of covered workers are in a plan with a single-coverage deductible of $2,000 or more, and 88% of workers with single coverage have some deductible that must be met before most services are paid by the plan.
Not every deductible is unaffordable, and high-deductible plans paired with a Health Savings Account (HSA) can be a reasonable trade-off for a healthy person with cash reserves — lower premiums in exchange for more first-dollar exposure. The affordability problem is concentrated among households without savings to cover that gap, and it is why the timing of care — deciding whether to go now, early in a plan year with an unmet deductible, or wait — can become an explicitly financial decision rather than a purely medical one. ACA marketplace plans and employer plans both use deductible structures, though exact averages differ by plan type and metal tier.
When the Prescription Is Too Expensive
SURVEY — KFF, 2025-2026 tracking data
Prescription drug affordability shows up in patient behavior more directly than almost any other cost category, because a prescription is a recurring, visible price rather than a one-time bill. KFF’s tracking data found 27% of adults did not fill a prescription, 19% cut pills in half or skipped doses, and 31% took an over-the-counter drug instead of filling a prescription, all due to cost in the past 12 months. In total, 43% of adults took at least one cost-related medication shortcut — up from about a third in the prior year’s tracking. Lower- and middle-income households report these behaviors at meaningfully higher rates than higher-income households.
Brand-name drugs, complex formulary rules, pharmacy-network restrictions and drug-specific coinsurance (rather than a flat copay) all compound the price a patient sees at the counter. This article does not offer guidance on any individual medication decision — patients concerned about medication cost should talk to a prescriber or pharmacist about generic alternatives, manufacturer assistance programs or formulary options, not stop or ration a prescription without medical guidance.
When a Medical Bill Becomes Debt
OFFICIAL DATA — KFF-Peterson Health System Tracker; CFPB
The most recent nationally representative federal estimate — Survey of Income and Program Participation data from December 2021, analyzed by KFF-Peterson Health System Tracker and published February 2024 — found that people in the US owe at least $220 billion in medical debt, held by roughly 20 million people (nearly 1 in 12 adults). About 14 million people (6% of adults) owe more than $1,000, and about 3 million (1%) owe more than $10,000. Separately, KFF’s Health Care Debt Survey found roughly four in ten adults report some form of healthcare-related debt under a broader definition that includes credit cards used for medical bills and informal borrowing from family.
The Consumer Financial Protection Bureau (CFPB) separately estimated $88 billion in medical bills sitting on consumer credit reports, based on June 2021 data published in March 2022, affecting about 15 million Americans. POLICY UPDATE: the three major credit bureaus voluntarily agreed in 2022 to remove paid medical collections regardless of balance, unpaid medical collections under $500, and to apply a 12-month grace period before any medical debt appears on a report — those voluntary changes remain in effect. A subsequent CFPB rule that would have banned medical debt from credit reports entirely was finalized but then vacated by a federal court in the Eastern District of Texas on July 11, 2025, at the CFPB’s own request after new agency leadership paused its implementation earlier that year. As of 2026, there is no federal ban on medical debt appearing on credit reports; roughly 15 states have their own restrictions, and the CFPB issued an interpretive rule in October 2025 asserting that federal law preempts those state protections — a legal question still being contested.
The Hidden Cost of Waiting
Delayed care — evidence, with real limits on the claim
Delaying care can, in some cases, allow a condition to progress to a point where treatment is more complex, more expensive, and requires a longer recovery — a routine issue caught early may need a simple intervention, while the same issue caught late may require hospitalization. But this is not a universal law. Many conditions do not worsen meaningfully over weeks or months of delay, and some care can safely be postponed without consequence. The honest claim, and the one supported by the evidence in this article, is narrower than “delaying care always costs more.”
Potential pathway — not an outcome for every patient
This is one possible pathway documented in health-services literature for some conditions, particularly chronic and progressive ones. It is not an outcome that applies to every patient, every condition, or every delay — presenting it as universal would overstate the evidence.
Emergency Care vs. Primary Care
Some patients who delay routine or primary care eventually use an emergency department once a condition becomes acute — emergency rooms are legally required to treat emergency conditions regardless of ability to pay (under EMTALA), which makes them a backstop, not a substitute, for primary care. It would be inaccurate to characterize all emergency-department use as inappropriate: emergency care is essential, and many ER visits reflect genuine emergencies unrelated to any prior delay. Where it does connect to affordability is cost and continuity: ER care is typically billed at a higher rate than an equivalent primary-care visit, and network status and insurance rules can add further billing complexity, especially if the ER or its treating physicians are out-of-network.
Surprise Medical Bills
Protection that exists — and the payment-formula fight behind it
A “surprise bill” is a bill a patient did not expect and could not reasonably have avoided — most commonly, care from an out-of-network provider at an in-network facility (an anesthesiologist or radiologist a patient never chose, for instance), or emergency care at an out-of-network hospital. The federal No Surprises Act, effective since January 2022, bans balance billing patients directly in these situations: patients pay only their normal in-network cost-sharing, and the insurer and provider settle the remaining payment amount between themselves, either by negotiation or through an independent dispute resolution (arbitration) process.
The No Surprises Act — August 2026 Court Ruling
COURT RULING — 5th US Circuit Court of Appeals, August 12, 2026
On August 12, 2026, the full, en banc 5th US Circuit Court of Appeals (based in New Orleans) ruled that part of the formula regulators use to calculate the Qualifying Payment Amount (QPA) — the benchmark insurers use as their starting offer in No Surprises Act billing disputes — was unlawfully calculated. The court found federal agencies improperly let insurers include “ghost rates” (contracted rates for services a provider never actually delivered) in QPA calculations, and improperly excluded bonus and incentive payments from the calculation — both features that tended to lower the benchmark price insurers offered providers. The ruling sided with healthcare providers, including the Texas Medical Association and air-ambulance operators, who argued the formula systematically underpaid them. Insurers won one narrower point: they can still exclude one-off, single-case agreements — such as certain air-ambulance contracts — from the contracted rates used to calculate the QPA.
What the ruling does: it requires federal agencies to revise how the QPA benchmark is calculated for insurer-provider billing disputes. What it does not do: it does not repeal the No Surprises Act, and it does not change what a patient can be billed directly — patients remain protected from surprise balance bills regardless of how this business-to-business formula is eventually recalculated. The court’s own majority opinion said the change need not cause “all-out chaos,” since agencies can continue using the current formula temporarily while a replacement is developed. This is a dispute over how insurers and providers split a bill between themselves, not a change to patient protections — and it should not be read as legal advice for any specific billing dispute.
Price Transparency — Does It Actually Help?
Federal price-transparency rules now require hospitals to publish negotiated rates and give patients “good-faith estimates” for scheduled care, and insurers must provide comparable cost-estimate tools. In practice, transparency helps most when a patient has a real choice of provider, time to shop before a non-emergency procedure, and a comparison tool that is actually usable — none of which apply in an emergency, and not all of which apply even for routine care in areas with few competing providers. Compliance with hospital price-posting rules has also been uneven since the requirement began. The fair assessment is that price transparency is a necessary but not sufficient tool: it has not solved affordability on its own, and it has not failed either — it works best as one piece of a larger set of changes, not a standalone fix.
Healthcare Costs by Service
Where reliable data exists
| Service type | Cost-related access issue documented |
|---|---|
| Dental care | Most frequently skipped category — 18% of adults went without dental care in 2025 due to cost, per KFF, ahead of every other category. |
| Doctor visits | 15% of adults skipped a doctor visit due to cost in 2025 (KFF). |
| Follow-up care | 10% skipped recommended follow-up care due to cost (KFF). |
| Mental health / counseling | 10% skipped mental health care or counseling due to cost (KFF); mental health coverage is often subject to separate network and reimbursement rules than medical coverage. |
| Prescription medication | 9% skipped filling a prescription outright due to cost, with a further 34% taking some other cost-saving medication step (KFF). |
| Emergency care | Not typically delayed for cost reasons at the point of the emergency itself, given EMTALA protections — but billed at a higher rate, and can carry out-of-network exposure. |
Dental insurance is typically a separate product from medical insurance, with its own lower annual coverage caps — a structural reason dental care shows the highest cost-driven skip rate of any category tracked here.
When Healthcare Competes With Rent and Food
KFF’s 2026 polling found health costs are now tied with gasoline and transportation as the top affordability worry for US households, ahead of many other categories. Survey evidence consistently shows a share of households — cited at roughly half in some 2026 polling — report cutting back on other essentials, including groceries, utilities or savings contributions, to cover healthcare costs in a given year. This article does not fabricate an individual household’s budget; the honest framing is the “ordinary decision” itself: do I make the appointment now, or wait until payday? — illustrative framing, not a reported quote from any specific person.
Who Pays? The Money Flow
Healthcare spending moves through several layers before it reaches a provider: a patient (or their employer, on their behalf) pays premiums to an insurer; the insurer negotiates rates with and pays healthcare providers; government programs (Medicare, Medicaid, ACA subsidies) pay or subsidize premiums and care for eligible populations; and taxes fund the government side of that chain. At the point of care, the patient separately owes deductibles, copays and coinsurance directly. Pharmaceutical and medical-device manufacturers sit further upstream, setting list prices that insurers and pharmacy-benefit managers then negotiate down to varying degrees — which is part of why the same drug can have wildly different final prices depending on a patient’s specific insurance plan.
What Changed in 2026?
POLICY — verified, current developments
ACA subsidies: the enhanced premium tax credits first introduced during the pandemic and extended through 2025 were not renewed by Congress, and expired at the end of 2025. The “subsidy cliff” has returned: households with income above 400% of the federal poverty level lose eligibility for premium tax credits entirely once they cross that line. KFF estimates subsidized marketplace enrollees will pay 114% more on average for premiums in 2026 (roughly $888 to $1,904 per year), and projects average effectuated marketplace enrollment could fall from 22.3 million in 2025 to somewhere between 16.5 and 17.5 million in 2026 — a decline of roughly 5 million people, concentrated heavily among households just above the 400% FPL threshold, where sign-ups fell about 44%.
Uninsured rate: CDC’s National Health Interview Survey found the uninsured rate held steady at 8% in 2025 (11.6% among adults 18-64), though the number of uninsured people grew by about 800,000, including 300,000 children, even as the rate stayed flat — a sign of population growth outpacing coverage growth. KFF and other analysts expect the uninsured rate to rise in 2026 and beyond as the effects of expired ACA subsidies and separate Medicaid eligibility changes show up in survey data; the Census Bureau’s more comprehensive American Community Survey data for this period was not yet available as of this writing.
Hospital financial pressure: a rising uninsured population can increase uncompensated care costs for hospitals, which may in turn pressure hospital finances — this has been reported as a risk facing the sector in 2026 commentary, though it does not apply uniformly to every hospital, and this article does not claim it as a proven, system-wide outcome.
Surprise billing: see the dedicated section above on the August 12, 2026 5th Circuit ruling on the QPA formula.
The Complete Timeline
Reverse chronological — major milestones in US healthcare affordability
5th Circuit vacates part of the No Surprises Act’s QPA formula
What changed: the full 5th US Circuit Court of Appeals ruled federal agencies unlawfully allowed “ghost rates” and excluded bonus payments when setting the Qualifying Payment Amount insurers use in billing-dispute arbitration.
Why it matters: reopens the insurer-provider payment formula behind the No Surprises Act; patient-facing protections against balance billing are unchanged.
CDC confirms uninsured rate held at 8% in 2025
What changed: the rate was statistically flat versus the prior year, but the number of uninsured Americans still grew by about 800,000.
Why it matters: a flat rate masks rising absolute numbers and sets a pre-subsidy-expiration baseline for 2026.
KFF poll reaffirms 36% skipped or postponed needed care
What changed: KFF’s “Health Care Costs, Expiring ACA Tax Credits, and the 2026 Midterms” poll confirmed the 36% figure and found ~90% of adults say healthcare costs will affect their midterm vote.
Why it matters: shows the affordability problem is not a one-time survey result but a persistent, multi-year pattern.
CMS final report: 23.1 million enrolled, premium shock lands lower than projected
What changed: CMS’s March 27, 2026 open enrollment report put final 2026 ACA marketplace sign-ups at 23.1 million, down from a record 24.2 million in 2025 — a decline, but the second-highest total on record. KFF found the actual average net premium payment for subsidized enrollees rose 58% ($113 to $178 a month), well below the 114% increase projected before enrollment closed, as many consumers switched to cheaper plans and higher-cost enrollees left the market at disproportionate rates.
Why it matters: the subsidy cliff reduced coverage and raised bills as expected, but consumer plan-switching softened the impact compared with the original projection.
2026 ACA plan year begins without enhanced subsidies
What changed: enhanced premium tax credits, unrenewed by Congress, expired December 31, 2025, restoring the pre-pandemic “subsidy cliff” at 400% of the federal poverty level.
Why it matters: average subsidized-enrollee premium payments were projected to rise 114%, and marketplace enrollment was projected to fall by millions.
CFPB asserts federal law preempts state medical-debt credit laws
What changed: the CFPB issued an interpretive rule arguing the Fair Credit Reporting Act preempts roughly 15 states’ own medical-debt credit-reporting restrictions.
Why it matters: creates continued legal uncertainty over whether state-level medical-debt protections will hold.
Federal court vacates CFPB’s medical-debt credit-report ban
What changed: a US District Court (E.D. Texas) vacated the CFPB’s finalized rule banning medical debt from credit reports, at the CFPB’s own request, after new agency leadership had paused enforcement earlier in 2025.
Why it matters: reversed one of the most consequential medical-debt consumer protections finalized under the prior administration.
Federal Reserve SHED records 26% skipped medical treatment
What changed: the Fed’s household survey found 26% of adults skipped some medical treatment for affordability reasons in 2025 — down from 28% in 2024, the lowest since 2022.
Why it matters: this narrower, treatment-specific measure gives the KFF “any needed care” figure independent corroboration from a different federal data source.
KFF-Peterson publishes definitive $220B medical debt estimate
What changed: analysis of Census SIPP data (December 2021) found $220 billion in medical debt held by roughly 20 million Americans.
Why it matters: remains the most-cited, most rigorous national medical-debt estimate as of 2026, despite its underlying data predating the analysis by over two years.
Credit bureaus voluntarily limit medical debt reporting
What changed: Experian, Equifax and TransUnion jointly agreed to remove paid medical collections, drop medical debts under $500, and add a 12-month grace period before reporting.
Why it matters: these voluntary protections remain in effect in 2026 even after the CFPB’s own federal rule was later vacated.
CFPB estimates $88 billion in medical debt on credit reports
What changed: using June 2021 data, the CFPB estimated $88 billion in medical bills sat on the credit reports of about 15 million Americans.
Why it matters: became the baseline figure cited in the multi-year push to limit medical debt’s effect on credit access.
No Surprises Act takes effect
What changed: patients gained federal protection from balance billing for most out-of-network emergency care and certain out-of-network care at in-network facilities.
Why it matters: the payment formula this law created for insurer-provider disputes is exactly what the August 2026 court ruling revisited.
Inflation Reduction Act enables Medicare drug price negotiation
What changed: for the first time, Medicare gained authority to directly negotiate prices for a limited set of high-cost drugs, alongside a $35 monthly insulin cap for Medicare beneficiaries and a $2,000 annual out-of-pocket drug cap.
Why it matters: a structural shift after decades in which the US government did not negotiate drug prices at scale.
ACA marketplaces and Medicaid expansion open
What changed: ACA insurance marketplaces began operating, and states could expand Medicaid eligibility with enhanced federal funding.
Why it matters: drove the largest coverage-expansion period in US history, cutting the uninsured rate substantially in the years that followed.
Affordable Care Act signed into law
What changed: established insurance marketplaces, subsidies, preventive-care coverage mandates, and protections for people with pre-existing conditions.
Why it matters: remains the legal and structural foundation for most of the coverage and affordability debates in this article.
2003
Medicare Part D prescription drug benefit begins
What changed: created the first Medicare prescription drug benefit, delivered entirely through private insurance plans.
Why it matters: the drug-pricing and affordability debates in this article trace directly back to Part D’s original design choices.
Medicare and Medicaid enacted
What changed: created federal health coverage for Americans 65 and older (Medicare) and for eligible low-income Americans (Medicaid).
Why it matters: the foundational public programs against which every later affordability reform is measured.
The Biggest Warning Sign May Not Be the Price of Healthcare
AITIMELINE ANALYSIS
What matters is not just the price — it’s the behavior change
A healthcare system becomes financially dangerous not only because prices are high, but because people begin changing their health behavior in response to price. The most important single statistic in this article may not be the $5.3 trillion national total, or even the 36% or 26% affordability figures on their own — it is what those figures represent: what people stop doing because healthcare costs too much. A dollar figure describes a system. A behavior change describes a consequence.
Can AI Reduce Healthcare Costs?
Artificial intelligence is already being deployed against several of the cost drivers described above, mostly on the administrative and operational side rather than the clinical one. AI-assisted scheduling and patient navigation can reduce missed appointments and no-shows. Automated clinical documentation can cut the time clinicians spend on billing-related paperwork, one contributor to administrative overhead. Telehealth platforms, increasingly AI-assisted for triage and intake, can lower the cost and time barrier for some primary-care and mental-health visits. AI-assisted diagnostic tools are being piloted in imaging and pathology to help clinicians work faster, and AI-driven billing-automation tools are being used by both providers and insurers to reduce claims-processing costs.
✅ What AI Can Plausibly Help With
- Reducing administrative and billing overhead
- Improving appointment scheduling and reducing no-shows
- Supporting (not replacing) diagnostic review in specific, validated use cases
- Making telehealth triage faster and more accessible
❌ What AI Cannot Do
- Replace a licensed clinician’s judgment or diagnosis
- Guarantee accuracy — AI tools can be wrong, biased, or trained on unrepresentative data
- Substitute for professional medical evaluation of a real symptom
- Fix pricing or market-structure problems on its own
AI tools should not be treated as a substitute for professional medical evaluation. Risks including incorrect AI-generated advice, algorithmic bias, privacy exposure and unequal access to AI-enabled care are active, documented concerns in current health-policy research, not hypothetical ones.
AiTimeline Analysis
AITIMELINE ANALYSIS — original interpretation, not established fact
10 original observations from this data
- The affordability problem is not identical to the uninsured problem — most people who skip care for cost reasons in these surveys are already insured.
- Insurance reduces financial risk without eliminating financial barriers, which is why “insured” cannot be treated as a proxy for “can afford care.”
- A deductible can make the calendar date of a visit an economically significant decision, independent of the medical urgency of that visit.
- The single most diagnostic statistic for system health may not be spending — it may be what patients report stopping because of price.
- Delayed care can shift cost from routine treatment toward more intensive treatment, but the effect is condition-specific, not universal.
- Healthcare prices and healthcare utilization are separate problems with separate solutions; US spending is high mainly on price, not overuse.
- Medical debt can change future healthcare-seeking behavior, creating a feedback loop distinct from the original illness that caused the debt.
- Prescription affordability directly shapes medication adherence, which is a clinical outcome, not just a financial one.
- Price transparency only helps when a patient has real provider choice and time to use it — which rules out most emergency and much rural care.
- A health system can post record-high national spending and still leave a majority of its patients worried about affording routine care — the two are not contradictory.
Explore More Timelines
People Also Ask
Frequently Asked Questions
Explore More on AiTimeline
⚠️ Editorial Note & Methodology
This article separates official government data (CMS, CDC, Federal Reserve, CFPB), independent survey research (KFF, Commonwealth Fund) and current-event reporting (court rulings, policy changes) throughout, with every statistic labeled by source, year and population. Figures from different sources measure different things by design; where two numbers appear to disagree, the difference in methodology is explained rather than resolved into a single blended figure. Sources consulted include CMS’s National Health Expenditure Accounts, CDC’s National Health Interview Survey, KFF’s Health Tracking Polls and Employer Health Benefits Survey, the Federal Reserve’s Survey of Household Economics and Decisionmaking, the Commonwealth Fund’s international comparisons, the Consumer Financial Protection Bureau, and contemporaneous reporting on the August 2026 5th Circuit ruling from STAT News, Modern Healthcare and Becker’s Hospital Review. This page will be revisited when Census Bureau ACS coverage data, updated CMS NHE figures, or material 2026-27 policy changes are published.
Sources & further reading
Every dated entry above was checked against these references. Last reviewed 20 September 2026.
- KFF - Americans' Challenges With Health Care Costs (36% skipped/postponed care, May 2025 poll)
- USAFacts - How many people skip medical treatment due to healthcare costs (26% in 2025, Fed data)
- Federal Reserve - Report on the Economic Well-Being of U.S. Households in 2025 (SHED)
- CDC/NHIS - 2025 uninsured rate release (8.3%, May 28, 2026)
- KFF 2025 Employer Health Benefits Survey (premiums, deductibles)
- Commonwealth Fund - Mirror, Mirror 2024 (US vs. 10 high-income countries)
- Peterson-KFF Health System Tracker - US health spending (CMS NHE 2024 data)
- KFF - ACA Marketplace enrollment, premiums and deductibles for 2026