Indian Farm Exports: Growth, Risks and the Red Flags Ahead
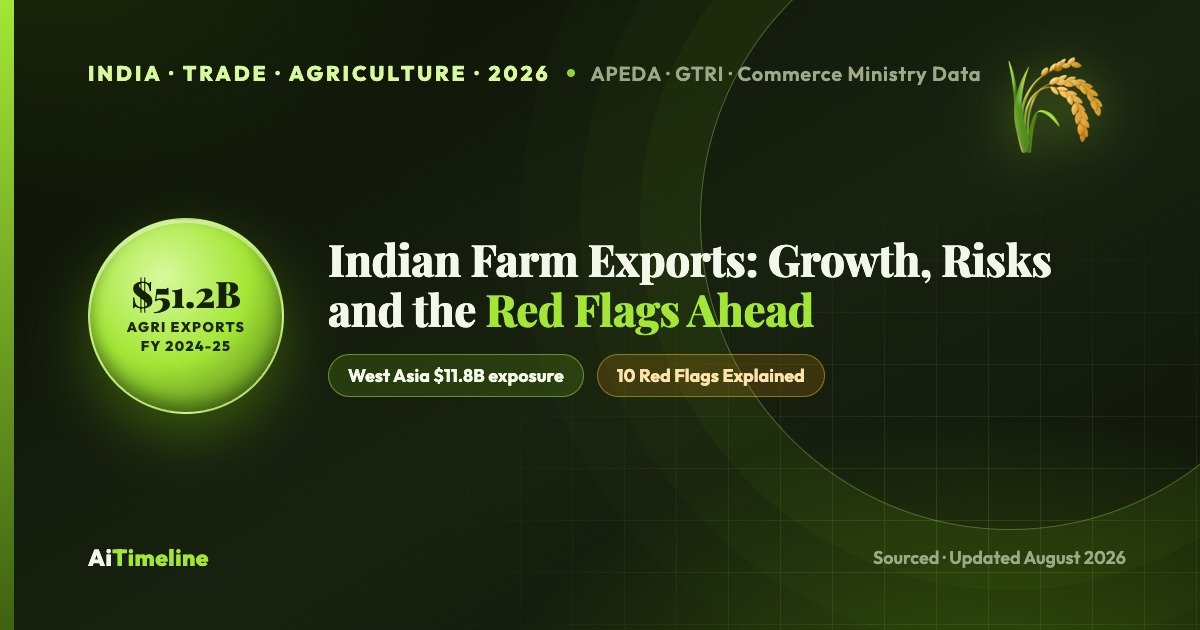
India farm exports hit a record $51.2 billion in FY25 - but US tariffs, West Asia risk and food-safety rejections raise real red flags for 2026.
Latest Story
In FY2024-25, India shipped out roughly $51.2 billion worth of agricultural produce — rice to West Africa, shrimp to the United States, spices to the Gulf, tea to Iraq and Russia. By that headline number, Indian farm exports are not in crisis. They grew. What did not grow at the same pace, in most cases, is the money that reached the farmer who actually planted the crop. That gap — between an export chart going up and a farm-gate price that barely moves — is the real story hiding underneath this year’s trade data, and it is why a growing export book can still coexist with a list of genuine warning signs: a $50-billion-plus tariff shock from Washington that briefly hit Indian shrimp harder than any competitor’s, a fifth of farm exports concentrated in a West Asia region now exposed to shipping and insurance risk from the Iran-Israel conflict, European food-safety inspectors flagging Indian spice consignments for a carcinogenic fumigant over a thousand times in a single year, and a domestic policy habit of banning or price-capping exports whenever local food inflation gets uncomfortable. None of these, on its own, threatens to collapse India’s farm trade. Together, they describe a sector that has scaled faster than it has modernized — still selling too much of its produce raw, uncertified and undifferentiated into markets that increasingly reward the opposite. This is the story of what could interrupt that growth, and why more exports have not automatically meant a better life for the average Indian farmer.
Last fact-checked: September 20, 2026, against Ministry of Commerce & Industry FY2025-26 data, USTR Federal Register notices on Section 122/301 actions, Reuters rice-trade reporting and the India-EU FTA text. See the Sources & Methodology section for the full list.
🧠 Indian Farm Exports — Quick Answer (60 Seconds)
India’s agricultural exports hit a record $51.2 billion in FY2024-25 (Ministry of Commerce/APEDA), led by rice ($12.95bn) and marine products ($7.45bn), with the US, UAE and China as top buyers. Exports are growing, not collapsing — but real risks stack up: US tariffs that briefly hit 50% before easing to 10%, a fifth of farm exports concentrated in a West Asia region exposed to Gulf shipping disruption, recurring EU/Gulf food-safety rejections over pesticide and ethylene-oxide residues, and a habit of sudden domestic export bans. Higher export value does not automatically raise farmer income, because most of the margin sits with aggregators, processors and exporters, not the farm gate.
Indian Farm Exports: Key Questions
What to Know
- India’s farm exports are resilient, not in crisis. FY2025-26’s provisional $52.55 billion is a new record, continuing steady growth since FY2019-20’s roughly $34.5 billion — the “red flags” are warning signs on the road ahead, not evidence of decline already underway.
- Destination concentration is more regional than national. No single country takes more than 12% of India’s agri exports (the US leads at 11.76%), but West Asia as a bloc absorbs about a fifth of the total — a genuine geographic concentration risk even though no one buyer dominates.
- US tariffs have round-tripped, then changed legal basis entirely. A 50% duty in August 2025 fell to 18% under a February 2026 interim deal, then to a 10% Section 122 baseline by February 24, 2026 — and when that baseline lapsed on July 24, 2026, a Section 301 forced-labor duty of 10% took its place, while spices, tea, coffee, cashews and several fruits stayed duty-free throughout most of the escalation.
- Food-safety rejections are a market-access problem, not a demand problem. EU alerts for ethylene oxide in Indian spices topped 1,200 in 2024 alone, even as global demand for Indian chilli, cumin and turmeric stayed strong — the barrier was compliance, not appetite.
- India still exports too much of its produce raw. Processed and value-added food is roughly 20-23% of agri exports, up from about 15% a decade ago — real progress, but still a minority share next to bulk commodities like rice and raw marine products.
- Domestic policy swings hit exporters as hard as external tariffs do. The July 2023 ban on non-basmati white rice cut exports of that category by roughly a third before being lifted in September 2024 — a self-inflicted disruption aimed at controlling domestic food inflation.
- India-US agricultural trade is a genuine two-way opportunity, not just a threat. The same February 2026 deal that cut US tariffs on Indian goods also opened India’s market wider to US almonds, apples and other farm goods — showing both sides treat agriculture as leverage and opportunity together.
- India-EU trade talks concluded in January 2026 largely without touching agriculture. Both sides kept sensitive farm sectors — rice, sugar, dairy for the EU; most farm products for India — outside the tariff-cutting deal, so it will not meaningfully open new EU market access for Indian farmers.
- Cold-chain and logistics gaps still cost India real export volume. An estimated 25-30% of fruit and vegetable output spoils before reaching a buyer, and more than two-thirds of farmers lack cold storage within 50 km — a domestic bottleneck no trade deal can fix.
- The deepest risk is structural, not cyclical: whether India can shift from selling commodities by the container-load to selling traceable, branded, quality-certified food — the same shift competitors like Vietnam (coffee, spices) and Ecuador (shrimp) are also racing to make.
India’s Farm Exports: From Growth to Global Pressure
The long-term trend, and why growth and risk can be true at the same time.
OFFICIAL DATA: India’s agriculture and allied exports climbed from roughly $34.5 billion in FY2019-20 to $51.2 billion in FY2024-25 — an increase of about 48% over six years, or a compound annual growth rate near 8%, according to Ministry of Commerce & Industry trade data compiled by industry trackers. The climb was not a straight line: exports dipped briefly during the pandemic’s first shock in FY2020-21 before rebounding on high global food prices following Russia’s invasion of Ukraine in 2022, then continued rising through a series of domestic export restrictions (see the Timeline below) that were designed to cap the growth of specific categories like rice, wheat and sugar without stalling the sector overall.
| Fiscal Year | Agri & Allied Exports | Year-on-Year Change | Notable Context |
|---|---|---|---|
| FY2019-20 | ~$34.5 billion | — | Pre-pandemic baseline |
| FY2020-21 | ~$41.3 billion | Up, despite COVID-19 disruption | Global supply-chain shocks pushed buyers toward reliable suppliers |
| FY2021-22 | ~$50.2 billion | Sharp rise | Global food-price spike after Russia’s invasion of Ukraine (Feb 2022) |
| FY2022-23 | ~$53.1 billion | Continued growth | Record before a sequence of export restrictions began biting |
| FY2023-24 | $48.76 billion | Decline | Non-basmati rice export ban (from July 2023) and wheat/sugar curbs suppressed volumes |
| FY2024-25 | $51.12 billion | Up ~5% | Rice ban lifted (Sept 2024); record year despite tariff and geopolitical headwinds emerging late in the year |
| FY2025-26 | $52.55 billion (provisional) | Up ~2.8% | New record despite Section 122/301 US tariff churn and Iran-conflict disruption to Gulf-bound basmati shipments |
Figures compiled from Ministry of Commerce & Industry / APEDA trade data as reported by IBEF and industry trade trackers; early-year figures are approximate given differing agri-and-allied product definitions across years. ANALYST VIEW: the FY2023-24 dip shows domestic policy, not foreign demand, was the swing factor that year — a pattern that recurs throughout this article.
The 10 Red Flags, At a Glance
Warning signs that could shape whether growth continues — not evidence of a crisis already underway.
1. Market Concentration
No single country takes more than 12% of exports, but West Asia and North America together absorb a disproportionate share — a regional, not national, concentration risk.
2. West Asia Exposure
About $11.8 billion, roughly a fifth of farm exports, runs through a region where the Iran-Israel conflict and Red Sea disruption can raise shipping and insurance costs overnight.
3. US Tariff Volatility
Duties on Indian goods swung from 10% to 50% to 18% to 10% inside 12 months — while roughly $1 billion of India’s $2.5 billion in FY25 US agri exports stayed exempt throughout.
4. Food-Safety & SPS Barriers
EU alerts for ethylene oxide in Indian spices topped 1,200 in 2024; shipments can be rejected even when demand is strong, because compliance failed, not appetite.
5. Weak Value Addition
Processed food is roughly 20-23% of agri exports — growing, but still a minority next to bulk rice, raw shrimp and unprocessed spices.
6. Logistics & Cold Chain Gaps
An estimated 25-30% of fruit and vegetable output spoils before sale; most farmers have no cold storage within 50 km.
7. Global Competition
Ecuador is out-pricing Indian shrimp in the US on tariffs alone; Vietnam and Thailand contest India’s rice lead; Kenya and Vietnam pressure tea and coffee.
8. Commodity Concentration
Rice alone is roughly a quarter of agri exports by value — a policy shock to one crop can move the entire national export number.
9. Export Policy Uncertainty
Sudden bans, minimum export prices and duties — like the 2023-24 rice restrictions — protect domestic food inflation but blindside exporters and overseas buyers.
10. The Farmer Transmission Problem
Export value is captured across farmer, aggregator, processor, exporter and logistics — more exports do not automatically mean a better farm-gate price.
Indian Farm Exports: The Full Timeline
Reverse chronological. Every entry is dated and sourced.
Section 122 Tariff Baseline Lapses, Section 301 Forced-Labor Duty Takes Over at 10%
What changed: The Section 122 10% tariff baseline on Indian goods lapsed at 12:01am ET on July 24, 2026, hitting its 150-day statutory limit with no Congressional extension; a separate Section 301 duty targeting 60 economies over forced-labor compliance took effect the same moment, placing India in the lower 10% tier (versus 12.5% for less-compliant economies) after New Delhi addressed US forced-labor concerns.
Why it matters: The headline rate on most Indian goods stayed at 10%, but the legal mechanism changed entirely — from a reciprocal-tariff statute to a forced-labor enforcement statute — meaning future changes now depend on a different review process. About 45% of India’s US-bound exports, including generic pharmaceuticals and smartphones, remain exempt from the new duty.
Iran Conflict Disruption Cuts Basmati Rice Exports to Gulf Markets in H1 2026
What changed: India’s basmati rice exports fell 5.5% to 3.36 million tonnes in January-June 2026 as the Iran conflict disrupted trade with key Gulf buyers including Iran itself; non-basmati rice exports to African markets rose 9.6% to 8.9 million tonnes over the same period, keeping total rice exports up about 5% year-on-year.
Why it matters: This is the West Asia concentration risk flagged elsewhere on this page turning into an actual trade impact, not just a modelled exposure — though non-basmati demand from Africa showed the export book can partly offset a regional shock rather than being fully exposed to it.
FY2025-26 Agricultural Exports Hit a New Record of $52.55 Billion
What changed: The Commerce Ministry’s provisional data, published April 22, 2026, put India’s agriculture and allied exports for FY2025-26 (April 2025-March 2026) at $52.55 billion, up 2.8% from FY2024-25’s $51.12 billion — a new record, though a slower growth rate than the prior year’s roughly 5% rise.
Why it matters: Growth held up despite the US tariff sequence and Gulf shipping risk described throughout this article; marine products (~$8.4 billion) and pulses (up 21.83% to $948.11 million) led the gains, while rice slipped slightly to roughly $11.5 billion from the prior year’s $12.95 billion.
US Reciprocal Tariff on India Cut to 18%, Then a 10% Baseline Takes Over
What changed: An interim US-India trade agreement announced February 7, 2026 cut the reciprocal tariff on Indian goods from 25% to 18%; weeks later, a US Supreme Court ruling against IEEPA-based tariffs (Feb 20, 2026) pushed India’s rate into a separate Section 122 mechanism, which settled at a 10% baseline effective February 24, 2026.
Why it matters: This unwound most of the August 2025 tariff shock inside six months, but the relief is not guaranteed to be permanent — the Section 122 window has an expiry, and a parallel Section 301 investigation opened in March 2026 could reopen tariff risk on specific agricultural categories.
India-EU Free Trade Agreement Concluded, Agriculture Mostly Excluded
What changed: The European Commission and India concluded FTA negotiations on January 27, 2026 after nearly 20 years of talks, removing or reducing tariffs on more than 90% of traded goods — but keeping agriculture largely outside the deal on both sides.
Why it matters: Indian marine products, leather and textiles gain from the wider deal, but rice, sugar, dairy and most sensitive farm categories stay protected on the EU side, and India kept its own farm-sector protections too — meaning this landmark agreement will not meaningfully expand EU market access for most Indian farmers.
GTRI Flags $11.8 Billion of Agri Exports at Risk from West Asia Conflict
What changed: Think tank Global Trade Research Initiative estimated that $11.8 billion of India’s agricultural and food exports — about 21.8% of the total — run through West Asia, a region destabilised by the Iran-Israel conflict and Red Sea shipping disruption.
Why it matters: Rice alone accounts for $4.43 billion of that exposure (36.7% of India’s global rice exports), meaning a shipping-lane disruption in the Gulf or Strait of Hormuz could raise freight costs, delay perishable cargo and squeeze insurance availability for a fifth of India’s entire farm-export book.
US Tariffs on India Hit 50%, With Key Agri Exemptions Carved Out
What changed: A 25% “reciprocal” tariff, layered with a further 25% penalty tied to India’s Russian oil purchases, brought US duties on Indian goods to 50% by late August 2025 — among the highest the US applied to any major trading partner.
Why it matters: Seafood, shrimp and processed food bore the brunt (up to 27.8 percentage points of extra tariff differential on some categories), while spices ($358.66 million), 50 processed food items ($491.31 million), tea and coffee ($82.54 million) and several fruits and nuts stayed exempt — shielding roughly $1 billion of India’s $2.5 billion in FY25 US agri exports even at the tariff’s peak.
Farmer impact: Indian shrimp exporters, facing an effective US tariff around 58% against Ecuador’s 15-19%, saw US shrimp import volumes collapse 43% year-on-year by August 2025 — a direct hit to coastal aquaculture farmers in Andhra Pradesh and Gujarat.
Hong Kong and Singapore Recall MDH and Everest Spice Blends Over Ethylene Oxide
What changed: Hong Kong’s Centre for Food Safety and the Singapore Food Agency recalled specific spice mixes from two of India’s largest spice brands, MDH and Everest, after finding ethylene oxide — a carcinogenic fumigant — above permitted limits.
Why it matters: The recall triggered a wave of scrutiny that followed EU RASFF alerts already running high; FSSAI launched its own investigation, and India subsequently issued new rules restricting ethylene oxide use in spice sterilisation for export.
India Lifts Its Non-Basmati White Rice Export Ban
What changed: The Directorate General of Foreign Trade lifted the July 2023 export ban on non-basmati white rice on September 28, 2024, initially replacing it with a $490-per-tonne minimum export price, which was itself removed on October 23, 2024.
Why it matters: The 14-month ban had cut India’s rice exports sharply — total shipments fell roughly 34% across the August 2023-May 2024 period versus the prior year — and its removal was central to FY2024-25’s export rebound, but it also demonstrated how fast domestic food-inflation politics can override export commitments.
India Bans Non-Basmati White Rice Exports
What changed: DGFT Notification No. 20/2023 (July 20, 2023) banned exports of semi-milled and wholly milled non-basmati white rice, following earlier restrictions on broken rice, to protect domestic supply and prices.
Why it matters: India supplies roughly 30-40% of the world’s traded rice; the ban visibly tightened global rice prices and showed how a single Indian policy decision can move an entire world commodity market — a dynamic that also cuts the other way for India’s own exporters when it reverses.
India Becomes World’s Second-Largest Tea Exporter
What changed: India’s tea exports rose 10% to a 10-year high of 255 million kilograms in 2024, overtaking Sri Lanka to become the world’s second-largest tea exporter behind China.
Why it matters: The gain came partly because Sri Lanka’s own exports fell over 50% and Kenya’s dropped nearly 19% in the same period — a reminder that India’s competitive wins are sometimes as much about rivals stumbling as about India’s own quality gains.
India Launches Its First Agricultural Export Policy
What changed: The Commerce Ministry approved India’s first comprehensive Agricultural Export Policy in December 2018, targeting a doubling of agri exports and setting up state-level export plans, cluster-based production and infrastructure funding through APEDA.
Why it matters: The policy set the institutional foundation — testing labs, GI-tagging pushes, cluster development for products like Nashik grapes or Alphonso mangoes — that underpins most of the quality initiatives referenced throughout this article, even though the export-doubling target has not yet been met.
Why West Asia Matters to Indian Farm Exports
Proximity and demand make it a natural market; geopolitics make it a genuine risk.
ANALYST VIEW (GTRI): West Asia — the Gulf states, Iran, Iraq and neighbouring markets — buys about $11.8 billion of India’s agricultural and food exports, roughly 21.8% of the national total, according to a 2025 Global Trade Research Initiative report. Rice is the anchor: $4.43 billion of India’s rice exports, 36.7% of its global rice trade, goes to this one region. Cereals, fruits, vegetables and spices combined account for $7.48 billion, and dairy products worth $281.1 million make up nearly 29% of India’s total dairy exports.
The relationship is not accidental. A large Indian diaspora across the UAE, Saudi Arabia, Qatar and Oman sustains steady demand for Indian staples and spices. Geographic proximity keeps shipping times and costs low compared with competing supply from the Americas or Southeast Asia. And several Gulf states import the great majority of their food, making them structurally dependent on suppliers like India.
The risk: that same geography sits next to some of the world’s most contested shipping lanes. The Iran-Israel conflict and disruption around the Strait of Hormuz — through which a significant share of Gulf-bound and Gulf-origin shipping passes — can raise marine insurance premiums, lengthen delivery times for perishable produce, and in a worst case, force rerouting that adds days to fresh-produce transit. Fertiliser imports, which India also sources partly from the Gulf and its wider neighbourhood, face a mirrored exposure on the way in.
AITIMELINE ANALYSIS: None of this points to a permanent collapse of India’s West Asia trade — the region’s demand for Indian food is structural and long-term. But it is a genuine, live risk to shipping cost and delivery reliability that a purely demand-side reading of “exports are growing” would miss. A single tanker-insurance shock in the Gulf can do more near-term damage to a perishable mango or dairy shipment than a full percentage point of tariff.
Indian Farm Exports and the US: Opportunity or Vulnerability?
Both, depending on the product category and the month.
GOVERNMENT POSITION: Commerce Minister Piyush Goyal has characterised the February 2026 interim trade deal as “fair, equitable and balanced,” pointing to zero-duty US market access for spices, tea, coffee, cashews, mangoes, bananas, kiwis and papayas as proof India protected its most sensitive farm exports even during the tariff escalation.
ANALYST VIEW (GTRI): Even with exemptions, the sequence hurt specific categories hard. Fish, meat and processed seafood ($2.58 billion in FY25 exports) faced a 27.83-percentage-point tariff differential at the 50% peak; processed food, sugar and cocoa ($1.03 billion) faced 24.99 points; cereals, vegetables, fruits and spices ($1.91 billion) faced a comparatively mild 5.72-point differential. Overall Indian exports to the US fell from $8.83 billion to $6.31 billion between May and October 2025 as duties escalated.
The opportunity side: the same deal opened India’s market wider to specific US agricultural products — distillers’ grains, red sorghum, tree nuts, soybean oil, wine and spirits — while protecting India’s own sensitive staples (rice, wheat, sugar, dairy, poultry) from reciprocal opening. That is a genuine two-way negotiation, not a one-directional squeeze, even if Indian shrimp and seafood exporters bore disproportionate pain during the 2025 tariff spike.
What remains uncertain: the 10% Section 122 baseline in force since February 24, 2026 runs on a window that can expire, and a separate Section 301 investigation opened March 11, 2026 has flagged agricultural goods among possible future targets. Exporters planning around the current rate are planning around a policy that has already changed four times in a year.
Why Food-Safety Rules Can Stop an Export Even When Demand Is High
Sanitary and Phytosanitary (SPS) barriers, explained.
Every food shipment crossing a border has to satisfy Sanitary and Phytosanitary (SPS) requirements — rules on pest control, disease, and chemical residue — that importing countries set independently, and which vary by market. A shipment can fail at several distinct points:
1. Farm → 2. Testing → 3. Certification → 4. Processing → 5. Packaging → 6. Port → 7. Foreign inspection → 8. Consumer. A pesticide applied slightly too close to harvest can leave residue above a Maximum Residue Limit (MRL) discovered only at step 7. A fumigant used for pest control during processing (like ethylene oxide) can be legal in India but banned outright in the EU. A pest as small as the khapra beetle, found in a single consignment, can trigger a shipment-wide quarantine hold. None of these failures relate to whether a foreign buyer wants the product — they relate to whether the exporter’s paperwork and residue profile match that specific market’s rules.
REPORTED: India faced more than 1,200 spice-related alerts on the EU’s Rapid Alert System for Food and Feed (RASFF) portal in 2024 — chilli powder accounting for about 45% of alerts, cumin 20%, turmeric 15% — with an estimated $200 million in shipments lost to rejections and destruction. Between September 2020 and April 2024, RASFF recorded ethylene oxide contamination in 527 India-linked products, with India the sole identified country of origin for 332 of them (European Commission / EFSA data cited in multiple reports).
GOVERNMENT POSITION: FSSAI and the Spices Board responded with new rules restricting ethylene oxide in spice sterilisation, expanded residue-monitoring plans for grapes and pomegranates, and pushed exporters toward Good Agricultural Practices (GAP) and GlobalG.A.P. certification. APEDA has also expanded its network of accredited testing laboratories to catch residue issues before shipment, not after rejection.
AITIMELINE ANALYSIS: the pattern across mangoes (Japan, EU), shrimp (EU antibiotics), rice (China, GM/pest concerns) and spices (EU, Hong Kong, Singapore ethylene oxide) is consistent — each rejection wave triggered a reactive fix rather than a structural, pre-emptive testing regime. That reactive pattern is itself a red flag: it means the next new residue standard or pest concern, in a market India hasn’t been rejected by yet, arrives as a surprise rather than a managed risk.
Why Quality May Matter More Than Volume From Here
India can almost certainly grow export volume further — more acreage, more processing capacity, more markets. But sustainable growth from a $51-billion base increasingly depends less on producing more and more on producing consistently: reliable Maximum Residue Limit compliance shipment after shipment, traceability from farm plot to export container, cold-chain-preserved freshness, and branding that lets a buyer pay a premium for an identifiable Indian product rather than a commodity. A container of undifferentiated basmati rice competes on price against Pakistani and Thai supply. A branded, traceable, GI-tagged Alphonso mango competes on quality and story — and survives a single failed MRL test without threatening the whole category’s reputation.
What Does India Export?
Top agricultural commodities, FY2024-25 unless noted.
| Commodity | FY25 Export Value | Major Destinations | Key Opportunity | Key Risk |
|---|---|---|---|---|
| Rice (basmati + non-basmati) | ~$12.95 billion | West Asia, West Africa, EU | ~30-40% of world rice trade; brand recognition for basmati | Export-ban precedent (2023-24); competition from Thailand, Vietnam, Pakistan |
| Marine products (shrimp, fish) | ~$7.45 billion | United States, China, EU, Southeast Asia | Large aquaculture base in Andhra Pradesh, Gujarat, Odisha | US tariff disadvantage vs Ecuador; EU antibiotic-residue history |
| Spices | ~$4.5-5 billion (Spices Board data) | US, China, UAE, Bangladesh, EU | “Spice bowl of the world” brand equity; GI-tagged regional varieties | Ethylene oxide/RASFF rejections; heavy EU/Gulf scrutiny |
| Tea | 255 million kg exported in CY2024 (world’s 2nd-largest exporter) | Russia, Iran, UAE, Iraq | Overtook Sri Lanka in 2024; strong CIS/Gulf demand | Kenya, Sri Lanka, Vietnam competition; buyer concentration in a few markets |
| Coffee | ~$1.18 billion (Apr-Oct FY2025-26) | Italy, Germany, Belgium, Russia | Rising Gulf and Russian demand momentum in 2025 | Vietnam, Brazil, Colombia dominate global volume and pricing |
| Fruits & vegetables | ~$1.82 billion | UAE, Bangladesh, Nepal, UK | Alphonso mango, Nashik grape brand recognition; GI tags | Cold-chain/logistics losses; pest-related rejections (fruit fly, EU mango ban precedent) |
| Processed foods | ~20-23% of total agri exports | US, UAE, EU, Southeast Asia | Fastest-growing category; highest per-unit value realisation | Still a minority share versus bulk/raw commodity exports |
Compiled from APEDA, Spices Board, Tea Board and Ministry of Commerce data as reported via IBEF and industry trade trackers; some figures are partial-year or provisional where noted.
The Logistics Bottleneck Behind the Trade Numbers
REPORTED: India produces over 300 million tonnes of fruits and vegetables annually, more than any country except China — yet an estimated 25-30% of that output spoils before reaching a buyer, a loss pegged at roughly ₹92,000 crore a year, largely because cold-chain coverage is thin and unevenly distributed. India has more than 8,689 cold storage facilities with a combined capacity of about 39.6 million tonnes, but over 70% of farmers still have no cold storage within 50 km of their farm, and the fisheries sector faces a cold-chain capacity shortage estimated at over 90%.
AITIMELINE ANALYSIS: this is arguably the most controllable red flag on this list — it is not geopolitics or a foreign government’s tariff decision, but a domestic infrastructure gap that directly determines how much of India’s harvest is even exportable before it spoils, and whether it arrives fresh enough to pass a foreign market’s quality inspection in the first place.
India vs the World: Commodity-Specific Competition
Rice: India vs Thailand vs Vietnam
Shrimp: India vs Ecuador. India’s effective US tariff on shrimp reached about 58% in 2025 versus roughly 15-19% for Ecuador — a policy-driven, not quality-driven, disadvantage. US shrimp imports from India collapsed 43% year-on-year by August 2025 while Ecuador’s exports hit a record $8.4 billion. Neither Ecuador nor Vietnam has the production capacity to fully replace India’s US volume, which is the main reason this remains a market-share fight rather than an existential threat to Indian aquaculture.
Tea: India vs Kenya and Sri Lanka. India overtook Sri Lanka in 2024 to become the world’s second-largest tea exporter (255 million kg), aided as much by a more-than-50% collapse in Sri Lankan exports and an 18.6% drop in Kenya’s as by India’s own gains — a reminder that India’s ranking here reflects rivals’ troubles as much as its own competitiveness.
Coffee: India vs Vietnam and Brazil. Vietnam and Brazil remain far larger by shipment volume in global coffee trade; India’s 2025 growth (roughly 15.5%, driven by Middle East and Russian demand) is a real gain but starts from a much smaller base, and India competes more on niche/specialty positioning than on bulk volume against these two giants.
What Does This Mean for Indian Farmers?
There is no single universal outcome. Export demand genuinely supports farm-gate prices for crops with active export channels — basmati rice growers in Punjab and Haryana, grape growers in Nashik, and shrimp farmers on the east coast have all benefited from export-linked price floors in good years. But the same export orientation cuts the other way when a ban hits: non-basmati rice farmers absorbed price pressure through the 2023-24 export restriction even though it was framed as protecting domestic consumers, not producers. Global competition pressures prices in categories where India is not cost-leader (coffee, some spice categories against Vietnam and Indonesia). Rising input costs — fertiliser, diesel, labour — squeeze margins regardless of export performance. And quality-compliance costs (testing, certification, cold storage) are real expenses that fall disproportionately on smaller farmers who cannot easily absorb them, potentially locking out exactly the growers who most need the export price premium.
Export Growth ≠ Automatic Farmer Income Growth
Export value is not one number that flows straight to a farmer’s pocket. It passes through a chain: farmer → aggregator/mandi → processor → exporter → logistics & freight → overseas buyer. Margin can be captured at any link. A processor adding value (cleaning, grading, packaging, branding) legitimately earns a share for that work. An exporter bears real currency, compliance and shipping risk, and prices accordingly. Logistics and freight costs have risen with the very geopolitical and tariff pressures described throughout this article. None of this is necessarily exploitation — it is the ordinary economics of a multi-step supply chain — but it does mean a rising national export figure is not proof that farm-gate prices rose by a comparable amount.
📊 Illustrative Example — Not Actual Market Data
If a kilogram of a spice sells overseas for $10, a portion covers international freight and importer margin, a portion covers the exporter’s processing, packaging and compliance costs, a portion covers the aggregator’s handling and transport, and what remains is the farm-gate price the grower actually receives — often a modest fraction of that $10, and one that does not move in lockstep with the export price when any link in the chain absorbs a cost increase (like a new tariff or a compliance failure) instead of passing it upstream. This example illustrates the structure of value capture, not a real transaction.
India’s Competitive Advantages
Where India Genuinely Leads
- The world’s largest or near-largest producer of rice, milk, spices, and several fruits and vegetables, giving genuine scale to export from.
- Diverse agro-climatic zones allow near year-round production across categories, from Himalayan apples to tropical spices.
- A large domestic market provides a demand cushion that pure export-dependent economies lack.
- Deep spice-growing and processing expertise built over centuries, with strong global brand recognition (“spice bowl of the world”).
- A large global Indian diaspora, especially across the Gulf and North America, sustains steady baseline demand for Indian staples.
- Geographic proximity to Gulf markets keeps shipping times and costs competitive versus more distant suppliers.
- Growing food-processing capacity and a rising GI-tagging push (Alphonso mango, Nashik grapes, Darjeeling tea) support higher-value branded exports.
- An expanding network of APEDA-accredited testing labs is closing the compliance gap that caused earlier rejection waves.
India’s Structural Weaknesses
What Still Holds the Sector Back
- Small, fragmented farm holdings make consistent quality and volume harder to guarantee at export scale than in more consolidated agricultural economies.
- Cold-chain and pre-cooling infrastructure remains thin and unevenly distributed, contributing to the 25-30% post-harvest loss estimate.
- Testing infrastructure, while expanding, has historically been reactive — catching residue problems after a rejection rather than before shipment.
- Logistics costs, including port handling and inland freight, remain a competitiveness drag versus some rivals with more developed export corridors.
- Branding and traceability lag behind competitors in several categories, keeping India a price-taker on undifferentiated bulk commodities.
- Processing capacity, though growing, still leaves the majority of agri exports in raw or minimally processed form.
What India Is Doing About It: APEDA’s Role
GOVERNMENT POSITION: the Agricultural and Processed Food Products Export Development Authority (APEDA), under the Ministry of Commerce & Industry, is the primary body promoting and regulating exports of its scheduled product list — fruits, vegetables, processed foods, meat, poultry, dairy and more (rice, spices, tea, coffee and marine products have their own dedicated boards that coordinate with APEDA). Its core functions include registering exporters, setting quality standards, funding infrastructure like pack-houses and pre-cooling units, running market-development programmes abroad, and operating residue-monitoring plans for high-risk categories like grapes and pomegranates. APEDA also promotes GlobalG.A.P. and India’s own quality certifications among farmer clusters, and pushes GI-tagging as a value-addition and traceability tool.
Since the 2018 Agricultural Export Policy, government initiatives have also included state-level export plans, cluster-based production zones for specific high-value crops, expanded accredited testing labs to reduce rejection rates, and the new ethylene-oxide sterilisation rules issued after the 2024 spice recalls.
The Biggest Red Flag May Not Be Export Decline
AITIMELINE ANALYSIS: Every red flag catalogued on this page — tariffs, West Asia risk, SPS rejections, logistics gaps, competition — is a version of the same underlying question: can India move from selling agricultural commodities to selling stable, traceable, branded, quality-certified food? A tariff shock or a shipping-lane disruption is short-term volatility; it hurts, and then (as the 2025-26 US tariff sequence shows) it can partially reverse. Weak value addition, thin cold-chain coverage and a reactive rather than pre-emptive compliance culture are structural competitiveness gaps; they do not reverse on their own, and they are the reason the same rejection pattern — pesticide residue, then a fix, then a new residue issue in a different market — keeps recurring across two decades of Indian export history. If India closes that structural gap, tariff and geopolitical shocks become manageable turbulence. If it does not, every future shock will land harder than it needed to.
Explore More Timelines
People Also Ask
Frequently Asked Questions
⚠️ Editorial Note
This article distinguishes REPORTED facts, OFFICIAL DATA (government/APEDA/Ministry sources), GOVERNMENT POSITION, ANALYST VIEW (think tanks like GTRI) and AITIMELINE ANALYSIS (our own editorial synthesis) throughout. Figures from different agricultural-export datasets (APEDA-scheduled products vs total agriculture-and-allied exports) are never combined without noting the distinction. This is editorial, AI-assisted journalism compiled from public sources and is not financial, trade or investment advice.
📚 Sources & Methodology
Compiled and fact-checked against: APEDA (export data, scheduled products, quality initiatives) · Ministry of Commerce & Industry (agri & allied trade data, India-EU FTA documents) · DGFT (rice export ban/lift notifications) · FSSAI (food-safety rules, ethylene oxide restrictions) · IBEF (compiled APEDA/Commerce Ministry export figures) · Global Trade Research Initiative (GTRI) reports on West Asia exposure and US tariff impact, cited as analyst/think-tank views, not government data · White House and PIB statements on the 2026 US-India trade deal · European Food Safety Authority (EFSA) and EU RASFF alert data on spice contamination.
Related Timelines
Sources & further reading
Every dated entry above was checked against these references. Last reviewed 20 September 2026.