US National Debt and Interest Payments: What $40.1 Trillion Actually Means
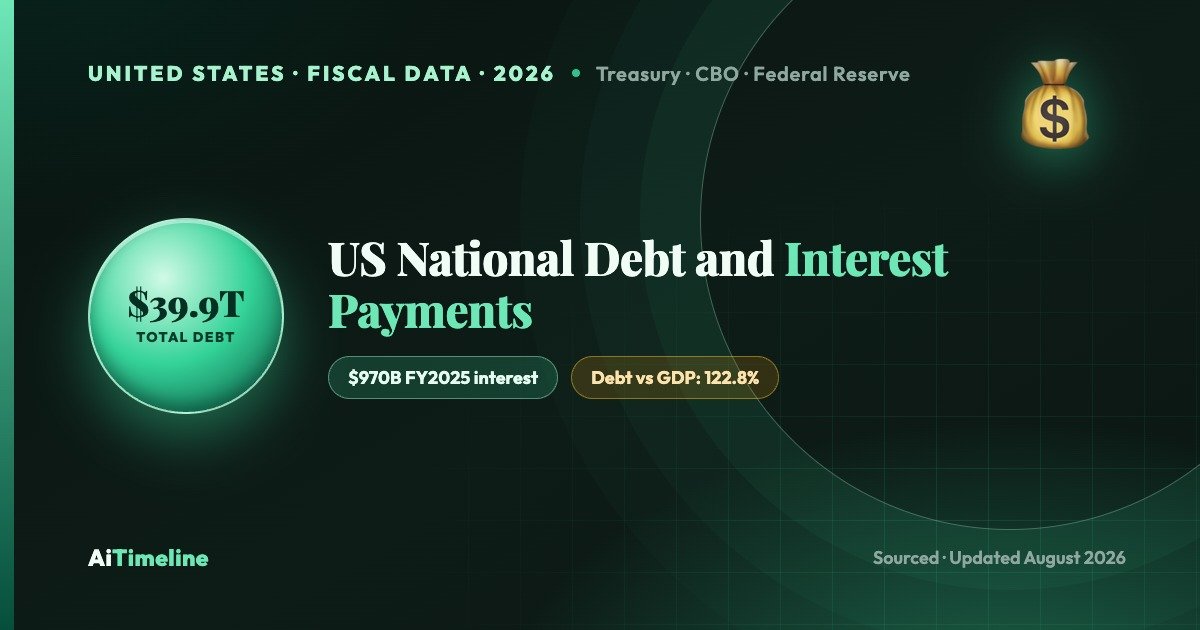
US debt hit $39.9 trillion with $970B in FY2025 interest. See why interest is rising, who owns the debt, and what CBO projects through 2036.
Latest Story
What happens when a government spends billions of dollars every day simply servicing money it borrowed years ago? As of September 17, 2026, the US national debt stands at $40.09 trillion, and the federal government is on pace to pay roughly $970 billion a year in net interest — a bill that, on a year-to-date basis in fiscal 2026, is now running larger than the entire defense budget and the entire Medicare program combined with room to spare. That is not a prediction. It is what the US Treasury’s own daily accounting already shows. This article separates what is actually happening from what might happen: verified numbers from the Treasury, the Congressional Budget Office (CBO) and the Federal Reserve, clearly dated and sourced, alongside honest explanations of why the debt is not the same thing as a maxed-out credit card — and why that distinction has limits too.
Last fact-checked: September 20, 2026, against the US Treasury’s Fiscal Data API (Debt to the Penny, Monthly Treasury Statement, Average Interest Rates), the CBO’s Budget and Economic Outlook: 2026 to 2036 (Feb 11, 2026), Treasury TIC data (foreign holders, May 2026), Federal Reserve policy records (including the September 16, 2026 FOMC rate decision), and Peter G. Peterson Foundation analysis of the August 2026 Monthly Treasury Statement. This box is designed to be updated on its own without rewriting the rest of the article — see the Methodology note near the end.
🧠 US National Debt and Interest — Quick Answer
The United States owes $40.09 trillion as of September 17, 2026 — $32.39 trillion held by outside investors and $7.70 trillion owed to federal trust funds. The government paid $970.4 billion in net interest in FY2025, a record 3.2% of GDP, and cumulative net interest for FY2026 surpassed $1 trillion for the first time in US history with 11 months of the fiscal year reported, up 8.9% year-over-year. Interest is rising because the debt itself is bigger, the average rate paid on it (3.45%) has climbed, and trillions in old low-rate debt keeps maturing into today’s higher rates. Interest is now one of the largest federal spending categories, running ahead of defense and, on a year-to-date FY2026 basis, ahead of Medicare too — a lead that widened as the fiscal year progressed. The Federal Reserve also raised its policy rate on September 16, 2026, its first hike since 2023, adding fresh upward pressure on new and refinanced Treasury borrowing. The US does not have to repay all its debt at once — it continuously refinances maturing bonds — and it borrows in its own currency, which is not true of many countries in debt trouble. That gives it real flexibility, but not unlimited flexibility: persistent large deficits, an aging population’s rising costs, and rates staying above economic growth are what CBO flags as the genuine long-term risk, not a sudden default.
Why an Ordinary American Should Care
The mechanics are simple even though the numbers are enormous. The federal government spends more than it collects in taxes most years, so it borrows the difference by selling Treasury securities — bills, notes, bonds and TIPS — to investors. Those securities carry interest, and that interest has to be paid, in cash, every year, regardless of what else is happening in the budget. As the debt grows and as interest rates rise, that interest bill grows too, and every dollar spent servicing old borrowing is a dollar not available for defense, healthcare, infrastructure or tax relief without borrowing still more. When trillions of dollars of debt issued years ago at 1–2% comes due and has to be replaced with debt at 4–5%, the government’s own borrowing costs jump even if it borrows not one dollar more than before — a dynamic explained in full below.
But government debt is genuinely not the same thing as a household maxing out a credit card, and conflating the two is the most common error in how this topic gets discussed. The US borrows in its own currency (the dollar), which it controls and which no external creditor can force it to default on for lack of dollars. Treasury securities are among the most liquid, widely held financial assets in the world — the base collateral of the global financial system, not a mark of weakness. Debt can finance genuinely productive investment, not just consumption. And a country’s ability to carry debt safely depends on several things together: the size of the debt relative to its economy, the interest rate it pays relative to how fast that economy grows, how large its underlying (non-interest) deficit is, and whether investors keep showing up to buy its bonds at reasonable rates. On every one of those measures the US is not in an acute crisis today — but on several of them, the trend line documented in this article is moving in the wrong direction, which is exactly why CBO itself flags it as the central long-term fiscal risk facing the country.
US National Debt: Key Questions
What to Know
- The debt has crossed $40 trillion. It crossed $38 trillion on October 23, 2025, $39 trillion in early 2026, and $40 trillion on August 19, 2026, reaching $40.09 trillion by September 17, 2026 (Treasury “Debt to the Penny”) — three trillion-dollar milestones in under eleven months.
- Interest is now a top-tier budget item, not a footnote. FY2025’s $970.4 billion in net interest was a record 3.2% of GDP and 13.8% of total federal spending — and it exceeded the entire defense budget that year.
- FY2026 crossed a threshold FY2025 never reached: $1 trillion in net interest. Cumulative net interest for FY2026 topped $1 trillion for the first time in US history through the first 11 months of the fiscal year (October 2025–August 2026), up 8.9% from the same period a year earlier (Treasury Monthly Treasury Statement, via Peter G. Peterson Foundation analysis).
- Three separate forces are pushing interest up together: more debt outstanding, a higher average interest rate on that debt (3.447% and rising), and old low-rate debt maturing into today’s higher rates (refinancing).
- A rate hike doesn’t reprice old debt instantly. Existing fixed-rate Treasury bonds keep paying their original rate until they mature; only new borrowing and refinanced debt pick up today’s higher rates — which is why the average rate paid (3.45%) still sits below current 10-year yields (4.65%). The Federal Reserve itself reversed course on September 16, 2026, raising its policy rate to 3.75%–4.00% — its first hike since 2023 — which will feed into new and refinanced Treasury borrowing costs going forward.
- The debt is not one giant IOU due on one date. It is thousands of individual bills, notes and bonds maturing on a rolling schedule; the government continuously “rolls over” (refinances) maturing debt rather than repaying it all at once.
- Debt-to-GDP, not the raw dollar figure, is the number economists actually watch. Gross debt-to-GDP is about 123.4%; debt held by the public (the more commonly cited economic measure) is about 99.7% of GDP.
- The debt ceiling was raised to $41.1 trillion in July 2025. With debt at $40.09 trillion as of September 17, 2026, roughly $1.0 trillion of headroom remains; nonpartisan fiscal-policy trackers (the Committee for a Responsible Federal Budget, the Bipartisan Policy Center) project, as of September 2026, that the Treasury will reach the limit sometime between late winter and mid-summer of 2027, absent further congressional action.
- CBO’s own long-term warning isn’t “debt is too big” — it’s “the interest rate the US pays could exceed the economy’s growth rate.” When that happens for a sustained period, debt-to-GDP rises on its own even without new policy choices, which is the technical definition of an unfavorable debt dynamic.
- Foreign holders own less than a third of the debt, and no single country controls it. Japan ($1.14 trillion) and China ($659 billion) are the two largest foreign holders, but the UK now holds more than China, and total foreign holdings are under a quarter of the total debt.
The US Debt in Simple Numbers
Official Treasury/CBO figures, with derived daily/monthly averages clearly labeled as math, not separate official measurements.
| Metric | Value | As of / Period | Type |
|---|---|---|---|
| Total national debt (gross) | $40,093,343,468,150 | Sept 17, 2026 | Actual |
| Debt held by the public | $32,392,786,557,372 | Sept 17, 2026 | Actual |
| Intragovernmental holdings | $7,700,556,910,778 | Sept 17, 2026 | Actual |
| Net interest expense, FY2025 (full year) | $970,358,886,994.32 | FY2025 (Oct 2024–Sep 2025) | Actual |
| Net interest expense, FY2026 (11 mo.) | ~$1.0 trillion | Oct 2025–Aug 2026, first time surpassing $1T FYTD in US history | Year-to-date |
| Gross interest expense, FY2025 (all Treasury interest paid) | ~$1.220 trillion | FY2025 | Actual |
| Derived: interest per month (FY2025 net interest ÷ 12) | ~$80.9 billion/month | Mathematical average, FY2025 | Derived |
| Derived: interest per day (FY2025 net interest ÷ 365) | ~$2.66 billion/day | Mathematical average, FY2025 | Derived |
| Interest as % of federal spending, FY2025 | 13.8% (of $7.010T outlays) | FY2025 | Derived from Actual |
| Interest as % of GDP, FY2025 | 3.2% (a record) | FY2025 | Actual (CBO) |
| Debt-to-GDP (gross debt / GDP) | ~123.4% | Debt Sept 2026 / GDP Q2 2026 | Derived |
| Debt-to-GDP (held by public / GDP) | ~99.7% | Debt Sept 2026 / GDP Q2 2026 | Derived |
Sources: Treasury Debt to the Penny, Monthly Treasury Statement, CBO Budget and Economic Outlook 2026–2036. Daily/monthly figures are AiTimeline’s own arithmetic (annual ÷ 365 or ÷ 12); Treasury does not report interest as a literal daily payment — actual interest payment dates are lumpy, tied to each security’s specific coupon schedule.
Why Interest Payments Are Rising
Three distinct forces are pushing the interest bill up at once, and it matters which one is doing the work in any given year.
1. More debt outstanding. The simplest driver: a bigger principal balance accrues more interest even at an unchanged rate, the same way a bigger mortgage costs more per month than a smaller one at the same rate.
2. A higher average interest rate on the debt. The Treasury’s own weighted average rate across all interest-bearing debt was 3.447% in July 2026, up from 3.409% in June and 3.327% in March — a rate that has been climbing steadily through 2026 as older, cheaper debt rolls off and newer debt is issued at rates shaped by the Federal Reserve’s policy stance and investor demand.
3. Refinancing maturing debt at today’s rates. This is the one most often misunderstood. A Federal Reserve rate change does not instantly reprice the trillions of dollars in Treasury bonds already outstanding — those are mostly fixed-rate securities that keep paying their original coupon until they mature, regardless of what happens to Fed policy afterward. What changes the government’s costs is new borrowing and the refinancing of maturing debt: when a bond issued in, say, 2021 at roughly 1–2% comes due, the Treasury has to sell a new bond to replace it, and that new bond carries whatever rate the market demands today — currently a 10-year yield around 4.65%. The government isn’t paying more on debt it already had; it’s paying more each time a slice of that debt gets replaced. Because a meaningful share of Treasury debt is short-term (bills maturing in a year or less), this replacement cycle runs constantly and fast, which is exactly why the average rate paid on the debt has kept climbing through 2026 even without a single new Fed rate hike since December 2025.
🔄 How Debt Can Create a Feedback Loop — Illustrative, Not a Forecast
Large deficits require more borrowing → more borrowing enlarges the debt → a bigger debt (especially at a higher average rate) increases the interest bill → a bigger interest bill widens the deficit further (interest itself is spending) → which requires still more borrowing. This is a genuine, well-understood fiscal feedback mechanism, not evidence that the US is already trapped in a “debt spiral.” Two conditions would have to hold simultaneously for that loop to become genuinely dangerous: the interest rate the government pays would need to persistently exceed the economy’s nominal growth rate (economists call this “r > g”), and the government would need to keep running large primary deficits — deficits excluding interest — rather than shrinking them. CBO’s February 2026 projections show net interest roughly doubling as a share of GDP by 2036 under current law, which is exactly why the agency treats this dynamic as the central long-run fiscal risk — but “risk to manage” and “spiral already underway” are different claims, and this article is careful not to conflate them.
US National Debt Timeline
Reverse chronological. Dollar figures for pre-2015 milestones reflect widely published Treasury/CBO historical totals for those eras; this article does not restate exact pre-2015 digits that were not independently re-verified this session.
Debt Tops $40 Trillion; Net Interest Crosses $1 Trillion for the First Time
What happened: Total debt crossed $40 trillion on August 19, 2026 and reached $40.09 trillion by September 17, 2026 (Treasury). Cumulative net interest for FY2026 topped $1 trillion for the first time in US history through the first 11 months of the fiscal year, up 8.9% from the same period in FY2025, while the Federal Reserve raised its policy rate to 3.75%–4.00% on September 16, 2026 — its first hike since 2023.
Debt Ceiling Raised to $41.1 Trillion; Interest Hits a Record 3.2% of GDP
What happened: The One Big Beautiful Bill Act (Public Law 119-21), signed July 4, 2025, raised the debt ceiling by $5 trillion to $41.1 trillion. FY2025 closed with $970.4 billion in net interest — a record 3.2% of GDP — and a $1.775 trillion deficit.
Federal Reserve Rate Hikes Begin Reshaping Debt-Service Costs
What happened: The Fed raised its policy rate from near zero to above 5% to fight inflation. Net interest expense jumped from $475.1B (FY2022) to $659.2B (FY2023) as new and refinanced debt began pricing in higher rates — the clearest real-world case of the refinancing dynamic explained above.
COVID-19 Triggers the Largest Peacetime Borrowing Surge
What happened: The CARES Act and related pandemic legislation added trillions in emergency spending; the debt surpassed $27 trillion by the end of 2020 and debt-to-GDP briefly approached WWII-era levels, even as near-zero rates kept interest costs relatively contained that year ($344.7B net interest, FY2020).
Tax Cuts and Jobs Act Widens the Structural Deficit
What happened: The Tax Cuts and Jobs Act cut the corporate rate from 35% to 21% and lowered individual rates; CBO projected roughly $1.9 trillion added to deficits over the following decade, widening the gap between revenue and spending that later required more borrowing.
Affordable Care Act Adds Long-Term Spending Commitments
What happened: The ACA expanded Medicaid and created subsidized insurance marketplaces, adding long-run federal spending commitments partly offset by new taxes and fees — a case study in how entitlement expansions, not just wars or recessions, shape the debt trajectory.
Post-9/11 Wars and the 2008 Financial Crisis
What happened: The wars in Afghanistan and Iraq were financed largely through borrowing rather than tax increases, and the 2008 financial crisis brought the $700 billion Troubled Asset Relief Program and a sharp fall in tax revenue — together roughly doubling the debt over the decade.
Reagan-Era Tax Cuts and Defense Buildup
What happened: The 1981 Economic Recovery Tax Act cut income and corporate taxes sharply while Cold War-era defense spending rose, roughly tripling the national debt over the decade — the first modern peacetime episode of deficit-driven debt growth on this scale.
World War II Pushes Debt-to-GDP to an All-Time High
What happened: Wartime borrowing and war-bond drives pushed debt-to-GDP to roughly 113% — still the historical peak — a level the postwar economy grew its way down from over the following decades, the classic case cited whenever “can growth outrun the debt?” comes up.
The Great Depression and the New Deal
What happened: New Deal public-works and relief programs, plus the creation of Social Security, expanded federal spending and established recurring long-term obligations — a template for using federal borrowing to respond to economic crises that later recurred in 2008 and 2020.
Alexander Hamilton Establishes the First US National Debt
What happened: Treasury Secretary Alexander Hamilton had the federal government assume Revolutionary War-era state debts, consolidating them to establish US creditworthiness — the founding act that created the very idea of a national debt as a tool of American governance, not a sign of failure.
Interest Payment Timeline (Net Interest, Fiscal Year)
FY2015–FY2025 are Treasury Monthly Treasury Statement actuals; FY2026 is year-to-date; 2030/2035/2036 are CBO’s own projections, not AiTimeline estimates.
| Fiscal Year | Net Interest | Status |
|---|---|---|
| FY2015 | $223.3 billion | Actual |
| FY2016 | $240.7 billion | Actual |
| FY2017 | $262.8 billion | Actual |
| FY2018 | $324.7 billion | Actual |
| FY2019 | $375.6 billion | Actual |
| FY2020 | $344.7 billion | Actual (near-zero rates offset a bigger debt load) |
| FY2021 | $352.3 billion | Actual |
| FY2022 | $475.1 billion | Actual (Fed hiking cycle begins) |
| FY2023 | $659.2 billion | Actual |
| FY2024 | $881.7 billion | Actual |
| FY2025 | $970.4 billion | Actual — record 3.2% of GDP |
| FY2026 (11 mo., Oct 2025–Aug 2026) | ~$1.0 trillion | Year-to-date — first time surpassing $1 trillion FYTD in US history, +8.9% vs. same period FY2025 (Treasury MTS) |
| 2030 | — | CBO projects debt at 108% of GDP; net interest not separately broken out in summary tables |
| 2035 | — | CBO projects debt at 118% of GDP; net interest not separately broken out in summary tables |
| 2036 | $2.1 trillion (projected) | CBO projection — 4.6% of GDP |
Before 2015, Fiscal Data’s structured API series does not extend far enough back to independently re-verify exact figures this session; net interest is well documented to have stayed under $250 billion a year for most of the 2000s and 2010s, a period of unusually low interest rates following the 2008 crisis. Source: Monthly Treasury Statement, Table 9; CBO Outlook 2026–2036.
Why a $970 Billion–$1 Trillion Interest Bill Matters
Net interest of $970.4 billion in FY2025 sits in the same league as the government’s largest single programs. On a Monthly Treasury Statement basis for that fiscal year: net interest ($970.4B, 13.8% of $7.010 trillion in total outlays) ran above national defense ($916.6B, 13.1% of outlays) and just below Medicare net outlays ($996.7B, 14.2% of outlays). Gross interest — a broader Treasury measure covering all interest paid on federal debt before netting against government interest income — ran even higher, at roughly $1.220 trillion for FY2025. These are genuinely different numbers measuring different things, and conflating “gross interest crossed $1 trillion” with “net interest crossed $1 trillion” is a common sourcing error; this article uses net interest (the Monthly Treasury Statement / CBO budget measure) as its primary metric because that is the figure comparable to defense and Medicare spending, and flags gross interest explicitly wherever it appears.
Is Interest Bigger Than Defense? Bigger Than Medicare?
Net Interest vs. Defense vs. Medicare
Net Interest vs. Medicare (Net Outlays)
📈 The FY2026 Shift
Nine months into FY2026 (October 2025–June 2026), net interest ($827.2B) had moved ahead of both defense ($713.1B) and Medicare ($780.3B) on a year-to-date basis. By 11 months into FY2026 (through August 2026), cumulative net interest had crossed $1 trillion outright for the first time in US history — a threshold the entire FY2025 total ($970.4B) never reached even across a complete year, and a genuine, sourced signal that interest’s share of the budget is still climbing, not leveling off.
Who Owns the US Debt?
Not “who owns America” — who holds the bonds, and why that distinction matters.
Of the $40.09 trillion total, $7.70 trillion (about 19%) is intragovernmental debt — money the government owes to its own trust funds, chiefly Social Security and Medicare’s Hospital Insurance trust fund, which invest their surpluses in special Treasury securities. The remaining $32.39 trillion is debt held by the public: US and foreign individuals, banks, pension funds, mutual funds, insurance companies, state and local governments, the Federal Reserve, and foreign governments and investors, all of whom hold Treasury bills, notes, bonds or TIPS (Treasury Inflation-Protected Securities) as investments — not favors to Washington, but purchases made because Treasuries are considered among the safest, most liquid assets available.
US Households, Banks & Funds
The largest bloc of debt held by the public: pension funds, mutual funds, insurers, banks and individual investors holding Treasuries directly or through funds and retirement accounts.
The Fed’s Own Holdings
The Fed holds a significant slice of Treasury debt as part of its monetary-policy operations (built up heavily during quantitative easing); it is counted within “debt held by the public” even though it is a federal institution, because it’s a market participant, not a trust fund.
Foreign Governments & Investors
$9.37 trillion in Treasuries were held by all foreign holders combined as of May 2026 (TIC data) — under a quarter of total debt, spread across dozens of countries and private foreign investors, not concentrated in any one nation.
Social Security & Federal Trust Funds
$7.70 trillion is owed by the Treasury to other parts of the federal government itself — principally the Social Security and Medicare trust funds, which by law must invest their reserves in Treasury securities.
China and Japan: How Much US Debt Do They Own?
| Holder | Treasury Holdings | As of |
|---|---|---|
| Japan | $1,143.1 billion | May 2026 (largest foreign holder) |
| United Kingdom | $948.6 billion | May 2026 (now larger than China) |
| China (mainland) | $659.3 billion | May 2026 |
| All foreign holders combined | $9,371.1 billion | May 2026 |
Japan is the single largest foreign holder of US Treasury debt, followed by the UK, with China now third among major foreign holders — a notable shift, since China was for years the largest or second-largest holder and has been steadily reducing its Treasury holdings over the past decade. Foreign governments hold Treasuries for straightforward reasons: they are a safe, liquid place to park foreign-exchange reserves, they support currency-management policy, and they are useful collateral in global finance — not primarily as leverage over US policy. China owning $659 billion in Treasuries does not mean China “owns” or controls the United States — that sum is about 1.7% of total US debt and roughly 2% of US GDP, held the same way any large institutional investor holds a government bond: for safety and yield. If a foreign holder sold Treasuries in size, the securities would need a buyer, and a rapid, large sale would more directly risk depressing the value of that holder’s own remaining reserves and disrupting a market they depend on themselves — a mutual, not one-sided, exposure that is why analysts generally treat mass foreign Treasury sell-offs as an unlikely deliberate weapon.
The Federal Reserve’s Role
The Federal Reserve is not the Treasury and does not “print money to pay the national debt” — that framing oversimplifies a more specific process. The Fed sets US monetary policy, including the federal funds rate — raised to 3.75%–4.00% by the FOMC on September 16, 2026, the Fed’s first rate hike since 2023, reversing the 3.50%–3.75% range that had held since December 11, 2025 — which influences short-term borrowing costs economy-wide, including on new Treasury issuance. Separately, the Fed buys and sells Treasury securities as part of its own balance-sheet operations — large-scale purchases (quantitative easing, or QE) during crises like 2008 and 2020, and gradual balance-sheet reduction (quantitative tightening, or QT) afterward. The Fed’s Treasury holdings are real financial assets it owns, on which it earns interest like any other holder; it does not simply cancel government debt or fund federal spending by creating money to hand to the Treasury. Its decisions do, however, shape the interest-rate environment that determines what the Treasury pays when it issues new debt — the connective tissue between Fed policy and the numbers throughout this article.
What Happens If Interest Rates Rise? What If They Fall?
If rates rise further
Existing fixed-rate Treasury bonds are unaffected until they mature — a bondholder who bought a 10-year note in 2021 still gets that note’s original rate for its full term. What changes is the cost of new borrowing and of refinancing maturing debt: both get priced at the new, higher rate. Because the government runs both a large deficit (new borrowing) and has a substantial stock of short-maturity debt (frequent refinancing), a sustained rise in rates flows into the average rate paid, and therefore into net interest, faster than many people expect — not instantly, but within a few years as the debt “turns over.”
If rates fall
The relief is not immediate either, for the mirror-image reason: the government doesn’t get to retroactively reprice debt it already issued at a higher rate down to a new lower one. New issuance and refinanced debt get the lower rate going forward, but it still takes years for that lower rate to work its way through the full stock of outstanding debt and meaningfully bring down the average rate paid — there is always a time lag in both directions, which is why interest costs tend to be “sticky” relative to headline rate-change announcements.
Refinancing Risk, Explained
🔁 The Chain: Maturity → Refinancing → New Rate → Federal Interest Cost
Debt maturity (how soon a bond comes due) determines how often it must be refinanced → refinancing means selling a new bond to replace the maturing one → the new rate on that bond is whatever the market demands today, not the old rate → multiplied across trillions of dollars of maturing debt, that new rate flows directly into next year’s federal interest cost. A government that borrows heavily short-term refinances constantly and is therefore more exposed to a rising-rate environment than one that locks in long-term, fixed-rate debt; a government that borrows mostly long-term is more insulated in the short run but pays a rate premium for that certainty. Treasury publishes its own weighted-average-maturity figures in its quarterly refunding statements; this article was unable to independently re-verify a specific current 2026 figure this session (the primary source pages returned access errors during research), so no exact current maturity figure is stated here rather than risk an unverified number — readers wanting the precise current figure should consult Treasury’s quarterly refunding statement directly.
Debt-to-GDP: Why Economists Use It
The raw debt figure ($40.09 trillion) tells you little on its own — a $40.09 trillion debt means something very different for a $32 trillion economy than it would for a $3 trillion one. Debt-to-GDP compares the debt to the size of the economy that ultimately has to service and, in a sense, “carry” it, which is why it’s the standard measure economists and rating agencies use instead of the dollar figure alone. Two versions matter and get conflated constantly: gross debt-to-GDP (all debt, including intragovernmental, divided by GDP — about 123.4% currently) and debt held by the public-to-GDP (excluding intragovernmental debt the government owes itself — about 99.7% currently), which most economists treat as the more meaningful figure because it reflects what actually has to be raised from outside investors. A country can carry high debt-to-GDP without imminent default if its growth, interest rate and primary-deficit trends are favorable — the US did so after WWII, when debt-to-GDP fell for decades even without repaying the debt, simply because the economy grew faster than the debt did. The danger sign economists watch for isn’t the level itself so much as the trend: persistent primary deficits (the deficit excluding interest payments) combined with interest rates that exceed GDP growth, which is what pushes the ratio up mechanically, year after year, regardless of policy choices in any single year.
Can America Default? Debt Ceiling Explained
A default from genuine inability to pay is considered extremely unlikely for the US, because the government borrows in its own currency and controls the mechanism (the Federal Reserve and Treasury) through which that currency is created and disbursed — a structural advantage most heavily indebted countries in default crises (which typically borrow in a foreign currency, often the dollar) do not have. The realistic default-adjacent risk is a technical default: a self-inflicted failure to pay on time caused by a debt-ceiling standoff in Congress, not by a lack of underlying resources. The debt ceiling is a statutory cap on how much the Treasury may legally borrow — it is not the same thing as the deficit (annual gap between spending and revenue) or as new spending itself: Congress separately approves spending and taxes (appropriations) that create the need to borrow, and then, in a separate step, must authorize the borrowing to actually pay bills already committed to. Raising the ceiling does not authorize new spending; it allows the Treasury to pay for spending Congress already approved. The current ceiling is $41.1 trillion, set by the One Big Beautiful Bill Act (Public Law 119-21) on July 4, 2025, a $5 trillion increase from the prior limit. With debt at $40.09 trillion as of September 17, 2026, roughly $1.0 trillion of headroom remains. Nonpartisan fiscal-policy trackers (the Committee for a Responsible Federal Budget, the Bipartisan Policy Center) project, as of September 2026, that the Treasury will reach the $41.1 trillion limit sometime between late winter and mid-summer of 2027 — a range, not a fixed date, and one that would shift with any change in the deficit’s trajectory.
US Debt Ceiling Timeline
| Episode | What Happened |
|---|---|
| 1995–96 | A budget standoff between Congress and the Clinton administration led to partial federal government shutdowns; the debt ceiling was raised after prolonged negotiation. |
| 2011 | A protracted standoff brought the US within days of the Treasury’s borrowing authority lapsing; S&P downgraded the US credit rating from AAA shortly after resolution, citing the political brinkmanship itself as a risk factor. |
| 2013 | A 16-day federal government shutdown coincided with a renewed debt-ceiling standoff, resolved shortly before the Treasury’s estimated exhaustion date. |
| 2019 | The ceiling was suspended (not raised to a fixed number) as part of a broader two-year budget deal. |
| 2021 | A short-term increase was passed after extended negotiation, followed by a larger increase later that year. |
| 2023 | The Fiscal Responsibility Act suspended the debt ceiling through January 2025 as part of a deal that also set spending caps. |
| 2025 | The One Big Beautiful Bill Act (P.L. 119-21), signed July 4, 2025, raised the ceiling by $5 trillion to $41.1 trillion. |
Market consequences of these episodes have historically included short-term Treasury-bill yield spikes and equity-market volatility around the deadline, not an actual missed payment — Congress has raised or suspended the ceiling before exhaustion in every episode to date.
What Causes the Federal Deficit?
The federal deficit is the gap between what the government spends (outlays) and what it collects (revenue) in a given year; the national debt is the accumulated total of every year’s deficits (and occasional surpluses) added together. A useful distinction within the deficit itself: the primary deficit excludes interest payments, isolating how far spending on everything else (Social Security, Medicare, Medicaid, defense, other mandatory and discretionary programs) exceeds revenue; the overall deficit adds interest back in. In FY2025, outlays totaled roughly $7.010 trillion against $5.235 trillion in revenue, for a $1.775 trillion overall deficit — of which $970.4 billion was interest, meaning the primary deficit (spending minus revenue, excluding interest) was roughly $805 billion. The overall deficit is bigger than the primary deficit specifically because of the interest bill described throughout this article — the feedback loop made concrete in one year’s numbers.
Federal Revenue vs. Federal Spending
| FY2025 (Actual) | Amount |
|---|---|
| Total federal revenue | $5.235 trillion |
| Total federal outlays | $7.010 trillion |
| — of which net interest | $970.4 billion |
| — of which national defense | $916.6 billion |
| — of which Medicare (net) | $996.7 billion |
| Overall deficit | $1.775 trillion |
| Primary deficit (excluding interest) | ~$805 billion |
Why the Debt Keeps Rising
“Why doesn’t America just stop borrowing?” is a fair question with a structural answer. A large majority of federal spending is mandatory — Social Security, Medicare and Medicaid are paid out under existing law to everyone who qualifies, growing automatically as the population ages and healthcare costs rise, without a new vote each year. Discretionary spending (defense, most other agencies) requires annual appropriation but is politically difficult to cut sharply. Interest, as this article documents, is not optional at all — failing to pay it is a default. Revenue depends on tax policy and the economy; tax cuts without matching spending cuts widen the gap, and recessions shrink revenue automatically just when spending on safety-net programs rises. Add periodic emergencies — wars, financial crises, pandemics — that require rapid deficit spending regardless of the prevailing fiscal stance, and the result is a system with strong structural momentum toward continued deficits absent a deliberate, sustained policy choice to close the gap. This article presents that as a description of the mechanism, not an endorsement of any party’s preferred fix.
What Would Reduce the Debt? Five Approaches
Spending Reductions
Cutting discretionary or mandatory spending directly narrows the deficit, but mandatory programs are large, popular and politically costly to cut; discretionary spending alone is a small enough slice that deep cuts there have limited overall deficit impact.
Revenue Increases
Raising taxes narrows the deficit directly but can weigh on growth if poorly designed, and is politically contested on both which taxes and how much.
Economic Growth
Faster GDP growth raises tax revenue without new legislation and improves debt-to-GDP even if the dollar debt keeps rising, provided growth outpaces the interest rate paid on the debt — not guaranteed, and not fully controllable by policy alone.
Lower Interest Costs
Falling market rates (via Fed policy, inflation expectations or investor demand) reduce future refinancing costs, but as explained above, relief arrives gradually as debt turns over, not immediately.
Structural Entitlement Reform
Changes to the growth rate of Social Security, Medicare or Medicaid spending have the largest long-run mathematical effect on the trajectory, precisely because those programs are the largest and fastest-growing, but are also the most politically sensitive to change.
This article presents these as the standard menu of fiscal-policy tools discussed by CBO, GAO and independent economists across the political spectrum — not an endorsement of any specific combination.
Can Economic Growth Solve the Debt?
Partly, and it’s the least politically costly lever if it works. The basic debt-dynamics arithmetic: if the interest rate the government pays is lower than the economy’s nominal GDP growth rate, debt-to-GDP can fall over time even while the primary budget runs a modest deficit — because the economy (and the tax base) is growing faster than the debt. This is what happened after WWII, when high wartime debt-to-GDP fell for decades without the debt itself shrinking in dollar terms. The catch, and it’s the one CBO flags repeatedly in its 2026 Outlook: when the interest rate paid on the debt exceeds nominal growth — the “r > g” condition — the arithmetic runs in reverse, and debt-to-GDP rises even if the primary deficit stays flat. With the 10-year Treasury yield around 4.65% and average nominal GDP growth running below that in recent quarters, the US is not currently in the favorable “g > r” zone that let growth do the work after WWII — which is why growth alone is not treated by CBO or most economists as a sufficient fix on its own, only as one lever among the five above.
Inflation and the Debt
Inflation and the debt interact in a way that’s often oversimplified into “just print money and inflate the debt away.” Unexpected inflation does reduce the real (inflation-adjusted) value of existing fixed-rate debt, because the government repays bondholders in dollars worth less than when it borrowed them — a genuine effect. But this is not a free lunch: higher inflation also pushes up the interest rate investors demand on new Treasury issuance (since investors price in expected future inflation), which raises borrowing costs on all the debt that has to be refinanced or newly issued going forward, and TIPS (Treasury Inflation-Protected Securities) explicitly adjust their principal with inflation, immunizing that portion of the debt from this effect entirely. Beyond the debt math, unexpected inflation carries its own broad economic costs — eroding real wages and savings, distorting investment decisions — that any responsible fiscal analysis has to weigh against the narrow debt-relief effect. No mainstream economist treats deliberately generating inflation as a sound debt-reduction strategy.
What This Means for You
Taxpayers
The debt doesn’t translate into “every American owes $X” as a personal bill — no one receives an invoice for their share. What it can mean, over time, is some combination of future tax changes, altered levels of government services, and less fiscal room for new spending on priorities without further borrowing. Per-capita debt figures (dividing the total debt by population) are a useful way to visualize scale, not a statement about individual liability.
Households: mortgages, loans, savings
Treasury yields are a reference point that mortgage rates, auto-loan rates and other consumer borrowing costs tend to move with, though not mechanically or one-to-one — the Fed’s policy rate and Treasury yields both feed into the broader rate environment, alongside bank-specific factors. Example: a family renewing a 30-year mortgage when the 10-year Treasury yield is around 4.65% will generally see a different offered rate than they would have at 2021’s much lower yields — a real, if indirect, channel from federal borrowing costs to household budgets. Savers, conversely, can see higher yields on Treasury-linked savings products and money-market funds when rates are elevated — the same dynamic cuts both ways depending on whether you’re borrowing or saving.
Businesses and investors
Higher Treasury yields raise the “risk-free” benchmark rate businesses and investors measure other returns against, which can raise corporate borrowing costs and make capital more expensive for expansion, hiring and investment. For investors, Treasury yields influence the discount rate used in stock valuations (higher yields can pressure valuations, all else equal) and directly determine bond-portfolio and retirement-fund returns. None of this is a prediction of a market crash; it is a description of the transmission channel, and equity markets respond to many other factors simultaneously.
The dollar and the global economy
Sustained concerns about US fiscal trajectory could, in theory, weigh on the dollar over time by affecting investor confidence in dollar-denominated assets, though the dollar’s role as the world’s primary reserve currency, deep Treasury-market liquidity and the lack of an obvious full substitute give it durable advantages that aren’t easily displaced quickly. For India and other emerging markets, US Treasury yields matter because they influence global capital flows, the relative attractiveness of emerging-market assets, and foreign-exchange dynamics; a stronger dollar (which can accompany higher US rates) tends to make imports costlier and exports more competitive for countries like India, an indirect but real channel from Washington’s borrowing costs to household budgets abroad. None of this points to an imminent dollar collapse, a claim not supported by current evidence.
Explore More Timelines
Scenario Analysis — Illustrative, Not Forecasts
Framed using CBO’s own stated assumptions where available; scenarios below are for illustration and explicitly not new AiTimeline predictions.
Illustrative scenario
Illustrative scenario
Illustrative scenario
CBO-consistent scenario
💡 Numbers Worth Knowing
- The US debt crossed $38 trillion on October 23, 2025, $39 trillion in early 2026, and $40 trillion on August 19, 2026 — three trillion-dollar milestones in under eleven months.
- The average interest rate the Treasury pays (3.447%) is still below the current 10-year yield (4.65%) — a gap that will keep narrowing as older, cheaper debt matures and rolls over.
- The Fed’s policy rate held at 3.50%–3.75% for nine straight months before its September 16, 2026 hike to 3.75%–4.00% — yet the average rate the Treasury pays kept rising every month in between, direct evidence of the refinancing effect operating independent of Fed decisions.
- The UK now holds more US Treasury debt than China does, a reversal from the picture most people still assume.
- FY2026’s deficit through 11 months ($1.97 trillion) already exceeds the full-year deficit of every year in US history before 2020.
Frequently Asked Questions
Read Next on AiTimeline
⚠️ Methodology & Editorial Note
This page tracks the US national debt using US Treasury Fiscal Data (Debt to the Penny, Monthly Treasury Statement, Average Interest Rates on Treasury Securities), the Congressional Budget Office’s Budget and Economic Outlook, Federal Reserve policy records, Treasury International Capital (TIC) data, and Bureau of Economic Analysis GDP data. Historical facts are distinguished from CBO projections and from AiTimeline’s own clearly labeled illustrative calculations throughout. The “Latest US Debt Update” box near the top is designed to be refreshed with new figures without rewriting the rest of the article. This is editorial financial journalism, compiled from public official sources, and is not investment, tax or legal advice; figures can and do change daily and this page reflects the date stated at the top. Correction policy: factual errors reported to AiTimeline’s editorial desk will be corrected promptly with the update date revised.
Sources & further reading
Every dated entry above was checked against these references. Last reviewed 20 September 2026.
- US Treasury Fiscal Data - Debt to the Penny
- US Treasury Fiscal Data - Monthly Treasury Statement
- Congressional Budget Office - Budget and Economic Outlook 2026-2036
- US Treasury - Average Interest Rates on Treasury Securities
- US Treasury TIC - Major Foreign Holders of Treasury Securities
- Federal Reserve - Open Market Operations