Black Monday 1987: Stock Market Crash & Aftermath Timeline
Black Monday, 19 October 1987: the Dow fell 22.6% in a day. The days before, the causes, the global sell-off, the Fed rescue and the circuit breakers.
Latest Story
On Monday, 19 October 1987, the Dow Jones Industrial Average fell 508 points, or 22.6%, the largest one-day percentage fall in its history. Black Monday began in Asia and Europe, swept through New York and returned to Asia and Australasia the next morning. Yet it did not cause a depression: the Federal Reserve promised liquidity before the next day’s open, the Dow won back more than half its loss in two days and set a new record by August 1989. This timeline follows the days before and after the crash, what caused it, and the circuit breakers it left behind, which in December 2026 are being stretched to cover 23-hour trading.
💡 Short Answer
Black Monday was 19 October 1987, when the Dow fell 508 points, or 22.6%, to 1,738.74 and the S&P 500 fell 20.5%. It followed a 44% rally in 1987, rising rates, dollar and trade worries and automatic selling by portfolio insurers. The Fed pledged liquidity on 20 October, the market recovered its peak in August 1989, and the crash led to the circuit breakers still used today.
Black Monday 1987: Key Questions
Black Monday in Ten Points
- Record fall: the Dow lost 508.00 points, or 22.61%, on 19 October 1987, closing at 1,738.74.
- Warning signs: it had already fallen about 10% in the three days before, including 4.6% on Friday 16 October.
- Stretched market: the Dow had risen about 44% in 1987 to a record 2,722.42 on 25 August.
- Macro worries: rising rates, a weak dollar, a worse-than-expected trade deficit and a takeover-tax bill.
- Machine selling: portfolio insurance and index arbitrage amplified the fall across futures and stocks.
- Global contagion: Hong Kong shut for four days; New Zealand eventually fell about 60%.
- Fed response: a one-sentence liquidity pledge on 20 October, plus cheaper money and pressure on banks to lend.
- Fast rebound: about 57% of the points lost were regained in two days; the record returned in August 1989.
- Reform: the Brady Report led to the first circuit breakers in October 1988, first triggered in 1997.
- 2026: the anniversary falls on a Monday again, and circuit-breaker rules are being extended to 23-hour trading from 6 December.
The Crash Week, Day by Day
Dow closing levels from the last calm day to the rebound.
| Day (1987) | Dow close | Change | What drove it |
|---|---|---|---|
| Tue 13 Oct | 2,508.16 | – | Last calm close; House takeover-tax bill filed |
| Wed 14 Oct | 2,412.70 | −95.46 (−3.8%) | August trade deficit; then a record points fall |
| Thu 15 Oct | 2,355.09 | −57.61 (−2.4%) | Funds switch to bonds; late portfolio-insurance selling |
| Fri 16 Oct | 2,246.74 | −108.35 (−4.6%) | Options and futures expiry; first 100-point day |
| Mon 19 Oct | 1,738.74 | −508.00 (−22.6%) | Black Monday |
| Tue 20 Oct | 1,841.01 | +102.27 (+5.9%) | Fed liquidity statement; near-freeze at midday |
| Wed 21 Oct | 2,027.85 | +186.84 (+10.2%) | Relief rally |
The Timeline: From the 1980s Bull Market to 2026
Newest first. Tags mark the crash and later sell-offs, the rescue, reforms, market milestones and 2026 developments.
2026
The 39th anniversary falls on a Monday again 2026
Because 1987 and 2026 both began on a Thursday and are not leap years, 19 October is a Monday in both. The anniversary arrives after a jittery week: on Friday, 16 October 2026, the Nasdaq fell 2.19%, the S&P 500 1.22% and the Dow 0.55%, amid an AI-led tech sell-off, Brent crude near $109 and firmer producer-price data. The S&P 500 had its worst week since January.
2026
US stocks move to 23-hour trading Reform
Five exchanges have conditional SEC approval to add an overnight session. The rules carry Black Monday’s main legacy into the new hours: after a Level 3 market-wide halt, trading will not resume until 4 a.m. ET the next day. Overnight trades get static price bands of 20% (approved 5 August 2026) that do not pause trading automatically, and the SEC approved the data-feed changes on 26 June 2026.
Margin debt hits a record $1.5 trillion Markets
Borrowing to buy shares reached a record in June 2026, according to FINRA. Margin debt matters in a crash because falling prices force borrowers to sell, as in 1929 and, through futures margin calls, in 1987.
2025
The tariff sell-off Sell-off
After the ‘Liberation Day’ tariff announcement of 2 April 2025, US stocks had their worst two days since 2020. No market-wide circuit breaker was triggered, because neither day’s fall reached 7% on the S&P 500. Markets recovered to record highs within months.
2020
The closest modern rival Crash
As Covid-19 spread, the S&P 500 hit the 7% circuit breaker within seconds of the opening bell, the third of four Level 1 halts that month (9, 12, 16 and 18 March 2020). The day’s 12% fall is the second-largest in the index’s history, after Black Monday. India’s market-wide circuit breaker also tripped on 13 and 23 March.
2013
Today’s 7%, 13% and 20% circuit breakers Reform
The Flash Crash of 6 May 2010, when the Dow briefly fell almost 1,000 points in minutes, showed the old Dow-based rules were out of date. Regulators moved to S&P 500 thresholds of 7%, 13% and 20% and added price bands for individual stocks.
2001
India adopts market-wide circuit breakers Reform
SEBI’s index-based system halts all equity and equity-derivative trading across India’s exchanges when either index moves 10%, 15% or 20%, up or down. It was revised in 2013. India’s market played little part in 1987, but the design follows the US idea born from Black Monday.
1997
Circuit breakers are triggered for the first time Sell-off
The Dow hit the 350-point trigger at 2:36 p.m. for a 30-minute halt, then the 550-point level shortly after reopening, ending the session. Critics said the halts caused a rush to sell before the doors closed, and in 1998 the triggers were changed to percentages of 10%, 20% and 30%.
1989
The Friday the 13th mini-crash Sell-off
Two years after Black Monday, the failure of a $6.75 billion leveraged buyout of United Airlines’ parent knocked the market down sharply late on a Friday. It did not trigger the 250-point circuit breaker, and the market steadied the following Monday.
1989
The Dow finally beats its 1987 record Markets
Exactly two years after the pre-crash peak, the Dow gained 56.53 points to a new closing high. It was the last major US index to recover all the ground lost in the crash; the S&P 500 had done so in July 1989.
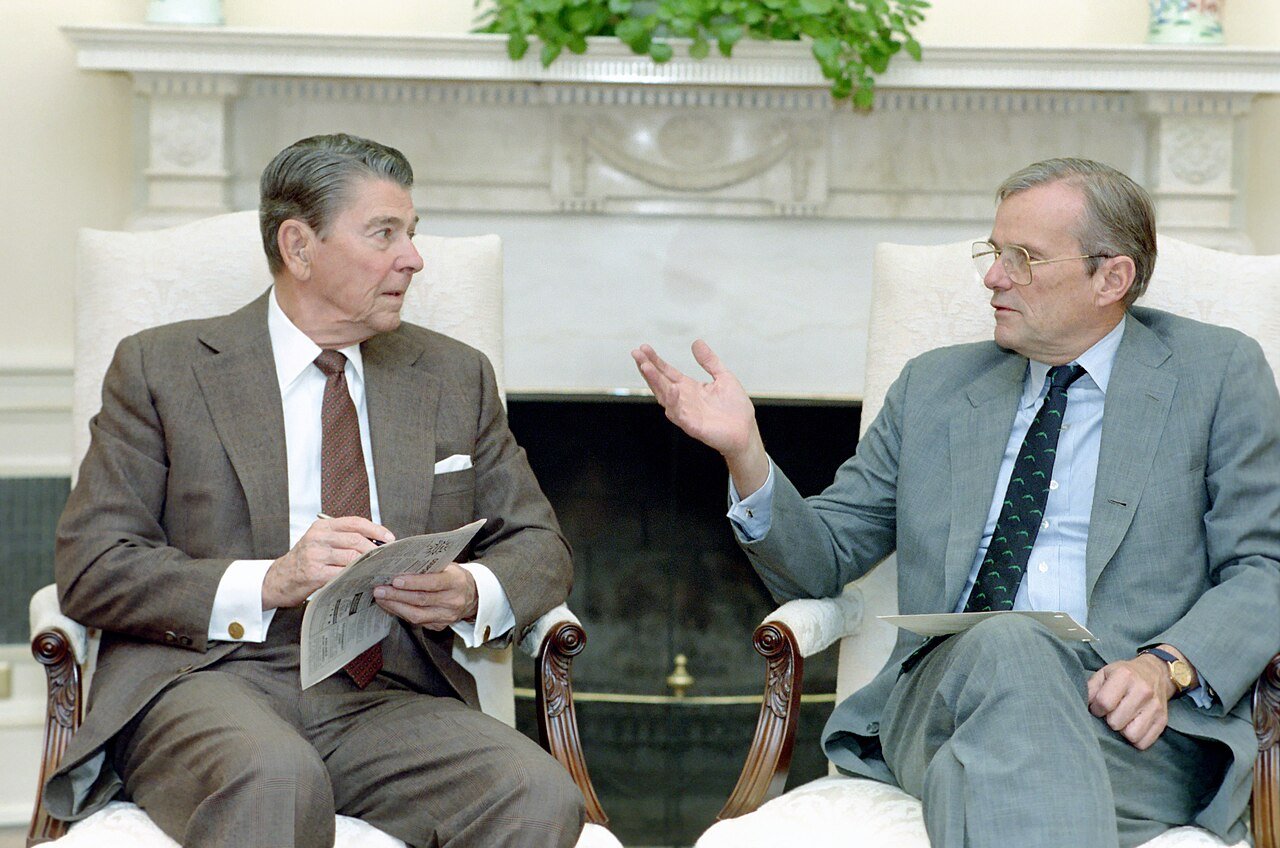
The first circuit breakers Reform
Following the Brady Report and a later presidential working group, the NYSE and futures exchanges agreed coordinated market-wide halts. Nicholas Brady, who had chaired the task force, became Treasury Secretary on 15 September 1988.
1988
The Brady Report Reform
The task force found that a few large institutions using portfolio insurance and index arbitrage had sold mechanically and in huge size, overwhelming market makers. It recommended one agency to coordinate regulation across markets, unified clearing, consistent margins, circuit breakers and better trade information.
New Zealand bottoms out 60% down Crash
After a speculative boom that followed financial deregulation, New Zealand’s market kept falling long after Wall Street steadied. Several high-profile investment companies collapsed and the economy entered a recession that lasted into the early 1990s.
1987
Hong Kong reopens and the Hang Seng falls a third Crash
Hong Kong’s exchange shut for four trading days to stop panic and to deal with unsettled futures contracts. When it reopened, the index lost a third of its value in a day. Over October Hong Kong fell 45.8% in dollar terms, the worst of any major market.
1987
The biggest rally in decades Rescue
Together with Tuesday’s rise, the Dow recovered about 57% of Black Monday’s points within two sessions. Volatility stayed extreme: the Dow fell another 156.83 points on 26 October.
1987
The Fed steps in, and ‘Terrible Tuesday’ Rescue
‘The Federal Reserve, consistent with its responsibilities as the Nation’s central bank, affirmed today its readiness to serve as a source of liquidity to support the economic and financial system.’ The Fed added reserves through open market operations and the New York Fed urged banks to keep lending to brokers: Citicorp’s lending to securities firms jumped to $1.4 billion that day from a normal $200 million to $400 million. Even so, trading nearly seized up around midday, many stocks stopped trading, and in Asia, where it was already Tuesday, Tokyo’s Nikkei fell 14.9%.
1987
Black Monday: the Dow falls 22.6% Crash
Sell orders piled up before the opening bell, and many large stocks could not open for an hour or more. Portfolio insurers sold index futures; index arbitrageurs bought those cheap futures and sold the underlying stocks, carrying the fall back to the NYSE. Prices on the exchange, the futures pits and the options market drifted apart, phones went unanswered and trade reports ran late. Selling worsened through the afternoon, and the Dow closed down 22.61%, about $500 billion wiped off US share values in a day.
1987
A bad Friday and a stormy weekend Sell-off
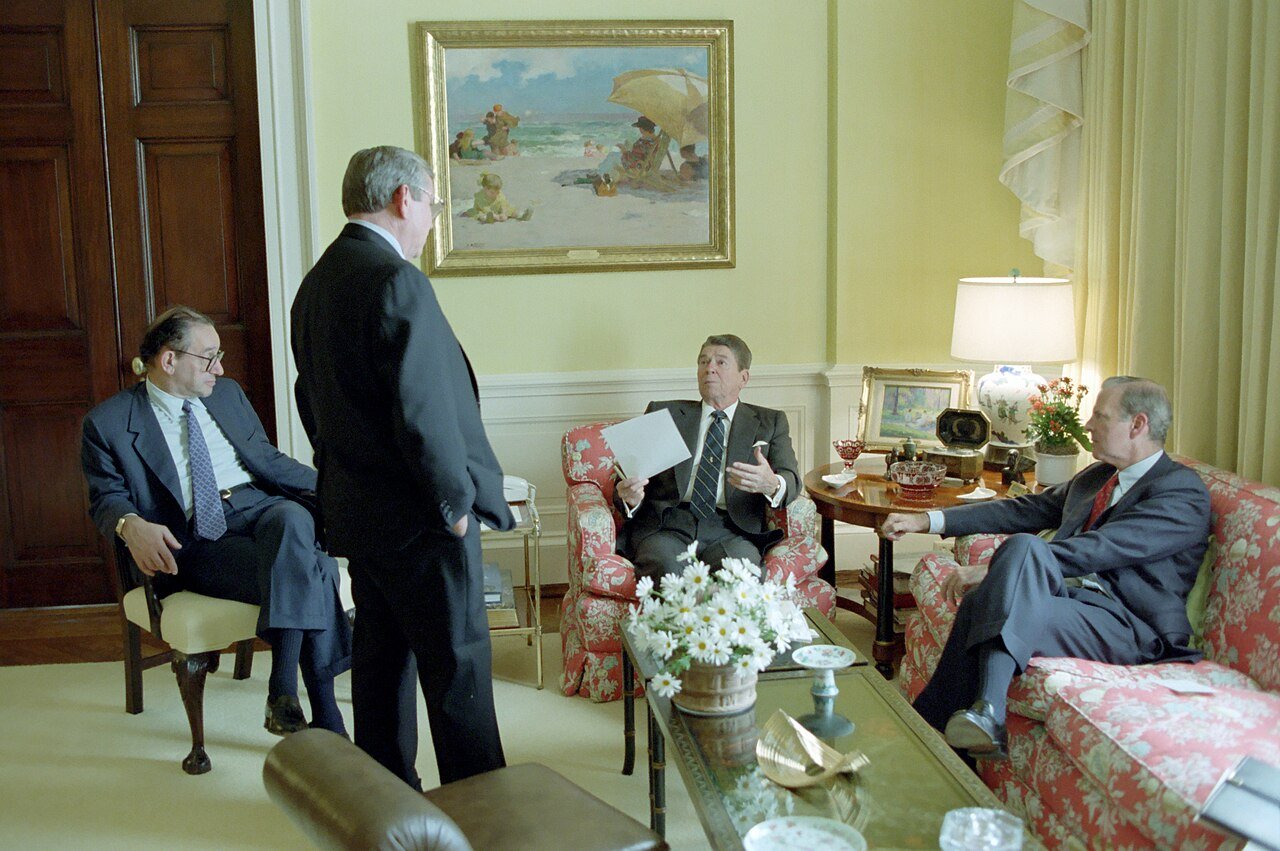
Stock-index options and futures expired on Friday, adding to selling, and the S&P 500 ended the week down more than 9%. Portfolio insurers were left with an ‘overhang’ of sales their models said they still needed to make, and mutual funds faced redemptions. Over the weekend, Treasury Secretary James Baker’s public criticism of West German interest-rate rises fed fears of a falling dollar.
1987
Trade deficit and takeover-tax shocks Sell-off
A House Ways and Means Committee bill to remove tax benefits for debt-financed takeovers hit stocks that had risen on bid speculation. The Commerce Department’s trade figures pushed the dollar down and raised expectations of tighter Fed policy, and bond yields climbed toward 10%.
1987
The bull market peaks Markets
From August 1982 the Dow had risen from 776 to more than 2,700, helped by falling inflation, tax cuts and a takeover boom. On 4 September the Fed raised its discount rate from 5.5% to 6%, Greenspan’s first rate move.
1987
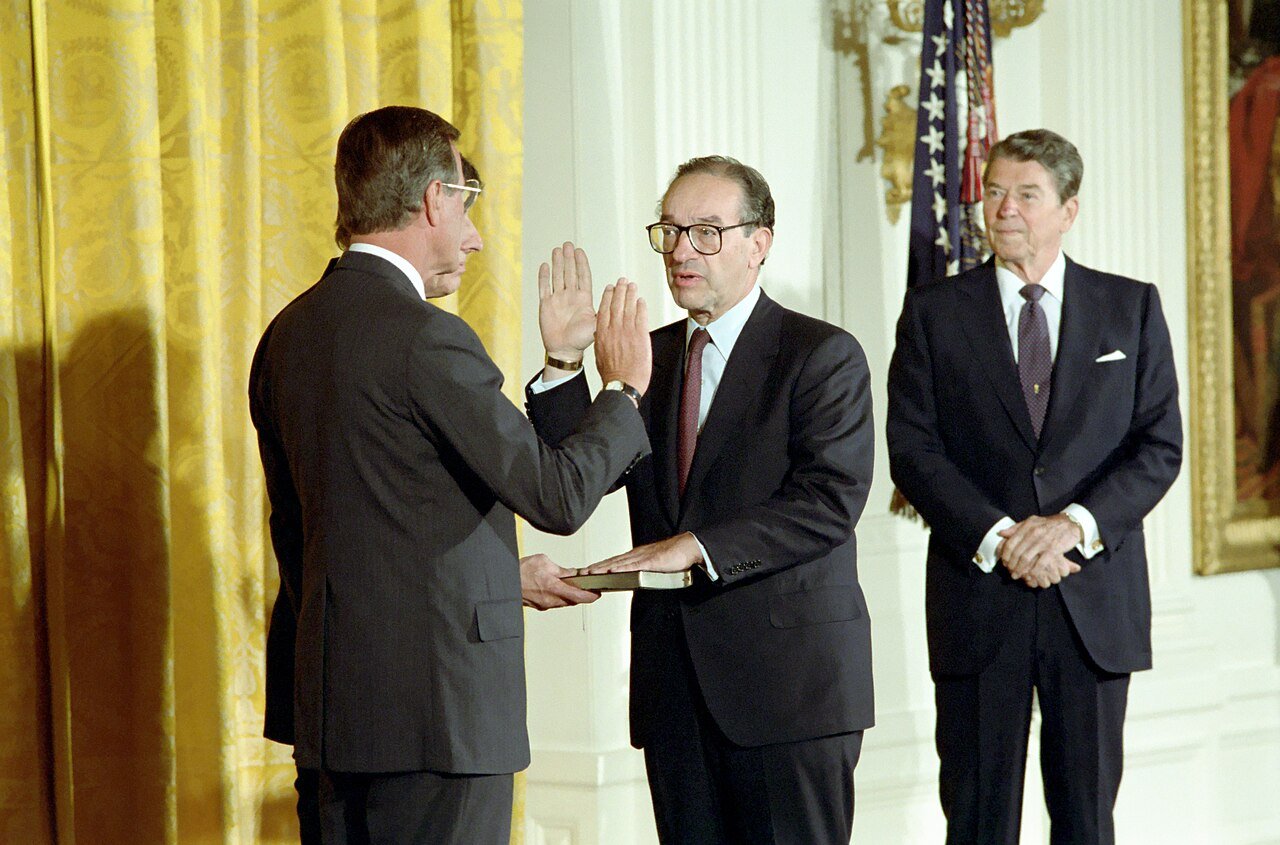
Greenspan takes over at the Fed Markets
Reagan had nominated Greenspan on 2 June 1987. The new chairman inherited rising inflation worries and a weak dollar, which the Louvre Accord of February 1987 had tried to stabilise.
1986
A five-year bull market and portfolio insurance Markets
Falling interest rates, deregulation and leveraged buyouts drove a long rally, and index futures, introduced in 1982, made it cheap to hedge whole portfolios. By 1987 tens of billions of dollars of pension money was covered by portfolio insurance, which assumed markets would move smoothly enough for its trades to be executed.
What Caused Black Monday?
Economists still argue over the weights, but most accounts combine five factors.
A rally that ran ahead of earnings
The Dow roughly tripled from 1982 to 1987 and gained about 44% in 1987 alone. With prices high and bond yields rising toward 10%, shares looked expensive next to bonds.
Dollar, deficit and rates
A worse-than-expected August trade deficit, a sliding dollar after the Plaza and Louvre accords and fears of Fed tightening all pushed in the same direction in mid-October.
The takeover-tax bill
A House Ways and Means proposal to curb tax breaks for debt-financed takeovers knocked out a support for prices: the hope that companies would be bought at a premium.
Portfolio insurance
Hedging rules told funds to sell index futures as prices fell. When many used similar rules at once, their selling pushed prices lower and triggered yet more selling.
Index arbitrage
When futures traded below the stocks they tracked, arbitrageurs bought futures and sold shares, transmitting the Chicago futures sell-off straight to the NYSE.
Systems that could not cope
Specialists ran out of capital, phone lines jammed, trade reports ran over an hour late and the stock, futures and options markets each had their own clearing systems.
It is worth separating 1987’s computer-assisted trading from today’s high-frequency trading. In 1987 the computers mostly generated large orders that were still routed to human specialists and futures pits; the problem was that many institutions followed similar rules and the markets could not absorb the volume. Modern risks are different in mechanism, but the lesson about crowded strategies under stress is the same.
The Global Impact of Black Monday
The first truly global crash of the modern era.
| Market | How it fell | Detail |
|---|---|---|
| United States | Dow −22.6%, S&P 500 −20.5% on 19 Oct | Largest one-day falls in both indexes’ history |
| Hong Kong | Hang Seng −11% on 19 Oct; −33.3% on 26 Oct | Exchange shut 20 to 23 October; −45.8% for the month in US dollars |
| Australia | About −25% on 20 Oct | Its ‘Black Tuesday’ because of the time difference |
| Japan | Nikkei −14.9% on 20 Oct | Back to pre-crash levels within about five months |
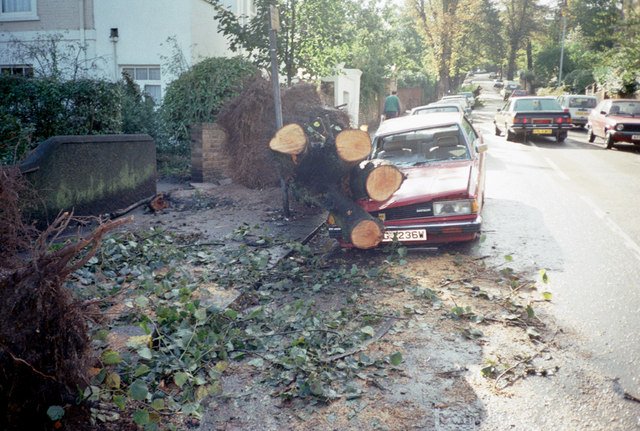
| United Kingdom | FTSE 100 −10.8% on 19 Oct, −12.2% on 20 Oct | Exchange closed the previous Friday by the Great Storm |
| New Zealand | About −15% on day one | About 60% below peak by February 1988 |
| Worldwide | 19 of 23 major markets fell more than 20% in October | About $1.7 trillion lost, by later estimates |
Because markets open in sequence, the crash moved around the world in both directions. Hong Kong and several European markets fell on the morning of 19 October before New York opened, and after Wall Street’s collapse it was already Tuesday in Tokyo, Sydney and Wellington. Hong Kong’s four-day closure, intended to calm panic, mostly delayed it, and the government had to support the futures exchange’s guarantee fund.
How the Federal Reserve Stopped a Crash Becoming a Crisis
The Fed’s main fear was not falling prices but a chain of defaults. Brokers and specialists had to pay huge margin calls to clearing houses; if banks refused them credit, a solvent firm could fail for lack of cash and take others with it. The statement issued before the open on 20 October told markets the Fed would supply cash. Behind it, the Fed added reserves through open market operations, letting the federal funds rate fall from above 7.5% to about 7%, and the New York Fed’s president, Gerald Corrigan, called bankers to urge them to keep lending. The 10 largest New York banks nearly doubled their lending to securities firms that week.
The approach became a template, sometimes called the ‘Greenspan put’ by critics who argued it encouraged risk-taking. Unlike 1929, the banking system stayed intact and the US economy kept growing through 1988 and 1989.
Pick a crash day to see its S&P 500 fall, what today’s 7%, 13% and 20% rules would do, and what actually happened.
Falls are the S&P 500’s closing change. Today’s halts are triggered intraday, so a day that recovered later could still have halted; Level 1 and 2 halts apply only before 3:25 p.m. ET.
The Legacy: Circuit Breakers and Better Plumbing
How the halt rules have changed since 1988.
| Year | Trigger | Halt |
|---|---|---|
| 1988 (NYSE Rule 80B) | Dow falls 250 / 400 points | 1 hour / 2 hours |
| 1997 | Dow falls 350 / 550 points | 30 minutes / close for the day |
| 1998 | Dow falls 10% / 20% / 30% | Length depends on time of day; 30% closes the market |
| 2013 to now | S&P 500 falls 7% / 13% / 20% | 15 minutes / 15 minutes / close (Levels 1 and 2 only before 3:25 p.m.) |
| From 6 Dec 2026 | Same levels, 23-hour trading | After a Level 3 halt, no trading until 4 a.m. ET next day |
| India (since 2001, revised 2013) | Sensex or Nifty moves 10% / 15% / 20% | Halts that shorten later in the day; 20% closes the market |
Beyond halts, the reforms after 1987 included faster trade reporting, NYSE limits on program trading through its DOT system on volatile days (Rule 80A, scrapped in 2007), coordination between the SEC and the futures regulator, and closer attention to how clearing houses and margin calls spread stress. Portfolio insurance as a product largely disappeared, though its logic lives on in other strategies that sell as prices fall.
Enter an amount and pick when it went into the Dow to see what it was worth on Black Monday, two days later and in August 1989.
Based on Dow closing levels only: no dividends, fees or inflation. Works for any currency.
Black Monday vs the 1929 Crash
October 1987 vs October 1929
Black Monday in 2026: The Anniversary and the 23-Hour Market
The 39th anniversary on Monday, 19 October 2026, lands on the same weekday as the original, because 1987 and 2026 share a calendar. It also follows a nervous week, with the Nasdaq down more than 4% on an AI-led sell-off, oil near $109 a barrel and inflation worries back. Margin debt reached a record $1.50 trillion in June, according to FINRA. None of that makes a repeat likely; today’s halts would interrupt a fall of Black Monday’s size three times before it finished.
The bigger structural change comes on 6 December 2026, when five US exchanges plan to start overnight trading, making stocks tradable 23 hours a day on weekdays. The rule-makers have carried 1987’s lessons into the new hours: market-wide halts still apply, a Level 3 halt still ends trading until 4 a.m. ET the next day, and overnight trades get 20% price bands. How those rules behave in a real overnight panic has not yet been tested.
Lessons from Black Monday
- Crashes can come in a single session: almost a quarter of the Dow’s value went in six and a half hours.
- Crowded strategies are a risk: hedges that work for one fund can fail when everyone uses them.
- Liquidity is the danger point: sellers could not find buyers at any reasonable price on 19 October.
- Diversification has limits: almost every major stock market fell together.
- Central-bank action matters: the Fed’s fast pledge helped keep a market crash from becoming a banking crisis.
- Safeguards buy time, not certainty: circuit breakers pause trading but cannot guarantee prices recover.
Explore More Timelines
People Also Ask
Frequently Asked Questions
Conclusion: The Crash That Built Today’s Safeguards
Black Monday showed how a market that had become global and computer-assisted could fall faster than people or systems could respond. Its outcome, a fast recovery rather than a depression, owed much to a central bank that moved within hours and a banking system that held.
Thirty-nine years on, its circuit breakers are being extended into a 23-hour market. They cannot prevent crashes, but they are designed to make sure no one again has to watch a 22.6% fall happen in a single uninterrupted session.
Related AiTimeline Stories
⚠️ Editorial Note
This timeline draws on Federal Reserve History’s essay on the 1987 crash, Mark Carlson’s Federal Reserve Board paper ‘A Brief History of the 1987 Stock Market Crash’ (2007), the Brady Report (1988), the Chicago Fed’s 1998 review of circuit breakers, SEBI’s 2001 circular, FINRA margin statistics, SEC and exchange filings on 23-hour trading and contemporary market reports for October 2026. Index figures are closing levels unless stated; international falls vary by index and measurement period. This article is historical and educational and is not investment advice.
Sources & further reading
Every dated entry above was checked against these references. Last reviewed 18 October 2026.
- Stock Market Crash of 1987
- A Brief History of the 1987 Stock Market Crash with a Discussion of the Federal Reserve Response (Mark Carlson, FEDS 2007-13)
- Report of the Presidential Task Force on Market Mechanisms (Brady Report, January 1988)
- Circuit breakers and market volatility (Chicago Fed Letter, July 1998)
- Index based market wide circuit breaker in compulsory rolling settlement (28 June 2001)
- Equity market circuit breakers
- Margin statistics
- NYSE American rule change on Level 3 market-wide circuit breaker resumption for 23x5 trading (SR-NYSEAMER-2026-83)
- 23x5 Trading Comes to US Exchanges: What Firms Should Know Before Launch (29 September 2026)
- 'Black Monday' fears intensify as prediction markets shrug off 2026 crash (18 October 2026)