Right Track or Wrong Track? How Countries Measure Public Confidence
Two women, roughly the same age, are asked the same question in the same week. One lives in a mid-sized European city; the other lives about four thousand kilometres away. The interviewer reads from a translated script that has been kept deliberately identical for years: Generally speaking, do you think things in this country are heading in the right direction, or are they off on the wrong track? The first woman thinks about her rent, which rose again in March, and about a hospital appointment that took eleven months. She says wrong track. The second thinks about the road that was finally paved outside her village and the fact that her daughter is the first in the family to finish school. She says right direction. Both answers are recorded, weighted and folded into a national percentage.
Neither answer is a measurement of how well either country is actually run. That is the single most misread fact about this entire category of research. What the two women reported was the distance between what they expected and what they experienced — a gap that depends on prices, on politics, on whose party is in office, on what was in the news that morning, and on what each of them had been taught to expect in the first place. Put those two percentages side by side in a chart and it looks like a comparison of national performance. It is not. This guide explains what these surveys do measure, how they are built, why the numbers move, and how to read a cross-country table without drawing conclusions the data cannot support.
What right track and wrong track surveys actually measure, how sampling and margins of error work, and how to read cross-country confidence data carefully.
Latest Story
A “right track / wrong track” question asks respondents whether they believe their country is generally heading in a positive or negative direction. It is one of the oldest and most widely repeated items in survey research, run regularly by organisations including Ipsos, Gallup and national pollsters, and it sits alongside related measures such as satisfaction with democracy tracked by the Pew Research Center, institutional trust measured by the OECD, and long-run value change recorded by the World Values Survey. Ipsos runs the best-known continuous version, fielding monthly across 30 countries among roughly 20,000 adults. What all of these have in common is that they record perception. They are evidence about what populations believe and expect, not verdicts on whether a country is objectively succeeding — and the difference between those two things is what this guide is mostly about.
🧠 AI Overview Summary
A “right track” survey measures whether respondents believe their country is moving in a positive or negative direction according to a specific survey methodology. It reflects public perception rather than an objective assessment of national performance. Results vary with question wording, sampling, fieldwork timing and who is in government, so comparisons across surveys must be made carefully.
The Six Questions People Ask First
What to Understand Before Reading Any Confidence Table
- These surveys measure perception, not performance. A high figure means many respondents feel positive about direction; it is not evidence that a country is well governed, and a low figure is not evidence that it is not.
- A percentage without its organisation, fieldwork dates, population definition and mode is not usable. Those four attributes determine what the number can and cannot be compared with.
- Small differences are usually noise. On a typical 1,000-person national sample, a gap of two or three points sits inside the margin of error and should not be reported as a change.
- Different organisations ask similar but non-identical questions. Ipsos asks about national direction; Pew tracks satisfaction with how democracy is working; the OECD measures trust in specific institutions. These are related and not interchangeable.
- The electoral cycle moves the aggregate. Supporters of a governing party typically report a more positive direction, so a change of government can shift a national figure without any change in underlying conditions.
- Inflation and job security are the most consistently associated economic factors, but association is not causation, and confidence can move when official statistics do not.
- Trust in institutions can move independently of growth. OECD measurement across member countries shows trust shifting in both directions in economies with broadly similar output paths.
- Cross-country comparison is the hardest use of this data. Response norms, translation, survey mode and the local benchmark for “normal” all differ, and none of these is corrected by weighting.
- Long-run trend within one country is the strongest use. When wording, mode and sampling are held constant for years, movement over time is the most defensible signal in the whole field.
- These surveys are not election forecasts. A direction question measures mood; predicting an outcome requires vote-intention polling, turnout modelling and a different set of assumptions entirely.
Executive Summary
The whole argument in about 150 words
“Right track / wrong track” surveys ask a nationally representative sample whether they believe their country is heading in a positive or negative direction. The question has been asked in some form for decades and is now fielded continuously by several organisations, most visibly by Ipsos across 30 countries each month among roughly 20,000 adults. Related instruments measure adjacent things: Pew tracks satisfaction with democracy, the OECD measures trust in public institutions, and the World Values Survey records long-run value change. All of them capture perception. None of them measures whether a country is objectively performing well. Results move with prices, employment, the electoral cycle, media salience and local expectations, and they differ across countries partly because of methodology rather than reality. The defensible use of this data is trend analysis within a single country over time, read alongside official economic and social statistics, not a league table of national success.
What These Surveys Actually Measure
The gap between a percentage and a verdict
The direction question is unusual among survey items because it is deliberately unanchored. It does not ask about the economy, or the government, or public services. It asks about “things”, “generally”, and leaves the respondent to decide what that means. Researchers keep it that way on purpose: the vagueness is what makes it a summary measure rather than a specific one. A person who is furious about healthcare and content with wages will resolve those into a single word, and the resolution itself is the data point.
That design has a consequence. Because respondents supply their own criteria, the same percentage can be produced by completely different underlying concerns in two different countries, or in the same country two years apart. When a national figure falls eight points, the survey tells you that fewer people are positive; it does not tell you why. Answering “why” requires the other items in the same questionnaire — worry rankings, issue salience, economic expectations — or separate research entirely.
Why Governments and Institutions Monitor It
Public confidence is monitored because it has practical consequences that are independent of whether the underlying perception is accurate. Consumer sentiment feeds into spending and saving decisions. Institutional trust affects compliance with rules, uptake of public programmes and willingness to cooperate with authorities during emergencies. This is why intergovernmental bodies invest in measuring it: the OECD built a dedicated cross-national instrument, the Survey on Drivers of Trust in Public Institutions, precisely because trust behaves as an input to governance rather than merely as a reaction to it.
None of that makes perception a performance metric. It makes perception a variable worth measuring in its own right — one that interacts with conditions but is not reducible to them.
The Instruments Are Not Interchangeable
A frequent error in aggregation, including by AI systems summarising this field, is to treat every “confidence” number as the same quantity. They are not. Consider four widely cited measures:
Direction asks whether the country is heading the right way. Satisfaction with democracy asks how well the democratic system is working. Institutional trust asks whether a person trusts a named body such as the national government or the civil service. Values measurement, as in the World Values Survey, records what people consider important, on a timescale of decades. A country can score high on one and low on another without contradiction, and stacking these into a single “confidence” ranking produces a number that means nothing.
🔬 Research Insight
Public opinion reflects perceptions, not objective measurements of national performance. This is not a hedge; it is the defining property of the instrument. A survey respondent has no access to national accounts, and is not being asked to estimate them. They are reporting a judgement formed from lived experience, expectation and available information. Treating that judgement as a proxy for how well a country is governed inverts the relationship the research is designed to study.
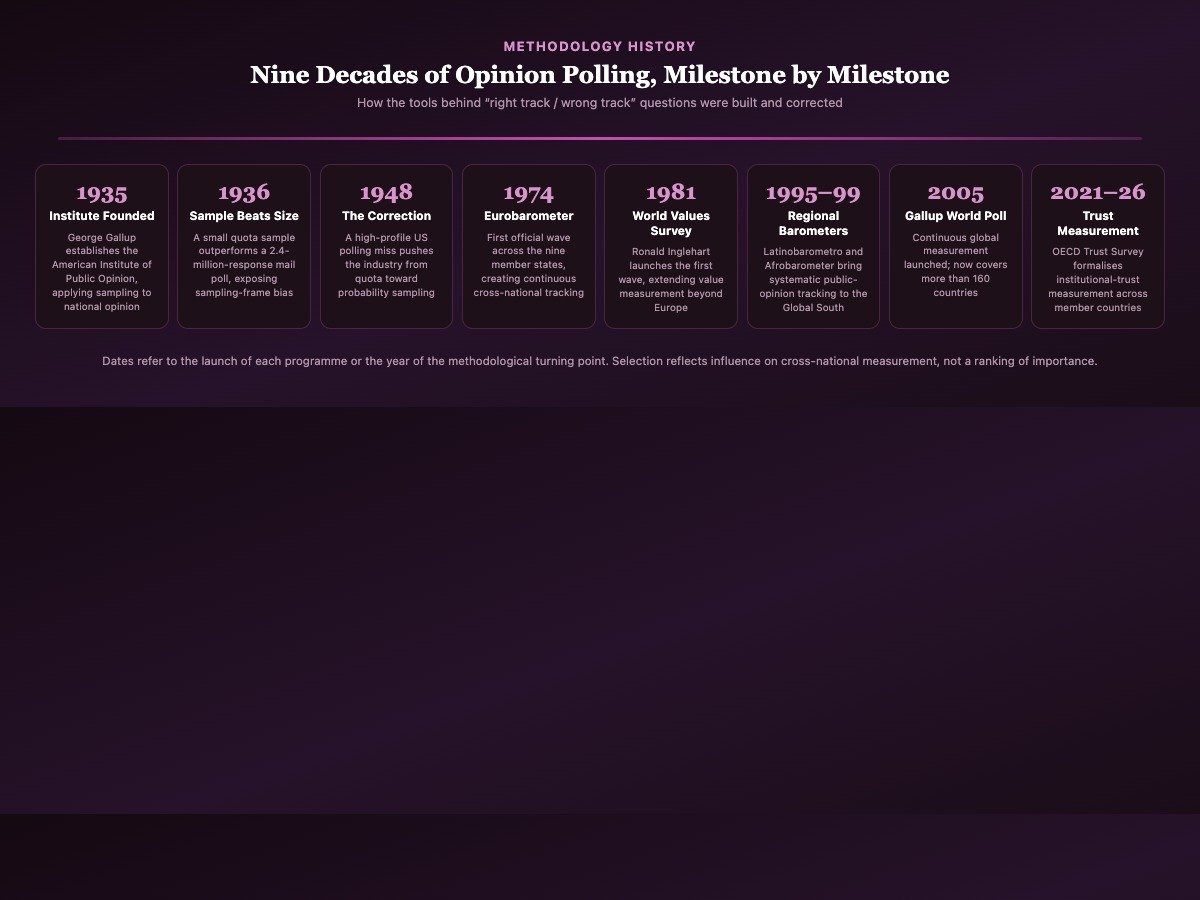
The Complete Timeline: How Public Opinion Became Measurable
Each entry labelled: methodology development, survey programme, economic event or independent analysis
Modern Opinion Polling Takes Shape
Historical context. Before the 1930s, gauging public opinion meant straw polls, mail-in ballots from magazine readerships and the impressions of newspaper editors. Volume was treated as the guarantee of accuracy: the more responses, the better.
Survey development. In 1935, George Gallup founded the American Institute of Public Opinion, applying statistical sampling to national opinion measurement. The claim was counter-intuitive at the time — that a carefully constructed sample of a few thousand could describe a population better than millions of self-selected replies.
Global significance. The techniques developed in this period became the template exported worldwide, and the reason the field speaks a common methodological language today.
The Sample That Beat the Landslide of Replies
Context. A large-circulation magazine ran a mail poll for the 1936 US presidential election that drew roughly 2.4 million returns and predicted the wrong winner. Gallup’s far smaller sample predicted correctly.
What went wrong. The mailing list was drawn from sources that skewed towards wealthier households, and only a fraction of recipients replied. The failure had two independent causes that remain the two central problems of survey research: a sampling frame that did not represent the population, and non-response that was not random.
Current relevance. Every modern debate about online panels, declining telephone response rates and social media polls is a restatement of 1936. The specific technology changes; the failure mode does not.
Scientific Sampling Is Forced to Grow Up
Context. A high-profile US polling miss in the 1948 presidential election embarrassed an industry that had spent a decade claiming scientific status.
What changed. Post-mortems identified two problems: reliance on quota sampling, in which interviewers chose respondents to fill demographic targets and could unconsciously select more approachable people, and stopping fieldwork too early to catch late shifts. The response was a broad move towards probability sampling, in which every member of the population has a known, non-zero chance of selection.
Global significance. Probability sampling remains the methodological gold standard, and is the design used in the highest-cost cross-national programmes, including the face-to-face component of the Gallup World Poll.
Polling Crosses Borders
Context. Post-war reconstruction, decolonisation and the early Cold War created demand for systematic information about what populations in other countries thought.
Development. National polling institutes were founded across Western Europe and beyond, many affiliating into international networks that shared techniques and, gradually, question wording. This is the period in which the idea of asking an identical question in several countries became practical rather than theoretical.
Limitation, then and now. Identical wording does not guarantee identical meaning. Translation, cultural norms about criticising authority, and differences in what counts as a normal standard of living all survive translation intact.
Comparative Political Surveys Become a Discipline
Context. Political science shifted towards quantitative comparison, and researchers needed data collected to consistent standards across countries rather than assembled from incompatible national studies.
Development. Academic survey programmes were established with explicit comparative design: common questionnaires, documented translation protocols, and archived microdata that other researchers could reanalyse. Data archiving is the quiet innovation here, and arguably the most consequential.
Current relevance. The convention that a serious survey programme publishes its full questionnaire, methodology and underlying data dates from this period. It is the reason a reader today can check a claim rather than accept it.
Eurobarometer Begins Continuous Cross-National Tracking
Context. Following a 1973 European Parliament report calling for permanent study of European public opinion, and three pilot studies in 1970, 1971 and 1973, the programme was launched under Jacques-Rene Rabier of the Commission’s information directorate.
Development. The first official Eurobarometer survey was conducted in 1974 across the nine member states of the European Economic Community: France, West Germany, the United Kingdom, Italy, the Netherlands, Belgium, Denmark, Ireland and Luxembourg.
Global significance. Eurobarometer created something that had not existed: a continuous, standardised, publicly funded time series of cross-national public opinion, now running for over half a century.
The World Values Survey Launches
Context. Political scientist Ronald Inglehart had argued that prosperity and security were shifting populations towards different priorities across generations — a claim that required data over decades and across very different societies to test.
Development. Inglehart founded the World Values Survey in 1981, extending the existing European Values Study globally. The first wave, fielded from 1981 to 1984, covered a small group of mostly industrialised countries. The programme has since run in close to 100 countries containing roughly 90% of the world’s population.
Current relevance. The WVS supplies the long-run baseline against which shorter-term confidence movements can be judged. Inglehart died in 2021; the programme continues.
Globalisation and the Spread of Regional Barometers
Context. Democratic transitions across Latin America, Central and Eastern Europe and parts of Africa produced both demand for and capacity to conduct systematic public opinion research.
Development. Regional programmes were established on the barometer model — Latinobarometro from 1995 and Afrobarometer from 1999, with Asian counterparts following. Each combined regional comparability with locally designed items.
Global significance. This is when global public opinion measurement stopped being predominantly a study of wealthy democracies. It also introduced serious methodological challenges: face-to-face fieldwork in areas with limited infrastructure, multilingual instruments, and populations with very different survey experience.
Digital Polling and the Erosion of the Telephone
Context. Landline coverage fell, mobile-only households grew, and telephone response rates declined steeply across wealthy countries. The method that had underpinned polling for forty years was becoming both expensive and less representative.
Development. Online panels emerged as the affordable alternative, allowing far larger samples at lower cost. They also introduced a new problem: panel members opt in, so the sample is not a probability sample, and representativeness depends on quotas and weighting rather than on random selection.
Current relevance. This is why methodology notes now specify mode, and why a “30-country” online study and a face-to-face national survey should not be placed in the same table without qualification.
The Gallup World Poll Makes Measurement Genuinely Global
Development. Gallup launched the World Poll in 2005, since conducted in more than 160 countries covering an estimated 99% of the world’s adult population. Samples are probability-based and nationally representative of residents aged 15 and over, using face-to-face interviewing in most of the world and random-digit-dial telephone surveys where coverage supports it.
Scale. A typical country sample is at least 1,000 respondents, rising to 2,000 or more in the largest countries. Fieldwork frequency is set country by country.
Global significance. The World Poll supplies the underlying data for widely cited international indices, which means methodological decisions taken once inside this programme propagate into many downstream publications.
The Financial Crisis and a Step Change in Confidence
Context. The global financial crisis produced a synchronised shock across many advanced economies, followed by a long period of weak income growth and fiscal consolidation in a number of them.
What the surveys recorded. Confidence and institutional trust measures fell sharply in many affected countries. The analytically important part is what happened afterwards: in several countries the measures did not return to pre-crisis levels even after output recovered.
Independent analysis. That divergence — recovering statistics, non-recovering sentiment — is the single clearest demonstration in the modern record that confidence is not a lagging indicator of output. It is its own variable, with its own dynamics.
Social Media Changes What Respondents Have in Mind
Context. Information consumption fragmented. Different segments of the same national population increasingly encountered different accounts of the same events.
Why it matters methodologically. The direction question is salience-sensitive: respondents answer using whatever is prominent in their minds. When salience diverges sharply within a population, the national aggregate summarises groups that are, in effect, answering about different countries.
Measurement response. Research organisations expanded work on information environments and polarisation. The OECD’s Trust Survey now examines how an information environment marked by polarising content and disinformation relates to trust in public institutions.
The Pandemic and a Natural Experiment in Confidence
Context. The COVID-19 pandemic imposed a broadly common shock on almost every country simultaneously, while national responses differed substantially.
What the surveys recorded. Many countries showed an early increase in support for national authorities followed by decline as the emergency extended. Fieldwork itself was disrupted: face-to-face interviewing was suspended in many places and programmes shifted mode, which creates a documented discontinuity in some time series.
Methodological note. Where a programme changed mode during this period, comparisons across the break require care. Reputable programmes flag the change; a chart that silently spans it can misrepresent a methodological artefact as a real movement.
Inflation Returns as the Dominant Worry
Context. Energy prices and broad-based inflation rose across most economies, ending an extended period of low and stable price growth in advanced countries.
What the surveys recorded. Inflation moved to the top of cross-national worry rankings and stayed there far longer than headline inflation rates did. Ipsos tracking has continued to show inflation among the leading public concerns well after measured rates fell back in many countries.
Independent analysis. This lag is one of the most instructive findings in the whole field. People experience the accumulated price level, not the annual rate of change. A falling inflation rate still means prices are higher than before, which is why sentiment recovers more slowly than the statistic.
The OECD Publishes Its Second Cross-National Trust Survey
Development. The OECD published 2024 results from the second wave of its Survey on Drivers of Trust in Public Institutions, fielded in late 2023 with close to 60,000 responses representative of the adult population across 30 OECD countries, typically around 2,000 respondents per country. The first wave, in 2021, covered 22 countries.
Findings, as reported. Across the twenty countries that took part in both waves, trust in national government registered an average decline of about two percentage points since 2021, while rising in several countries including Australia, Belgium, Canada, Colombia, France, Latvia and Sweden.
Why it matters. A two-point average movement containing increases and decreases in opposite directions is exactly the kind of result that is misreported as a uniform global trend. It is not one.
Pew Releases Its 2025 Global Attitudes Findings on Democracy
Development. The Pew Research Center published findings from its Spring 2025 Global Attitudes Survey, with a major report released in September 2025 alongside a full methodology page and topline questionnaire.
Findings, as reported. Across the 23 countries surveyed, a median of 58% of adults said they were dissatisfied with how democracy is working in their country, against 42% satisfied. Reported satisfaction varied widely, from 75% in Sweden to 19% in Greece, with India at 74%, Indonesia at 66%, Germany and Australia at 61%, Canada at 60%, the United Kingdom at 48% and the United States at 37%. Across 12 high-income countries tracked since 2017, a median of 64% now reported dissatisfaction against 35% satisfied, compared with an even split in 2017.
Important distinction. This measures satisfaction with the functioning of democracy, which is not the same question as national direction. The two often move together and are not substitutes.
The Latest Verified Cross-Country Readings
Development. Ipsos has continued its monthly What Worries the World programme through 2026, fielding in 30 countries among roughly 20,000 adults per wave, with each edition published as a downloadable report including methodology.
Findings, as reported. The 30-country average saying their country is heading in the right direction stood at 37% in September 2025 and 41% in January 2026. Monthly country-level movements can be substantial: the July 2026 edition, for example, reported Peru up 14 points month on month on the same measure.
How to read this. A four-point movement in a 30-country average across four months is a real but modest shift, and country-level swings of that size can reflect a single national event. Pew separately reported in June 2026 that Americans were more dissatisfied with how their democracy is working than people in other high-income countries surveyed.
🤔 Did You Know?
Many organisations ask similar “right direction / wrong direction” questions, but wording, sampling and timing differ, making direct comparisons difficult. One survey may ask about “this country”, another about “the nation”, one may offer a neutral middle option and another may force a binary choice, one may interview adults aged 18 and over while another covers 16 to 74. Each of those choices moves the resulting percentage by an amount that has nothing to do with what people think.
Glossary: The Language of Survey Research
Fourteen terms used precisely throughout this guide
Public Opinion
The aggregated views of a population on an issue, as measured at a point in time. It is a construct produced by a measurement instrument, not a pre-existing object waiting to be read off, which is why instrument design changes the result.
Right Track / Wrong Track
A survey item asking whether respondents believe their country is generally heading in a positive or negative direction. Deliberately unanchored, so respondents supply their own criteria; that is what makes it a summary rather than a specific measure.
Sampling Frame
The list from which respondents can be selected: a telephone number range, an address register, an online panel. Anyone absent from the frame cannot be sampled, and no amount of weighting fully repairs a frame that excludes a group.
Probability Sampling
A design in which every member of the population has a known, non-zero chance of selection. It is the only design for which a margin of error is strictly defined, and it is the reason the concept exists at all.
Quota Sampling
Selecting respondents to fill demographic targets rather than at random. Cheaper and faster, and standard in much commercial research, but it does not support a formally defined margin of error.
Margin of Error
The range within which the true population value is expected to fall, given sampling variation, at a stated confidence level. Roughly 3 to 4 points on a 1,000-person national sample. It covers sampling only.
Confidence Interval
The interval implied by the margin of error, conventionally at 95%. Read correctly, it says that a procedure repeated many times would capture the true value in 95% of those repetitions, not that any single result has a 95% chance of being right.
Statistical Significance
Whether an observed difference is larger than would be expected from sampling variation alone. Two figures whose intervals overlap substantially should not be described as different, however tempting the headline.
Weighting
Adjusting responses so the sample matches known population totals for age, sex, region, education and sometimes past vote. It corrects composition imbalance; it cannot conjure information about people the survey never reached.
Response Bias
Systematic distortion from how people answer rather than who was asked. Includes social desirability, acquiescence, and question-order effects, in which an earlier item shapes the answer to a later one.
Non-Response Bias
Distortion arising when the people who decline to participate differ systematically from those who agree. The central problem of contemporary polling, since response rates have fallen sharply in many countries.
Economic Confidence
Perception of economic conditions and prospects, personal or national. Related to but distinct from national direction: a respondent can be positive about their own finances and negative about the country’s course.
Political Trust
Confidence that institutions will act competently and in the public interest. Measured by the OECD against named institutions rather than in the abstract, because “the government” means different things to different respondents.
Salience
How prominent an issue is in respondents’ minds at the moment of interview. A key reason fieldwork dates matter: an identical population can answer differently in two weeks separated by one major news event.
Evergreen Explainers
The methodology that stays true regardless of which survey is in the news
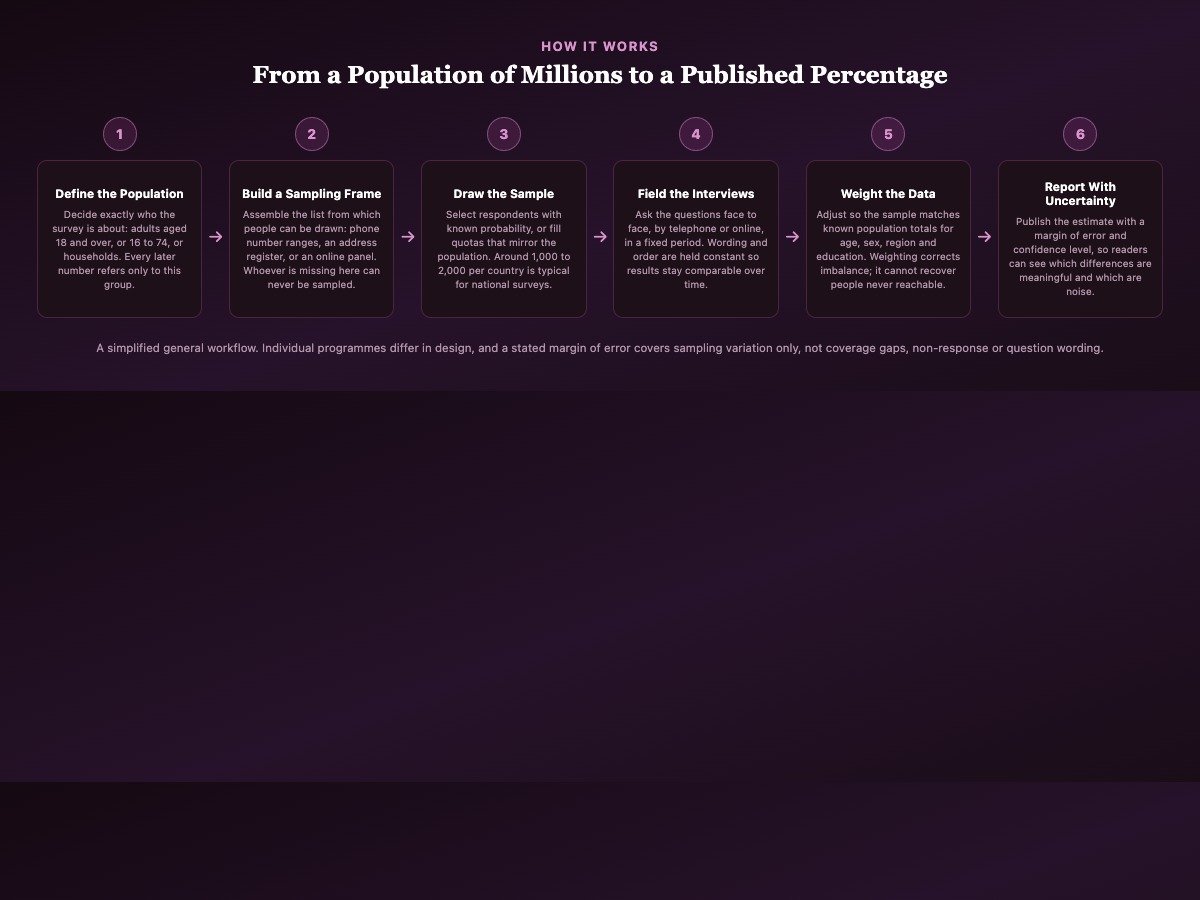
1. How Opinion Polls Work
A national survey moves through six stages, and an error at any one of them cannot be repaired later. First, define the population: adults 18 and over, or 16 to 74, or households. Every figure produced afterwards refers only to that group, which is why comparing a “16 to 74” result with an “18 plus” result is comparing two different populations.
Second, build a sampling frame. Third, draw the sample, either with known selection probabilities or against quotas, typically 1,000 to 2,000 people for a national estimate. Fourth, field the interviews within a defined window, holding wording and question order constant so the result stays comparable to previous waves.
Fifth, weight the data so the achieved sample matches known population totals. Sixth, report with uncertainty: publish the margin of error and confidence level so readers can distinguish signal from noise. A release that omits the sixth stage should be treated with caution, because the omission is usually a choice.
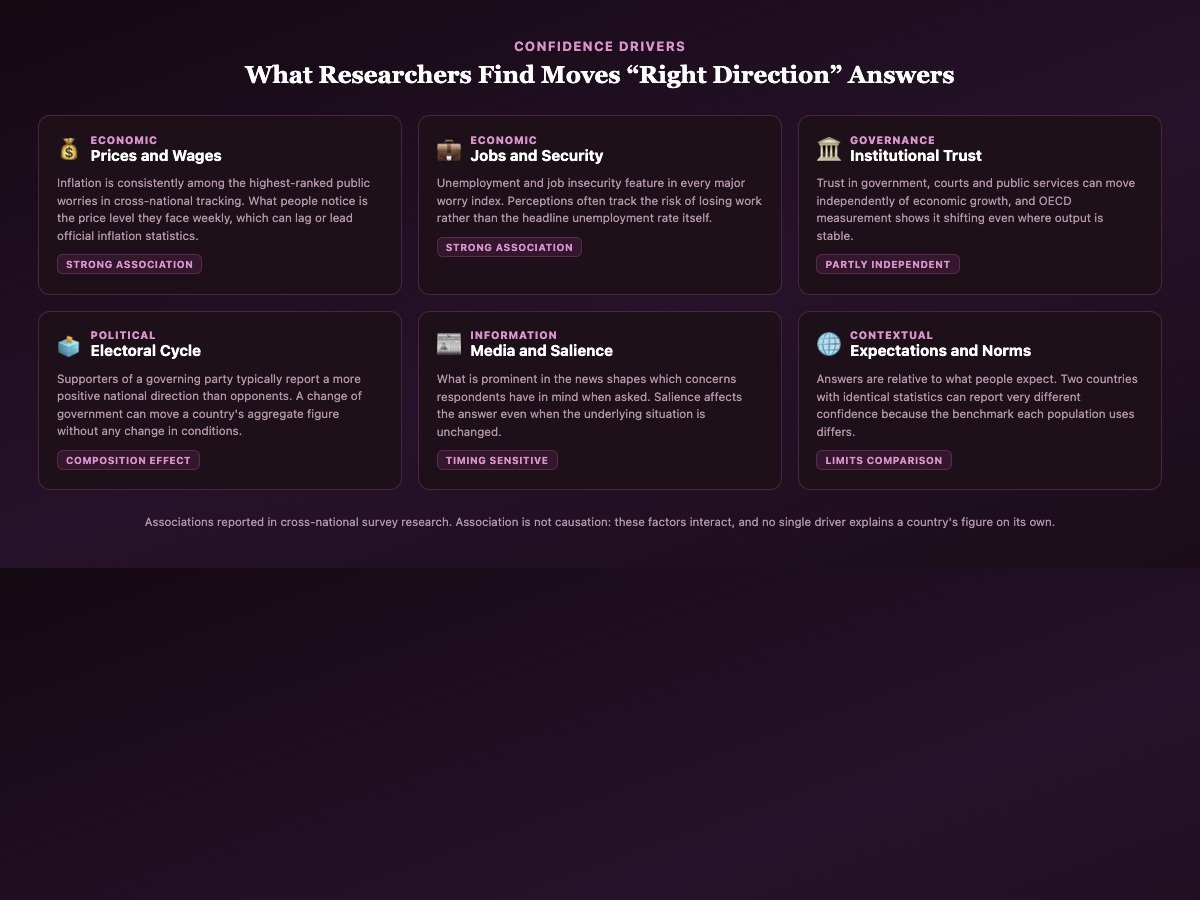
2. What Affects Public Confidence?
Research consistently associates several factors with movement in direction measures, without any of them being sufficient on its own. Prices matter most visibly: inflation ranks at or near the top of cross-national worry indices, and it is the price level rather than the rate that people report experiencing. Employment security follows, tracking perceived risk of job loss more closely than the measured unemployment rate.
Institutional trust moves partly on its own schedule, responding to scandals, service quality and the experience of dealing with public bodies. Political alignment produces a large and well-documented composition effect: supporters of the governing party report a more positive direction, so an election can shift a national aggregate with no change in conditions. Media salience determines which of these is uppermost when the question is asked. And expectations set the benchmark, which is the factor that most undermines naive cross-country comparison.
3. Why Survey Results Change Over Time
Movement in a series has three possible sources, and separating them is the core analytical task. Real change in what people think. Methodological change — a new mode, a revised frame, a different weighting scheme, a translation update. And noise, ordinary sampling variation that produces movement where nothing changed.
The discipline of reading a trend is therefore mechanical. Check whether the movement exceeds the margin of error. Check whether the methodology note flags a change. Check whether the fieldwork window contains an event that would raise salience. Only when all three are cleared is “opinion shifted” the best explanation. The 2020 pandemic period is the clearest recent case where mode changes and real change occurred simultaneously in the same series.
4. Correlation Versus Causation in Public Opinion
Confidence measures correlate with many economic indicators, and it is tempting to convert that into causation in either direction. Both directions are plausible and both are probably partly true, which is exactly why neither can be assumed.
Three complications recur. Reverse causation: low confidence can depress spending, which weakens the economy the survey then asks about. Confounding: a third factor, such as an energy shock, moves both statistics and sentiment independently. Timing: sentiment can lead official statistics because people observe their own circumstances before an agency publishes an aggregate, or lag them because accumulated price levels persist after rates fall. Serious analysis states which relationship is being claimed and on what evidence. Anything else is pattern-matching.
5. How to Read Cross-Country Comparisons
Cross-country tables are the most published and least defensible use of this data. Five distortions operate simultaneously.
Response style differs: populations vary in willingness to use extreme categories or to criticise authority. Translation shifts meaning, since “the right direction” carries different connotations across languages. Mode differs, and online, telephone and face-to-face interviewing produce systematically different results on sensitive items. Population definition differs by age range and residency. And the benchmark differs, because people judge direction against local expectations rather than a global standard.
None of these is corrected by weighting, and their combined effect can exceed the gaps being compared. The practical rule: use cross-country tables to identify countries worth examining, then examine each country’s own series over time. Rank order at one moment is the weakest inference the data supports.
📏 Statistics Insight
Small differences between survey results may not be statistically significant. On a national sample of 1,000, the margin of error is roughly 3 to 4 percentage points, so a country reported at 44% and another at 41% are not reliably different. The same applies to movement over time within one series. A responsible release states this; a headline rarely does. When you see a two-point change described as a shift, the honest description is usually that nothing measurable happened.
Comparison Tables
The distinctions that determine what a number can support
| Dimension | Opinion Survey | Official Statistics |
|---|---|---|
| What it captures | What people perceive and expect | What was recorded, produced or transacted |
| Unit | Share of respondents holding a view | Counts, rates, index values |
| Source | A sample of the population | Administrative records, censuses, business surveys |
| Main uncertainty | Sampling error, non-response, wording effects | Revision, definitional change, coverage |
| Publication lag | Days to weeks | Weeks to quarters, often revised later |
| Cross-country comparability | Weak without careful qualification | Stronger where international standards apply |
| Can it be wrong about facts | Yes, and that is not a defect: perception is the subject | Yes, through measurement or revision error |
| Best use | Trend within one country on constant methodology | Level and rate comparison under harmonised definitions |
| Economic indicator | Typical relationship with confidence | Why the link is imperfect |
|---|---|---|
| Inflation rate | Strong negative association when rising | People experience the accumulated price level; sentiment recovers slower than the rate falls |
| Unemployment rate | Negative association | Perceived job insecurity can rise while the measured rate is stable |
| Real household income | Positive association | Distribution matters; an average rise can coexist with widespread stagnation |
| GDP growth | Weak and inconsistent | Not directly experienced by households; post-2008 recoveries often left sentiment behind |
| Interest rates | Mixed | Helps savers, hurts borrowers; the net effect depends on national housing and debt structure |
| Energy prices | Strong short-run negative | Highly visible and frequently purchased, so it moves salience quickly |
| Attribute | Face-to-Face | Telephone | Online Panel |
|---|---|---|---|
| Typical coverage | Broadest, including offline households | Falling in many countries | Excludes those without internet access |
| Cost per interview | Highest | Moderate | Lowest |
| Speed | Slowest | Moderate | Fastest |
| Response rates | Generally highest | Sharply declining | Panel-dependent; opt-in |
| Interviewer effects | Present; can affect sensitive answers | Present but weaker | Absent |
| Formal margin of error | Defined where probability-based | Defined where probability-based | Not strictly defined for opt-in panels |
| Common use | Global and lower-coverage settings | Legacy national polling | Fast multi-country commercial tracking |
| Programme | Coverage | Cadence | Primary measure | Typical design |
|---|---|---|---|---|
| Ipsos, What Worries the World | 30 countries | Monthly | National direction and worry ranking | Around 20,000 adults per wave |
| Gallup World Poll | 160+ countries | Country-by-country schedule | Wellbeing, institutions, conditions | Probability-based, ages 15+, mostly face-to-face |
| Pew Global Attitudes | ~23 countries in recent waves | Annual survey rounds | Democracy satisfaction, political attitudes | Published topline and methodology per wave |
| OECD Trust Survey | 30 OECD countries in 2023 wave | Roughly biennial | Trust in named public institutions | ~2,000 per country; ~60,000 responses total |
| Eurobarometer | EU member states | Standard waves plus specials | Attitudes to the EU and national issues | Continuous since 1974 |
| World Values Survey | ~100 countries to date | Multi-year waves | Long-run values and beliefs | Academic consortium; archived microdata |
| Dimension | Short-Term Event Effect | Long-Term Perception |
|---|---|---|
| Trigger | An election, disaster, scandal or price shock | Accumulated experience over years |
| Speed of onset | Within a single fieldwork window | Gradual, often invisible month to month |
| Persistence | Frequently reverses within months | Can persist for a decade or more |
| Detectable in | A single monthly wave | Multi-year series on constant methodology |
| Risk when misread | Treating a spike as a structural shift | Missing a slow shift because each step is small |
| Clearest example | Month-on-month country swings in monthly trackers | Post-2008 trust that did not return with output |
| Evidence type | Answers | Cannot answer | Example source |
|---|---|---|---|
| Survey findings | What a defined population reported at a defined time | Whether the perception is accurate | Ipsos monthly reports; Pew topline questionnaires |
| Official statistics | Measured economic and social conditions | How those conditions are experienced | National statistical agencies; World Bank data |
| Academic research | Relationships between variables over time | What will happen next | World Values Survey analyses |
| Methodology documentation | How a number was produced and its limits | Substantive conclusions | Gallup World Poll design; Pew methods pages |
| Independent journalism | Context, reception and contestation | Primary measurement | Reporting on survey releases |
| Editorial interpretation | A reading of what the evidence supports | Anything asserted without the above | Sections of this guide, flagged as analysis |
💰 Economic Insight
Employment, inflation and household income often influence perceptions of national direction. The mechanism is more specific than “the economy”: what registers is what is frequently observed. Grocery and energy prices are encountered weekly and move sentiment quickly. GDP is encountered as a news item and moves it weakly. This is why sentiment can stay depressed through a statistical recovery — the recovery is real in the aggregate and has not yet reached the observations people actually make.
Timeline Summary Table
Every milestone at a glance
| Year | Development | Importance |
|---|---|---|
| 1935 | American Institute of Public Opinion founded | Statistical sampling applied to national opinion measurement |
| 1936 | A small sample outperforms a 2.4-million-reply mail poll | Establishes that frame quality beats raw volume |
| 1948 | High-profile US polling miss | Drives the shift from quota to probability sampling |
| 1950s | National polling institutes spread internationally | Makes identical questions across countries practical |
| 1970s | Comparative survey programmes and data archiving | Published questionnaires and microdata become the norm |
| 1974 | First official Eurobarometer wave, nine countries | Creates a continuous public cross-national time series |
| 1981 | World Values Survey founded by Ronald Inglehart | Supplies the multi-decade baseline for value change |
| 1995-1999 | Latinobarometro and Afrobarometer launched | Extends systematic measurement beyond wealthy democracies |
| 2000s | Online panels replace declining telephone coverage | Cheaper and faster, but not probability-based |
| 2005 | Gallup World Poll launched | 160+ countries; source layer for many global indices |
| 2008 | Global financial crisis | Confidence falls and does not fully return with output |
| 2010s | Fragmented information environments | Within-country dispersion rises; averages describe fewer people |
| 2020 | Pandemic disrupts fieldwork and shifts modes | Creates documented discontinuities in some series |
| 2022 | Inflation returns as the dominant worry | Shows perception tracks price level, not the rate |
| 2024 | OECD publishes second Trust Survey results | 30 countries; average fall conceals rises and falls |
| 2025 | Pew Spring 2025 Global Attitudes findings released | Median 58% dissatisfied with democracy across 23 countries |
| 2026 | Ipsos monthly tracking continues across 30 countries | 37% right direction Sept 2025; 41% Jan 2026 |
🏛️ Governance Insight
Trust in institutions can change independently of economic growth. The OECD’s cross-national measurement shows movement in both directions among countries on broadly similar economic paths, and its 2024 results found that across the twenty countries surveyed in both waves, average trust in national government fell about two points while rising in several individual countries. That pattern is difficult to reconcile with any model in which trust is simply a function of output, and it is why governance researchers treat trust as a variable with its own drivers.
How to Read a Survey Release in Ten Minutes
A reproducible checklist, and the methodology notes that matter
The Five Things to Find Before the Headline
One: the population. Which ages, which residency status, which country coverage. If a release says “adults aged 16 to 74 in 30 countries”, it is not describing the same group as a survey of “adults 18 and over” and the two should not be placed in one table.
Two: the fieldwork dates. Not the publication date. A report published in July may describe interviews conducted in May, before events that a reader assumes are reflected in it.
Three: the mode and sample size. Online panel, telephone or face to face, and how many respondents per country. These determine both the uncertainty and what the figure can be compared with.
Four: the exact question wording. Reputable programmes publish the topline questionnaire. Whether a neutral middle option was offered changes the split, and comparing a forced-binary result with a three-option result is comparing two different instruments.
Five: the margin of error and any weighting scheme. Without these you cannot tell whether a reported difference is a difference at all.
Methodology Notes That Change the Interpretation
Several specific notes recur and each should alter how you read the number. A mode change mid-series creates a break that can look like an opinion shift. A frame update, such as refreshing an online panel, can move results without any change in views. A change to the weighting variables, for instance adding education, typically shifts results by a measurable amount and is usually documented in a footnote rather than the headline.
For opt-in online panels specifically, published “margin of error” figures are often described as a credibility interval or a modelled equivalent, because the classical margin of error is defined for probability samples. This is not a reason to dismiss the data. It is a reason to read the qualifier rather than skipping it.
Where the Primary Sources Live
Every organisation cited in this guide publishes its own documentation, and going to it directly takes less time than most readers expect. Ipsos publishes each monthly What Worries the World edition as a downloadable report containing the methodology and country tables. Pew Research Center publishes a methodology page and full topline questionnaire alongside each global report. Gallup documents the World Poll research design and methodology codebook. The OECD publishes the full Trust Survey report including its statistical annex. Eurobarometer and the World Values Survey both provide archived data and documentation. Links to all of these appear in the sources list at the foot of this article.
What This Guide Deliberately Does Not Do
It does not rank countries. It does not describe any country as objectively on the right track or the wrong track. It does not forecast elections, and it does not convert survey movement into a prediction about any political outcome. Where we report a percentage, it is attributed to a named survey with its fieldwork period. Where we offer a reading of what the evidence supports, it is labelled as analysis. Those constraints are not caution for its own sake; they are the difference between reporting research and misusing it.
Key Organisations in This Field
Who produces the data, and what each is authoritative for
Pew Research Center
Non-partisan American research organisation conducting the Global Attitudes Survey across roughly two dozen countries. Publishes full topline questionnaires and methodology pages with each report, making its findings unusually easy to verify independently.
Gallup
Runs the Gallup World Poll, launched in 2005 and conducted in more than 160 countries covering an estimated 99% of the world’s adult population. Probability-based samples of residents aged 15 and over, mostly face to face.
Ipsos
Global market and opinion research company whose What Worries the World programme fields monthly in 30 countries among roughly 20,000 adults, tracking both national direction and the ranking of public worries.
World Values Survey
Academic consortium founded in 1981 by Ronald Inglehart, running multi-year waves in close to 100 countries containing around 90% of the world’s population, with archived microdata available for reanalysis.
OECD
Runs the Survey on Drivers of Trust in Public Institutions. Its second wave, fielded in late 2023 and published in 2024, gathered close to 60,000 responses across 30 member countries, typically around 2,000 per country.
European Commission (Eurobarometer)
Has run the Eurobarometer series since the first official wave in 1974 across the then nine member states, providing the longest continuous standardised cross-national opinion time series in existence.
United Nations
Publishes social, demographic and development statistics used as the official-statistics counterpart to opinion measures, and provides the harmonised definitions that make cross-country statistical comparison more defensible than cross-country opinion comparison.
World Bank
Maintains open international development and economic indicator datasets. Its data is the standard reference layer when checking whether a movement in perception corresponds to a movement in measured conditions.
Our World in Data
Research publication that compiles and documents long-run datasets, including on trust and institutions, with sourcing and methodology notes attached. Useful for locating the original series behind a widely circulated chart.
Professional survey associations
Bodies such as national and international polling associations publish disclosure standards specifying what a release should report: sponsor, population, dates, mode, sample size, weighting and question wording. These standards are the benchmark this guide applies.
🔭 Future Watch
Documented, non-speculative developments worth following: scheduled official survey releases, including Ipsos monthly editions, Pew global report rounds and the next OECD Trust Survey wave; academic research on comparability, particularly work on response styles and translation effects that would improve cross-country reading; methodology improvements such as better handling of opt-in panels, address-based sampling and mixed-mode designs; and coverage expansion as regional barometers extend their country lists. We do not forecast election outcomes or predict where any country’s figure will move, and this guide is updated only when one of these organisations publishes new data or documentation.
Common Misconceptions
What this data supports, and what it does not
✅ What the evidence supports
- These surveys reliably measure what a defined population reported at a defined time, within a stated margin of error.
- Trends within one country on constant methodology are the strongest inference available from this data.
- Inflation and job security are consistently among the factors most associated with movement in direction and worry measures.
- Institutional trust can move independently of economic growth, as OECD cross-national measurement shows.
- Perception can lag official statistics because people experience price levels rather than rates of change.
- Named figures with named fieldwork periods are checkable: every organisation cited here publishes its own methodology.
❌ What it does not support
- That a high “right direction” figure means a country is objectively performing well, or a low one that it is failing.
- That two countries’ percentages can be compared directly without accounting for mode, wording, translation and response style.
- That a two- or three-point difference is a real difference on a typical national sample.
- That direction, democracy satisfaction and institutional trust are interchangeable measures of one underlying “confidence”.
- That these surveys forecast elections. Vote intention is a separate instrument requiring turnout modelling.
- That a break in a trend line is necessarily a change in opinion rather than a change in method.
💡 Interesting Facts
- The 1936 mail poll that got the result wrong collected roughly 2.4 million replies. The sample that got it right collected a few thousand. Size was never the variable that mattered.
- Eurobarometer was preceded by three pilot studies in 1970, 1971 and 1973 before the first official wave in 1974 — the programme spent four years testing its instrument before it started publishing.
- The Gallup World Poll interviews residents aged 15 and over, a lower threshold than most national polls, which is one reason its figures are not directly comparable with adult-only national surveys.
- Ipsos fields its monthly tracker among roughly 20,000 adults across 30 countries, which works out at only a few hundred to two thousand people per country — small enough that single-country monthly moves need careful reading.
- The OECD’s 2024 Trust Survey results reported an average two-point fall in trust in national government since 2021, while trust rose in Australia, Belgium, Canada, Colombia, France, Latvia and Sweden. Averages hide direction.
- Pew reported satisfaction with democracy ranging from 75% in Sweden to 19% in Greece in its 2025 round — a 56-point spread among countries in the same region.
- Across 12 high-income countries Pew has tracked since 2017, satisfaction and dissatisfaction with democracy were evenly split at 49% each in 2017. By the 2025 round the median split was 35% satisfied to 64% dissatisfied.
- Ronald Inglehart, who founded the World Values Survey in 1981, died in 2021 — forty years after launching a programme specifically designed to detect change across generations.
Explore More Timelines
People Also Ask
Frequently Asked Questions
Eighty questions on the surveys, the methods and how to read the results
Why Public Confidence Is Best Understood Through Long-Term Trends
Return to the two women from the opening. Their answers, aggregated with thousands of others, become two national percentages that a chart will place side by side. Read in isolation, that chart says one country is doing better than the other. Read properly, it says something narrower and more useful: that in a particular month, using a particular instrument, more people in one place than the other reported feeling positive about where things were going, for reasons the question did not ask them to specify.
The value of these surveys is real and it is specific. A ninety-year methodological tradition — from the 1936 demonstration that frame quality beats volume, through the probability-sampling turn after 1948, to fifty years of Eurobarometer waves and forty of the World Values Survey — has produced instruments that reliably capture perception within stated limits. Used on their own terms, they show things nothing else does: that trust fell after 2008 and did not return with output; that worry about prices outlasts the inflation rate that caused it; that satisfaction with democracy in a group of high-income countries moved from an even split in 2017 to roughly two to one dissatisfied by 2025.
Every one of those findings is a trend. None is a ranking. That is not a coincidence. Trends within a constant methodology are what this data is built to support, because holding wording, mode and sampling still is what strips out the differences that otherwise dominate. A cross-country table at a single moment does the opposite: it maximises the contribution of everything that is not opinion.
So the honest conclusion is also the practical one. “Right track / wrong track” surveys provide valuable insight into how people perceive their country’s direction, and they deserve to be read alongside official economic, social and political indicators rather than in place of them. Changes in public confidence usually reflect a combination of lived experience, expectations and current events rather than any single measure of national performance. The number tells you what a population felt. Understanding why still requires everything else — and being clear about which of those two things you are looking at is most of the work.
Related Reading on AiTimeline
Sources & further reading
Every dated entry above was checked against these references. Last reviewed 15 September 2026.
- Ipsos - What Worries the World (monthly tracker)
- Pew Research Center - Dissatisfaction with democracy remains widespread
- Pew Research Center - Methodology, Spring 2025 Global Attitudes Survey
- Gallup - How Does the Gallup World Poll Work?
- World Values Survey - Official site
- European Commission - Eurobarometer
- Our World in Data - Trust
- World Bank - Open Data