Rupee Depreciation: India’s Currency Fall Against the Dollar
Rupee depreciation explained: the rupee's fall against the dollar from ₹3.31 in 1947 to a record ₹96.96 in 2026, the 1991 and 2013 crises and RBI moves.
Latest Story
At independence one US dollar cost about ₹3.31. In May 2026 it cost a record ₹96.96, and in October the rupee was back within a few paise of that low. Rupee depreciation is not a straight line, and it is not simply a verdict on India’s economy: it reflects inflation gaps, the price of imported oil, US interest rates, foreign investment and the dollar’s role as the world’s safe haven. This timeline follows the rupee from the fixed rates of the 1940s through the devaluations of 1949, 1966 and 1991, the market era that began in 1993, and the shocks of 2013, 2022, 2025 and 2026, up to the Reserve Bank of India’s new dollar window for oil companies announced on 10 October 2026.
💡 Short Answer
The rupee has fallen from about ₹3.31 per dollar in 1947 to about ₹96.7–96.9 in October 2026. Official devaluations in 1949, 1966 and 1991 did most of the early damage; since the rate became market-based in 1993, the big falls came in 2008, 2013, 2018, 2022, 2025 and 2026. The record low is about ₹96.96, set on 20 May 2026. On 10 October 2026 the RBI opened a special dollar window for state oil companies to ease the pressure.
Rupee Depreciation: Key Questions
The Rupee’s Fall in Ten Points
- 1947: about ₹3.31 per dollar, fixed through sterling under Bretton Woods.
- 1949 and 1966: devaluations took the rate to ₹4.76, then ₹7.50.
- 1975–90: a basket peg let the rupee slide quietly to about ₹17.5.
- 1991: a balance-of-payments crisis forced an 18–19% devaluation and reforms.
- 1993: the market began setting the rate; the RBI smooths moves.
- 2000–07: strong inflows made the rupee stronger, near ₹39 at one point.
- 2013: the taper tantrum took it to ₹68.85 and produced the first oil-company dollar window.
- 2022: Fed hikes and the Ukraine war pushed it past ₹83.
- 2025: US tariffs and visa fees took it past ₹90 in December.
- 2026: an oil shock set a record ₹96.96 in May; the RBI hiked rates and reopened the oil window in October.
Pick a moment. See the rate, and what $1,000 cost in rupees.
Tap a year. Rates are official, annual-average or market figures as labelled. Nothing you click is recorded.
Choose a year above
Rupee vs Dollar Timeline, 1947–2026
Newest first. Tags show whether a moment was an external shock, a policy decision, a market move or a recovery.
2026
RBI opens a dollar window for oil companies Policy
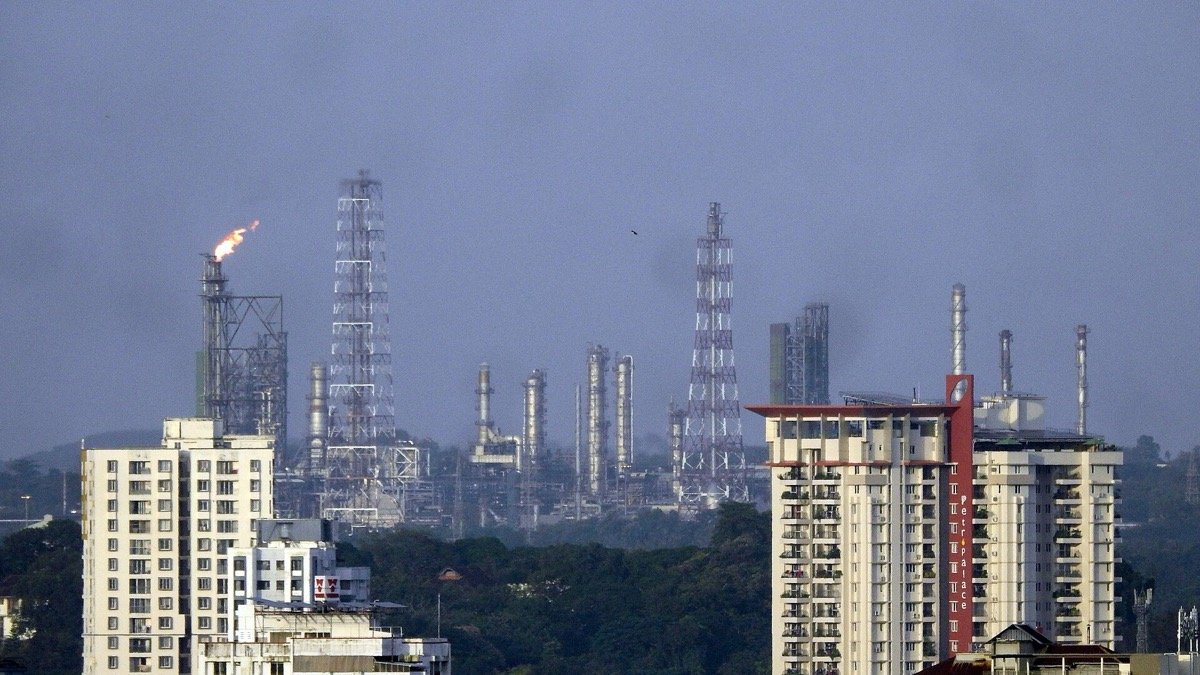
Two days after the rupee closed near ₹96.88, the Reserve Bank announces its most direct defence yet. From 12 October it will meet the entire daily dollar requirement of Indian Oil, Bharat Petroleum and Hindustan Petroleum through a special facility, taking India’s largest dollar buyers out of the spot market. It also cuts the limit for forex derivatives without an underlying exposure from $100 million to $5 million, bars rebooking of cancelled rupee-linked contracts (rollovers at maturity are still allowed) and imposes a 20% cash reserve requirement on specified derivative contracts above $2 million.
Why it matters: it is a near copy of the August 2013 oil window that helped end the taper-tantrum slide. It lowers dollar demand on the market, but the RBI still has to supply those dollars from its reserves.
2026
First rate hike since 2023; rupee near its record low Policy
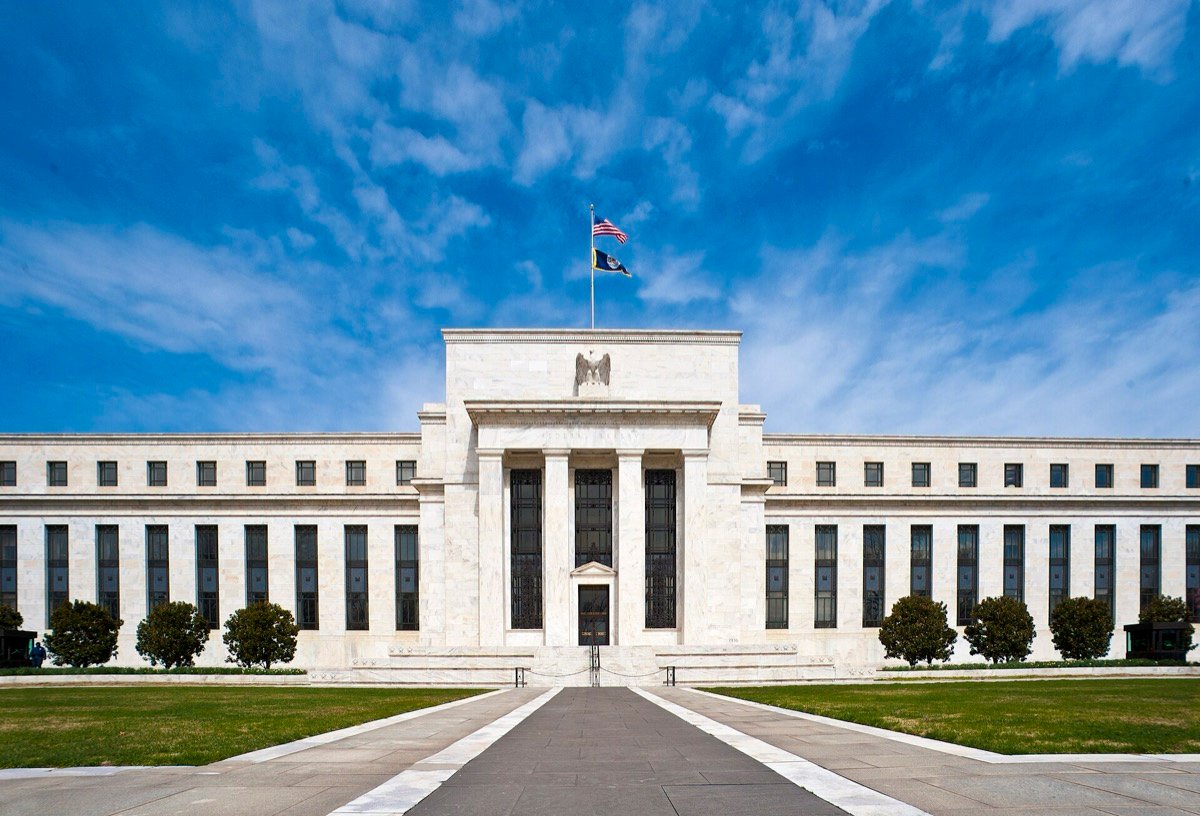
On 7 October the Monetary Policy Committee raises the repo rate by 25 basis points to 5.50% and shifts its stance to “calibrated tightening”. The rupee still weakens, closing at about ₹96.88 on 8 October as Brent crude jumps above $104 and foreign investors keep selling, before recovering slightly to ₹96.72 on 9 October. Reserves fall to about $734.6 billion in the week to 2 October, roughly $51 billion below the early-September peak, as the RBI sells dollars.
Why it matters: higher rates alone did not stop the slide. That is why the RBI moved to direct measures three days later.
A $136 billion deposit swap rebuilds reserves Recovery
In June the RBI opens a special swap facility for foreign-currency deposits from non-resident Indians, an idea borrowed from 2013. Banks raise about $136 billion by the end of August, and reserves climb for ten straight weeks to a record of about $785.7 billion in the week to 4 September. The rupee briefly strengthens to around ₹94.3 in early September before oil and US yields push it back above ₹96.
Why it matters: it gave the RBI more firepower, but swaps must be repaid later, so the extra reserves are borrowed time rather than earned income.
2026
All-time low: about ₹96.96 per dollar Shock
The rupee falls to an all-time intraday low of about ₹96.96 per dollar (Bloomberg data show ₹96.97), pushed by high crude prices, rising global bond yields and stalled US–Iran talks. It had crossed ₹96 for the first time only days earlier, in mid-May.
Why it matters: this is still the record as of 11 October 2026, and the level traders now watch.
Oil shock: rupee crosses ₹92, then ₹95 Shock
As the US–Iran conflict pushes oil prices up about 40%, the rupee hits a record ₹92.63 on 19 March and crosses ₹95 for the first time on 30 March. Foreign investors pull almost $8 billion out of Indian shares in a few weeks. The RBI sells dollars through state-run banks to slow the fall.
Why it matters: India imports more than 80% of its crude. An oil shock combined with capital outflows is the worst mix for the rupee, and it moved further in one month than in most full years.
2026
Trade deal brings the biggest one-day gain since 2018 Recovery
After President Trump says US tariffs on Indian goods will be cut to 18% from 50%, the rupee jumps about 1.4% in a day, from ₹91.53 to close near ₹90.27, its biggest daily rise since December 2018. The Nifty climbs as much as 5%.
Why it matters: it showed how much of the 2025 weakness was about trade policy, and that the rupee can rebound sharply when a cause is removed.
2025
The rupee crosses ₹90 Shock
The rupee falls past ₹90 per dollar for the first time, to about ₹90.13, amid stalled India–US trade talks, a wide trade deficit and foreign outflows. It slips past ₹91 within about ten trading sessions, reaching roughly ₹91.1 in mid-December. The calendar-year average for 2025 ends at about ₹87.2.
Why it matters: it took 14 months to fall from ₹84 to ₹90, compared with almost two years to go from ₹83 to ₹84.
Tariffs and outflows push the rupee past ₹88 Shock
The rupee sets a record near ₹86.7 in mid-January and comes close to ₹88 in February, then recovers to about ₹84 in early May as the dollar weakens worldwide. After the US doubles tariffs on many Indian goods to 50% from late August, it crosses ₹88 for the first time. On 23 September it reaches about ₹88.80 after the US imposes a $100,000 fee on new H-1B visa petitions.
Why it matters: trade and visa rules hit sectors that bring dollars into India, IT services above all, before the effects show up in the trade data.
₹84, then ₹85 Market
After trading in a narrow band for most of the year, with a low of about ₹83.75 in July, the rupee crosses ₹84 in October as foreign investors sell Indian shares, and ₹85 in December as the dollar strengthens after the US election.
Why it matters: the RBI had kept the rupee unusually stable for two years. When it allowed more movement, the gradual weakening resumed.
A year of unusual calm Recovery
The rupee trades in one of its narrowest ranges in decades, mostly between ₹81 and ₹83.5, as the RBI buys dollars when inflows are strong and sells when they are weak. Reserves are rebuilt after the 2022 drawdown.
Why it matters: a stable daily rate is not the same as a reversal of the long-term trend; it is managed calm.
Fed hikes and war push the rupee past ₹83 Shock
Russia’s invasion of Ukraine lifts oil and commodity prices, and the US Federal Reserve raises rates at the fastest pace since the 1980s. The dollar index hits a 20-year high. The rupee, about ₹74.5 at the start of the year, crosses ₹80 in July and ₹83 on 19–20 October, touching about ₹83.29. Reserves fall by about $100 billion from their 2021 peak as the RBI intervenes.
Why it matters: the rupee fell about 10% in the year, but less than many currencies, including the euro, the yen and the pound, against the dollar. A strong dollar, not only Indian weakness, was the story.
Covid: a shock, then a long pause Market
As the pandemic spreads, investors rush to the dollar and the rupee falls to about ₹76.9 in April 2020. Then record foreign investment into Indian shares and companies such as Reliance Jio allows the RBI to buy dollars and push reserves past $600 billion in 2021. The annual averages for 2020 and 2021 are almost identical.
Why it matters: strong inflows let the RBI build the reserves it later spent in 2022 and 2026.
Oil and a strong dollar: past ₹74 Shock
Brent crude rises above $85, the dollar strengthens and a crisis at the lender IL&FS shakes Indian markets. The rupee crosses ₹74 in early October and sets a record of about ₹74.48 on 11 October before recovering as oil prices fall at the end of the year.
Why it matters: it was a reminder that India’s oil bill can move the rupee within weeks.
Recovery and relative stability Recovery
Falling oil prices from late 2014, a smaller current-account deficit and stronger inflows let the rupee stabilise. It weakens gradually to an average of about ₹67.2 in 2016, then strengthens in 2017. India adopts inflation targeting in 2016, which narrows the gap between Indian and US inflation over time.
Why it matters: lower inflation is the main long-run defence against depreciation, because persistent inflation gaps tend to show up in the exchange rate.
The taper tantrum: ₹68.85 and an oil window Shock
After the Federal Reserve signals in May that it may slow its bond buying, money pours out of emerging markets with large current-account deficits. India’s is near 5% of GDP. On 28 August the rupee falls to a then-record ₹68.85, losing close to 4% in one session. The same day the RBI opens a swap window to supply dollars to Indian Oil, BPCL and HPCL. Raghuram Rajan becomes Governor on 4 September and launches a subsidised swap for non-resident deposits that brings in about $34 billion; gold imports are curbed. The rupee recovers to around ₹62 by the end of the year.
Why it matters: India was named one of the “Fragile Five” economies. The playbook it used, an oil window plus a deposit swap, was used again in 2026.
Euro crisis and a widening deficit Shock
The euro-area debt crisis drives investors to the dollar, while India’s current-account deficit widens on high oil and gold imports. The annual average jumps from about ₹46.7 in 2011 to about ₹53.4 in 2012, a fall of roughly 13% in the rupee’s value.
Why it matters: it set up the vulnerability that the 2013 taper tantrum exposed.
Global financial crisis Shock
As Lehman Brothers collapses in September 2008, foreign investors sell emerging-market assets and the rupee falls past ₹50 in October 2008 and nears ₹52 by March 2009. The RBI sells dollars and cuts reserve requirements to keep money flowing.
Why it matters: India’s economy was not the source of the shock, but the rupee still fell, because it depends on global capital flows.
The rupee gets stronger Recovery
High growth, IT exports and large foreign investment flows push the rupee up for much of the decade. The Foreign Exchange Management Act replaces the stricter FERA in June 2000. By late 2007 the rupee trades near ₹39, and exporters complain that it is too strong.
Why it matters: depreciation is a long-term trend, not a law. Strong inflows can push the rupee up for years.
1993
A market-determined exchange rate Policy
After a one-year dual-rate system called LERMS, India unifies its exchange rate and lets the market set it. Current-account convertibility follows in August 1994. The RBI keeps the right to intervene and does so often.
Why it matters: from here on, the rupee’s value reflects trade, capital flows and sentiment day by day, which is why later shocks show up so quickly.
1991
Balance-of-payments crisis and devaluation Shock
The Gulf War sends oil prices up and cuts remittances from the Gulf, and political instability scares lenders. Reserves fall to cover only a few weeks of imports, and India pledges gold with the Bank of England and the Bank of Japan to raise emergency loans. On 1 and 3 July the RBI devalues the rupee in two steps, by about 18–19% against the dollar, taking it from about ₹21 to almost ₹26. The Narasimha Rao government and Finance Minister Manmohan Singh launch trade and industrial reforms within weeks.
Why it matters: it is the defining currency crisis of modern India, and the reason the country later built large reserves.
A managed basket peg Policy
After the collapse of Bretton Woods, India links the rupee to sterling from 1971 and then, from September 1975, to a basket of currencies of its main trading partners. The RBI adjusts the rate gradually. The dollar rate rises from about ₹8 in the late 1970s to about ₹12.4 in 1985 and ₹17.5 in 1990, partly because Indian inflation runs above US inflation.
Why it matters: the rupee’s long fall began well before 1991, through quiet official adjustments rather than market crashes.
1966
The 1966 devaluation Shock
Wars with China (1962) and Pakistan (1965), two failed monsoons and heavy food imports leave India short of foreign exchange. Under pressure from aid donors, the Indira Gandhi government devalues the rupee, raising the dollar rate from ₹4.76 to ₹7.50: the dollar’s rupee price rises 57.5%, and the rupee loses 36.5% of its dollar value. The expected export boom does not come quickly, and the move is politically damaging.
Why it matters: it is still the biggest single devaluation in India’s history.
Following sterling down Policy
When Britain devalues the pound by about 30% in September 1949, India keeps the rupee at ₹13.33 per pound, so the rupee falls against the dollar by the same proportion, to about ₹4.76.
Why it matters: the rupee’s early dollar value was set by decisions in London and Washington as much as in Delhi.
Independence: about ₹3.31 per dollar Policy
India becomes independent with its rupee tied to sterling at ₹13.33 per pound, within the Bretton Woods system of fixed exchange rates agreed in 1944. That puts the dollar at about ₹3.31. Strict exchange controls mean ordinary people cannot freely buy dollars at this rate.
Why it matters: it is the starting point people quote, but it was an administered price, not a market rate. Claims that ₹1 once equalled $1 are false.

What Does Rupee Depreciation Mean?
An exchange rate of ₹80 per dollar means one dollar costs ₹80. If the rate moves to ₹90, the same dollar costs ₹90: the rupee has depreciated, because it takes more rupees to buy the same dollar. When the government or central bank deliberately lowers a fixed rate, as in 1949, 1966 and 1991, it is called a devaluation. Since 1993 the rupee has mostly depreciated through the market rather than by official decision.
Exchange-rate figures are not all the same kind of number. Official rates from before 1993, calendar-year averages, daily closing rates and intraday lows can differ by a rupee or more in a volatile week. This article labels which is which.
Six forces behind the rupee’s fall
1. Oil is bought in dollars
2. US interest rates pull money home
3. Foreign investors can leave quickly
4. Inflation differences
5. The current-account deficit
6. The dollar is the safe haven
These forces overlap. The worst episodes, 1991, 2013 and 2026, combined expensive oil with money leaving India at the same time.
Nine turning points in one line
Swipe or scroll sideways, then compare the four biggest market-era shocks in the table.
Devaluation
₹4.76 → ₹7.50 in one official step after wars and drought.
BoP crisis
Weeks of import cover; gold pledged; two-step devaluation.
Market rate
Unified, market-determined exchange rate from 1 March.
Lehman
Global panic; the rupee passes ₹50 in October 2008.
Taper tantrum
Record ₹68.85; oil window and NRI deposit swap.
Oil + dollar
Record ₹74.48 as crude tops $85.
Fed hikes
Past ₹83 as the dollar hits a 20-year high.
Tariffs
50% US tariffs and H-1B fees; ₹90 by December.
Oil war
Record ₹96.96 in May; oil window again in October.
| Shock | Main trigger | Rupee low | RBI / government response | What came next |
|---|---|---|---|---|
| 1991 crisis | Gulf War oil spike, lost remittances, political instability | Devalued to about ₹26 in July | Devaluation, gold pledged, IMF loan, trade and industrial reform | Market-based rate from 1993; reserves rebuilt |
| 2013 taper tantrum | Fed taper signal; current-account deficit near 5% of GDP | ₹68.85 on 28 Aug | Oil-company swap window, FCNR(B) deposit swap (~$34bn), gold curbs | Rupee about ₹62 by December; inflation targeting from 2016 |
| 2022 dollar rally | Fed rate hikes, Ukraine war, oil and food prices | ~₹83.29 on 20 Oct | Heavy dollar sales; reserves fell by about $100bn from peak | Managed calm in 2023 |
| 2026 oil shock | US–Iran conflict, oil, foreign outflows, US yields | ₹96.96 on 20 May | NRI deposit swap (~$136bn), rate hike to 5.5%, oil window, derivative curbs | Unfolding as of 11 Oct 2026 |
The 2026 response repeats two 2013 tools, the deposit swap and the oil window, at a much larger scale.
Same dollars, more rupees
Illustrative arithmetic only, ignoring bank fees, taxes and hedging. Scroll the table sideways on a phone.
| Who | Cost or earning in dollars | At ₹87.16 (2025 avg) | At ₹96.88 (8 Oct 2026) | Difference |
|---|---|---|---|---|
| Student abroad | $50,000 a year in fees and living costs | ₹43.6 lakh | ₹48.4 lakh | +₹4.9 lakh |
| Family receiving remittances | $1,000 a month from a relative abroad | ₹87,160 | ₹96,880 | +₹9,720 a month |
| Traveller | $3,000 for a two-week US trip | ₹2.61 lakh | ₹2.91 lakh | +₹29,160 |
| IT or export firm | $1 million of annual sales | ₹8.72 crore | ₹9.69 crore | +₹97 lakh, before any rise in import costs |
| Oil importer | One barrel at $100 | ₹8,716 | ₹9,688 | +₹972 a barrel |
Winners and losers depend on which way your dollars flow. Households paying in dollars lose; households and firms earning dollars gain, unless their own costs are also in dollars.
Can the RBI Stop the Rupee’s Slide?
The RBI’s stated aim is to curb excessive volatility, not to defend a fixed number.
✅ What the RBI can do
- Sell dollars from reserves, directly or through state-run banks
- Use forex swaps to manage liquidity and forward pressure
- Raise interest rates, as on 7 October 2026
- Supply dollars to big importers outside the market, as in 2013 and 2026
- Curb speculative derivative positions
- Attract inflows, such as special NRI deposit schemes
❌ What it cannot do
- Spend reserves forever: they fell by about $51 billion in four weeks to 2 October 2026
- Control oil prices or US bond yields
- Stop foreign investors from selling
- Raise rates without slowing growth
- Guarantee any particular exchange rate
Does a Falling Rupee Mean India’s Economy Is Failing?
No. India’s economy has grown many times over since 1991 while the rupee lost more than three-quarters of its dollar value. The exchange rate compares two economies and their interest rates, prices and capital flows; it is not a scorecard of one.
Economists prefer the real effective exchange rate (REER), which adjusts for inflation and weighs the rupee against a basket of trading partners’ currencies. In October 2026 RBI Governor Sanjay Malhotra said the rupee was not overvalued on this measure. A weaker nominal rupee can even help competitiveness, but it also imports inflation through oil, gold and electronics.
The real warning signs are the ones that preceded 1991 and 2013: reserves falling towards a few months of import cover, a large current-account deficit and dependence on short-term foreign money. In 2026 reserves are far larger than in either crisis, but they have been falling quickly.
Fact Check: Common Claims, Corrected
Checked against RBI data, IMF/OECD annual averages and Reuters, Bloomberg and PTI reports, up to 11 October 2026.
“₹1 was equal to $1 at independence”
False. The official rate was about ₹3.31 per dollar, derived from the rupee’s link to sterling at ₹13.33 per pound.
“The rupee hit a new record of ₹96.97 in October”
The record, about ₹96.96 (₹96.97 in Bloomberg data), was set on 20 May 2026. In October the rupee closed at about ₹96.88 on 8 October, close to but not past the record, as of 11 October.
“India floated the rupee in 1991”
1991 brought a devaluation. The market-determined rate came in stages: a dual rate in March 1992 and a single market rate on 1 March 1993.
“The oil-company window is new”
The RBI used the same tool for Indian Oil, BPCL and HPCL from 28 August 2013 and wound it down that December.
“The rupee has fallen every single year”
It strengthened in several years, including 2003–07 and 2017, and it jumped 1.4% in a day on 3 February 2026 after the India–US trade deal.
“A weak rupee means a weak economy”
Not on its own. India grew strongly through most periods of depreciation. Inflation-adjusted measures such as the REER tell a different story from the headline rate.
What to Watch Next
The oil window in practice. How much dollar demand it removes from the market from 12 October, and how fast reserves fall as a result.
Oil and the Strait of Hormuz. Any lasting US–Iran deal would ease India’s import bill; renewed attacks would do the opposite.
US bond yields and the Federal Reserve. Higher US yields keep pulling money out of emerging markets.
Data. India’s September inflation figure on 12 October and the weekly reserves release on 16 October. For day-by-day moves, see our Indian Rupee 2026 tracker.
Explore More Timelines
People Also Ask
Frequently Asked Questions
The Exchange Rate Is a Signal, Not the Whole Story
The rupee’s journey from about ₹3.31 to nearly ₹97 per dollar spans a fixed-rate system run from London and Washington, three devaluations, a near-default and three decades of market pricing. The 1991 crisis showed the danger of thin reserves; 2013 showed the power of global capital; 2022 showed how far a strong dollar reaches; 2025 and 2026 added tariffs and an oil war.
The question that matters is not whether the rupee rises or falls next week, but whether India can reduce its dependence on imported energy, attract steady long-term investment and keep inflation low enough that depreciation stays gradual rather than sudden.
Related AiTimeline Stories
⚠️ Editorial Note
Last updated 11 October 2026. Historical rates use different measures: official rates before 1993, calendar-year averages (RBI, IMF and OECD series) and reported daily closes or intraday levels from Reuters, Bloomberg and PTI; outlets can differ by a few paise. Percentage falls for market episodes are rounded approximations. This article is for information only and is not investment or currency-trading advice. Check a live quote before any transaction.
Sources & further reading
Every dated entry above was checked against these references. Last reviewed 11 October 2026.
- Business Today - RBI's rupee defence: special dollar window for oil firms, tighter forex derivative rules (10 Oct 2026)
- Bloomberg - India's RBI unveils measures to aid rupee, including special oil dollar facility (10 Oct 2026)
- Business Today - Rupee near record low: why RBI's multiple defences are losing effectiveness (8 Oct 2026)
- Reserve Bank of India - Handbook of Statistics, Table 204: Exchange rate of the rupee vis-a-vis the US dollar and other currencies
- 5paisa - Rupee hits record low of Rs 92.63 against the US dollar (March 2026)
- Free Press Journal - Rupee rockets over 1% to 90.29 against dollar on India-US trade deal (3 Feb 2026)
- LatestLY - Rupee crashes to record low beyond 90 per dollar for first time (3 Dec 2025)
- Business Standard (Reuters) - Rupee recovers as RBI moves on oil imports (29 Aug 2013)