Delhi Air Pollution Measures: What Actually Worked?
Delhi air pollution measures from the 1998 CNG order to odd-even, GRAP and the 2026 winter plan, scored on the evidence: what cut smog and what did not.
Latest Story
Delhi has tried almost everything: CNG buses, cleaner fuel, a Metro, odd-even car rationing, emergency bans, smog towers and even cloud seeding. Some Delhi air pollution measures changed how emissions are produced and delivered lasting gains; others gave a few days of relief or none at all. This timeline dates each major step from the 1998 CNG order to the 2026 winter plan and scores it on what the evidence shows, not on how loudly it was announced.
💡 Short Answer
The measures that worked best in Delhi changed emissions every day: the court-ordered switch of buses, autos and taxis to CNG (1998–2002), cleaner fuel and BS-VI vehicles, the Metro and the closure of coal plants inside the city. Emergency tools such as odd-even and GRAP curbs gave limited, short-lived relief. Delhi’s annual AQI improved from 225 in 2018 to 201 in 2025, but December 2025 still averaged 351.
Delhi’s Air Pollution Measures: Key Questions
What Three Decades of Clean-Air Policy Show
- Structural beats seasonal: measures that change fuels, vehicles and power plants have delivered the most lasting gains.
- CNG was the first big win: ordered on 28 July 1998 and completed for buses by 2002.
- BS-VI is the quiet one: cleaner fuel in Delhi from 2018 and BS-VI vehicles nationwide from April 2020.
- Odd-even was limited: 4–16% lower PM2.5 in January 2016, no clear effect in April.
- GRAP is a brake, not a cure: notified in January 2017, forecast-based since October 2022.
- Gimmicks disappointed: smog towers (2021) and cloud seeding (2025) showed little or no effect.
- 2025 was better on average: AQI 201, the best since 2018 outside the 2020 lockdown.
- But winter still wins: December 2025 averaged 351, and GRAP Stage IV returned twice.
- Sources are many: winter PM2.5 is about 27% secondary particles, 23% transport, 20% biomass burning.
- The 2026 test: 211 clean-air days by mid-October, with the winter plan and ‘No PUCC, No Fuel’ now in force.
The Timeline: From the CNG Order to the 2026 Winter Plan
Newest first. Tags mark structural measures, emergency measures, institutions, data and the 2026 chapter.
2026
211 clean-air days so far 2026
Environment Minister Manjinder Singh Sirsa called the 101-day gain over 2016 a collective achievement but warned that winter is the real test. These figures cover January to mid-October, before the months when Delhi’s air is usually at its worst, so the full-year result may look different.
2026
‘No PUCC, No Fuel’ goes city-wide 2026
Cameras read each number plate at the pump and check the vehicle’s Pollution Under Control Certificate against the national database; if it has lapsed, fuel is refused until the owner gets a fresh test. It is an enforcement measure for rules that already existed, aimed at the poorly maintained vehicles that emit far more than their share.
2026
Rain is not a solution, CSE finds Data
The Centre for Science and Environment’s analysis found that rain cut PM2.5 by about 19.5% while it fell, but the washout did not last. Ground-level ozone, which forms in sunlight from vehicle and industrial gases, was the leading pollutant on about 20 monsoon days. Even in the cleanest season, most days were only ‘moderate’.
2026
Winter Action Plan 2026–27 Emergency
The plan also adds 150 electric buses, taking the e-bus fleet past 700, fitness tests for about 2.5 lakh vehicles at automated testing stations and weekly inspections of 37 pollution hotspots. Many measures are seasonal, but the bus fleet and vehicle testing are lasting changes. Whether the work-from-home and construction rules are enforced will decide how much they help.
A clearer picture of where the pollution comes from Institution
The new stations are split between Delhi (14), Haryana (16), Uttar Pradesh (15) and Rajasthan (1), and are meant to cover suburbs, industrial zones and border areas where pollution enters and leaves the city. The commission also considered tighter particulate standards for industry and stronger dust rules. A fresh emissions inventory involving IIT Delhi and ARAI was commissioned.
Jan 2026
GRAP Stage IV, again Emergency
A cold, still December undid much of the year’s progress: the month was the most polluted of 2025, and the strictest curbs, on trucks, construction and in-person schooling, returned twice within five weeks. It is the clearest example of how weather can overwhelm emission controls in winter.
Best annual average in seven years, barring 2020 Data
The government’s year-end review credited coordinated action under the CAQM. February and July were the cleanest of their months since 2018. But the number of days with an AQI below 200 actually fell, from 209 to 200, a reminder that a lower average can hide a worse spread. The figures show outcomes, not which measure caused them.
Cloud seeding trial Emergency
Artificial rain had been discussed for years as a quick fix. The trial showed its limits: it needs the right clouds, which are rare in a dry Delhi winter, and even real rain only cleans the air for a day or two, as the CSE’s 2026 analysis later confirmed.
Old-vehicle fuel ban paused within days Emergency
The age limits themselves date from a 2014 National Green Tribunal order upheld by the Supreme Court in 2018. Enforcing them at the pump proved difficult: the cameras were not yet working everywhere, and owners argued that age is a poor proxy for emissions. The 2026 ‘No PUCC, No Fuel’ rule targets actual test results instead.
2024
AQI hits 494 Emergency
A combination of farm fires, a temperature inversion and calm winds sent Delhi’s 24-hour AQI to 494, one of the highest on record. The Supreme Court criticised the delay in invoking Stage IV and ordered that it stay in force until the court allowed it to be relaxed.
2022
GRAP becomes forecast-based Institution
The original plan reacted once the air had already turned severe. The revision aimed to act before the peak, for example banning construction or diesel generators when a severe spell was forecast. It made the system faster, but the pollution it responds to still comes from sources outside its emergency reach.
The CAQM gets a law; smog towers open Institution
The commission, first created by an ordinance in October 2020, replaced the court-appointed EPCA with a statutory body covering Delhi and the NCR states plus Punjab. The smog towers drew more headlines but far less evidence: monitoring suggested any benefit was confined to the area around each tower, and the idea was not scaled up.
2020
Lockdown shows what activity does to the air Data
Skies cleared visibly in spring 2020. But it was not a controlled experiment: the weather also changed, and secondary particles from sources outside Delhi kept forming. The episode proved that emissions matter, not that shutting down the economy is a pollution policy.
2020
India jumps from BS-IV to BS-VI Structural
India skipped BS-V entirely. The benefit is permanent but gradual: it grows as older vehicles are scrapped, which is why the 2026 winter plan bars non-BS-VI vehicles from outside Delhi and why enforcement of fitness and pollution certificates matters.
2019
National Clean Air Programme Institution
The NCAP made air quality a standing national priority with funding tied to results. Its targets are measured in PM10, which is heavily affected by dust, so progress on PM10 does not always mean progress on the finer, more harmful PM2.5.
2018
Badarpur coal plant closes for good Structural
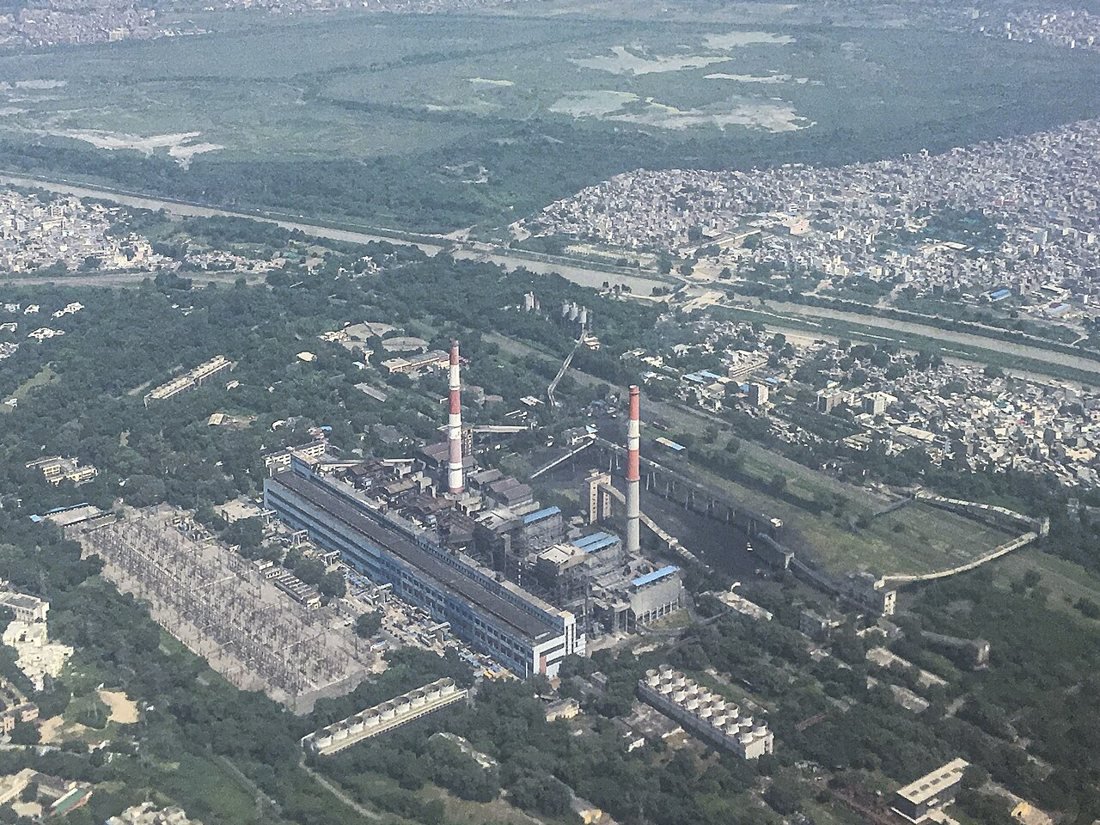
Badarpur was one of Delhi’s largest single industrial sources of particulates and sulphur dioxide. Its closure, together with the earlier shutdown of the Rajghat plant in 2015, removed coal burning for power from the city itself, though plants in the wider NCR continue to operate.
Cleaner fuel and a truck bypass Structural
The bypass, together with the Western Peripheral Expressway, gave heavy trucks bound elsewhere a way around the city instead of through it, while an environment compensation charge on trucks entering Delhi, in place since 2015, added a financial nudge.
2017
GRAP notified Emergency
GRAP gave the region a rulebook for emergencies: pre-agreed actions, from road sweeping to bans on construction and diesel generators, that kick in as pollution worsens. It replaced improvised responses with a common framework, but by design it acts only on emergencies, not on the everyday emissions that set the baseline.
The post-Diwali smog Data
The crisis, with PM2.5 readings far above anything the scale was designed for, pushed the Supreme Court and the Centre to formalise emergency planning. Within weeks the court asked for a graded plan, which became GRAP.
2016
The odd-even experiment Emergency
Evidence on the January round was mixed. A multi-institution study estimated PM2.5 fell by only 4–6%, while EPIC researchers estimated 14–16% during scheme hours. Both found no clear effect in April. CSE recorded bus and Metro ridership up 7–8% and lower peaks during the scheme, but PM2.5 jumped 57% within 24 hours of it ending.
2015
National Air Quality Index launched Institution
The AQI turned scattered monitoring data into a figure the public could follow, and later into legal triggers for action. Measurement alone does not cut emissions, but it made the problem impossible to ignore and gave policy a scoreboard.
WHO names Delhi the most polluted city Data
The ranking, disputed at the time by Indian officials, focused public debate on PM2.5 rather than coarser dust and helped drive the measures that followed, from the AQI to the odd-even trial.
2002
The Delhi Metro opens Structural
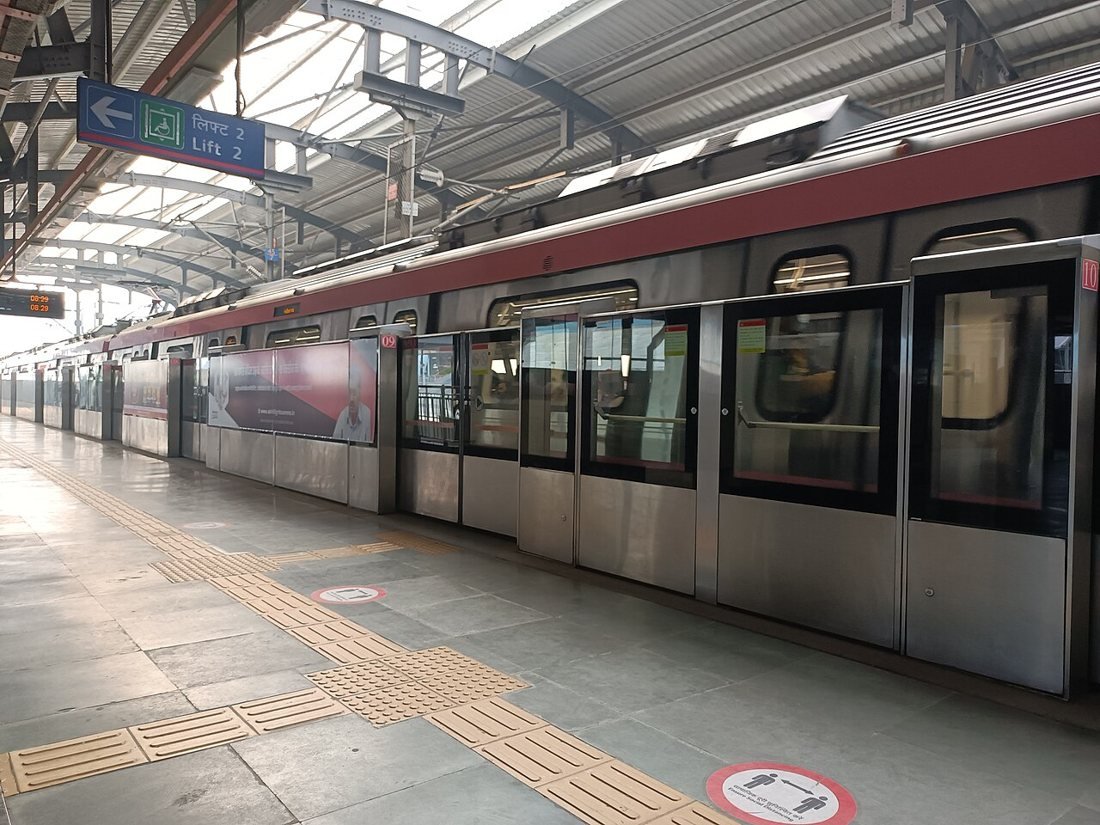
The Metro is a long-term structural measure: its pollution benefit depends on how many trips it takes away from cars and two-wheelers, which in turn depends on last-mile connections and bus feeders. The 2026 winter plan’s exemption of Metro parking from doubled fees reflects that aim.
1998
The Supreme Court orders CNG Structural
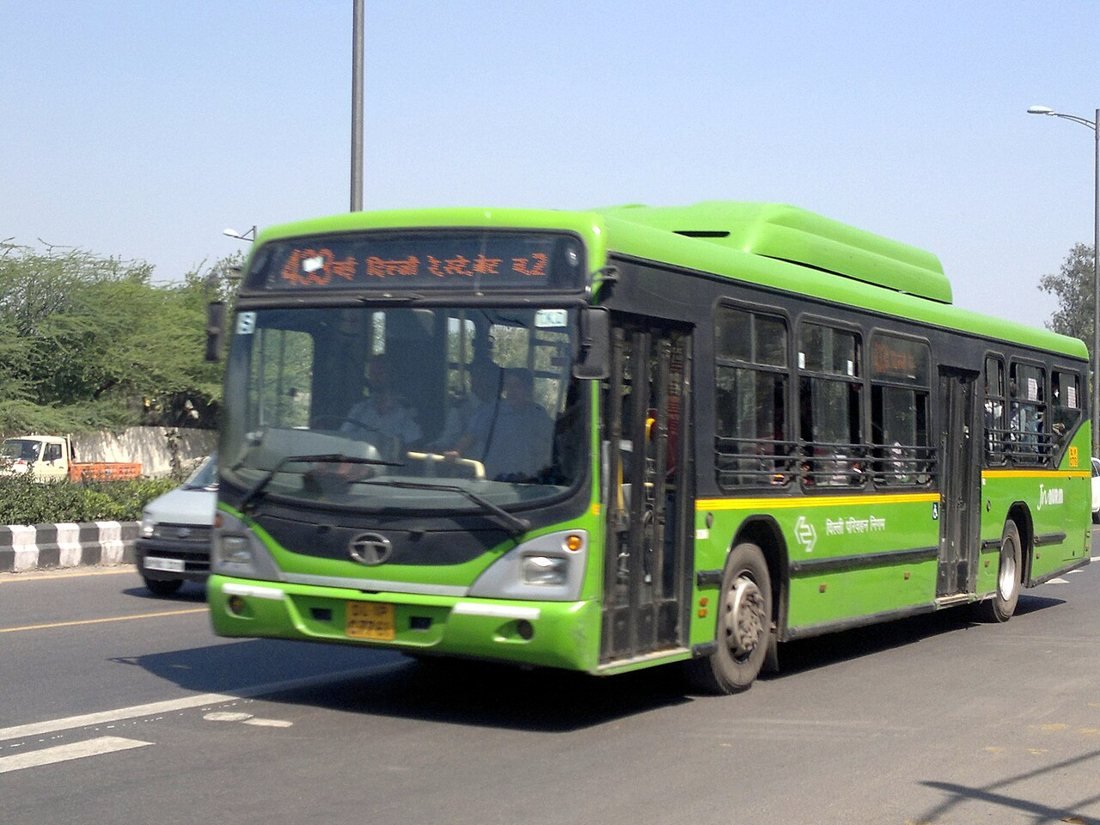
The deadline was missed amid fuel shortages and resistance from transport operators; the court imposed penalties and by the end of 2002 Delhi’s buses ran on CNG. Combined with lower-sulphur fuel, older-vehicle bans and the relocation of polluting industries, it was the city’s first big structural clean-up.
Pick a measure to see what the evidence says it achieved, and where it fell short.
Delhi’s Annual AQI, 2018–2025
2025 vs 2024: Better on Average, Not Everywhere
| Indicator | 2024 | 2025 | Change |
|---|---|---|---|
| Annual average AQI | 209 | 201 | Better |
| Average PM2.5 (μg/m³) | about 104 | 96 | Better; lowest since 2020 |
| Average PM10 (μg/m³) | about 212 | 197 | Better; lowest since 2020 |
| Good-to-satisfactory days (AQI 0–100) | 66 | 79 | Better |
| Days with AQI below 200 | 209 | 200 | Worse |
| Severe-to-severe-plus days (AQI 401+) | 17 | 8 | Better |
| December average AQI | – | 351 | Very poor |
The annual numbers improved on almost every measure, and severe days halved. But the count of days below an AQI of 200 slipped, and the year ended with its worst month. The government’s own review describes outcomes; it does not show which measure caused them, and weather varies a lot from one winter to the next. The 2024 particulate figures are approximate.
What Actually Worked? An Evidence-Based Scorecard
| Measure | Assessment | Why |
|---|---|---|
| CNG transition and cleaner fuels | Strong structural contribution | Cut emissions from the vehicles it covered and set a lasting clean-fuel requirement |
| BS-VI standards and fuel | Strong long-term potential | Tighter limits for every new vehicle; real-world gains depend on fleet turnover and compliance |
| Metro and public transport | Strong potential | Reduces private-vehicle trips where capacity, frequency and last-mile links are good |
| Coal power plant closures | Strong, local | Removed large point sources inside Delhi; NCR plants remain |
| Odd-even restrictions | Limited and temporary | Some traffic reduction; evidence of large citywide PM2.5 cuts is mixed |
| GRAP | Useful emergency response | Curbs selected activities in severe spells; does not replace prevention |
| Construction and road-dust control | Necessary, enforcement-dependent | A major source, especially in warmer months; must be continuous |
| Crop-residue and biomass control | Necessary regional measure | A big seasonal contributor, but not the only cause of winter smog |
| More monitoring stations | Essential enabling step | Better diagnosis and accountability; does not cut emissions by itself |
| Smog towers and cloud seeding | Weak or unproven | Local or short-lived effects at best |
| Rain and favourable winds | Temporary natural relief | Lowers readings without removing any source |
Where Delhi’s PM2.5 Comes From
Switch seasons to see how the estimated sources of Delhi’s PM2.5 change.
CAQM synthesis of 2015–2025 source-apportionment studies. Shares are study averages and vary by day, place and method; the listed categories do not add up to 100%.
The CAQM’s synthesis explains why single-sector fixes fail. In winter no source makes up more than about a quarter of the pollution, and the largest share, secondary particles, forms in the air from gases released by vehicles, power plants, industry and farms, often outside Delhi. In summer, dust leads. A plan that targets only cars, or only farm fires, can at best move one of these numbers.
How GRAP Works
| GRAP stage | AQI | Typical measures |
|---|---|---|
| Stage I | 201–300 (poor) | Dust control at sites, ban on open burning, PUC checks, ban on coal and firewood in eateries |
| Stage II | 301–400 (very poor) | Diesel generator curbs, higher parking fees, more buses and Metro trips |
| Stage III | 401–450 (severe) | Ban on most construction and demolition, curbs on older petrol and diesel cars, hybrid classes for schools |
| Stage IV | Above 450 (severe plus) | Ban on non-essential trucks entering Delhi, all construction stopped, offices at 50%, schools online |
Simplified from the CAQM’s revised schedule; each stage includes all measures of the stages below it, and the commission adjusts the list most years.
Winter 2026–27: What Is in Force
| Winter Action Plan 2026–27 | Detail |
|---|---|
| Period | 1 November 2026 to 31 January 2027 |
| Vehicles | Non-BS-VI vehicles from outside Delhi barred from 1 November; ‘No PUCC, No Fuel’ at about 500 pumps from 1 October |
| Offices | 50% work from home; staggered hours (MCD 8:30–5, Delhi government 10–6:30) |
| Construction | Dust-generating demolition and outdoor work barred; total ban 10 December to 20 January |
| Transport | 150 more electric buses, fleet past 700; parking fees doubled except at Metro sites |
| Enforcement | Weekly hotspot inspections at 37 sites; daily evening AQI bulletins; citizen reporting |
Five Measures Most Likely to Deliver Lasting Improvement
Cut vehicle emissions every day
Faster fleet turnover to BS-VI and electric, real enforcement of pollution certificates, and buses and Metro feeders good enough to replace car trips.
Control it at the source
Covered materials, site barriers, paved and maintained roads and mechanised sweeping, all year, not just when GRAP is invoked.
Act across the NCR
Continuous emissions monitoring, cleaner industrial fuels and controls on the sulphur and nitrogen gases that form secondary particles.
A year-round regional programme
Machines, markets for straw and support for farmers in Punjab and Haryana, alongside, not instead of, action in the city.
Targets for every source
Named agencies, sector-wise targets, public reporting and evaluation against a weather-adjusted baseline, rather than counting announcements.
What the Evidence Rules Out
- Blaming one source: no single sector made up more than 27% of winter PM2.5 in the CAQM’s study.
- Reading one year as proof: a cleaner year can come from kinder weather; a bad December does not erase real progress.
- Waiting for rain: PM2.5 rose 37.9% within 48 hours of rain stopping in the 2026 monsoon.
- Air purifiers for a city: smog towers clean a neighbourhood at best.
- Lockdowns as policy: 2020 showed the effect of activity, not a usable strategy.
Explore More Timelines
People Also Ask
Frequently Asked Questions
Conclusion: Clean Air Needs Structural Change, Not Just Winter Bans
Delhi’s record shows that pollution control works when it changes how emissions are produced. Cleaner fuels, stricter vehicle standards, mass transit and the end of coal power inside the city have delivered gains that last; temporary restrictions have mostly delivered headlines. Regional coordination and better monitoring are now in place, and dust and biomass burning need steady, unglamorous enforcement.
The real test is simple: can Delhi keep its air cleaner when the rain stops, the winds drop and winter arrives? The winter of 2026–27, with its 211-day head start, will be the next measure.
Related AiTimeline Stories
⚠️ Editorial Note
This article draws on the environment ministry’s year-end review ‘2025: Air Quality Perspective in Delhi’, CAQM releases of February 2026, the CSE’s monsoon analysis of 30 September 2026, peer-reviewed and EPIC studies of the 2016 odd-even trials, the Delhi government’s 2026–27 winter plan and news reporting. The scorecard separates measures with strong structural evidence from those whose effect is mixed or temporary; official annual figures describe outcomes, not a controlled test of any one policy. Health advice here is general; people with respiratory or heart conditions should follow their doctor. Events after 19 October 2026 are not covered.
Sources & further reading
Every dated entry above was checked against these references. Last reviewed 19 October 2026.
- Ministry of Environment, Forest and Climate Change (PIB) - 2025: Air Quality Perspective in Delhi
- PIB / CAQM - Expert analysis of Delhi's pollution sources and 2026 measures
- News On Air - CAQM to install 46 new air quality monitoring stations in Delhi-NCR (10 February 2026)
- Centre for Science and Environment - Delhi registers only one good air day during monsoon (30 September 2026)
- Centre for Science and Environment - Delhi has lost the air quality gains of the odd-even scheme (January 2016)
- Environmental Science and Policy - Peer-reviewed study of the odd-even traffic intervention in Delhi
- EPIC India - Did odd-even clean Delhi's air? Analysis evaluates
- Government of Delhi - Air Pollution Mitigation Plan 2025
- NewsGram - Delhi announces winter pollution action plan 2026-27 (29 September 2026)
- The News Mill - Delhi achieves 211 clean air days in 2026 (17 October 2026)
- PRS Legislative Research - Air pollution in Delhi-NCR and steps taken for its mitigation
- Commission for Air Quality Management in NCR and Adjoining Areas