Indian Monsoon Forecasting: IMD’s Journey and Forecast Misses
Indian monsoon forecasting explained: how IMD forecasts evolved since 1886, why 2002, 2004 and 2009 missed, and how the 2026 season ended at 87% of LPA.
Latest Story
India has forecast its monsoon for 140 years, longer than almost any country has issued seasonal forecasts. Indian monsoon forecasting began with one man noticing that heavy Himalayan snow tended to precede a weak monsoon, and it now runs on coupled climate models, supercomputers and, since 2026, artificial intelligence. The record is not a smooth climb. The India Meteorological Department (IMD) missed severe droughts in 2002, 2004 and 2009, then rebuilt its system. This timeline traces that journey through the deficient 2026 monsoon, which IMD saw coming.
💡 Short Answer
IMD has issued seasonal monsoon forecasts since 4 June 1886. Statistical models failed to foresee the droughts of 2002 (forecast 101% of the Long Period Average, actual 81%), 2004 and 2009 (forecast 96%, actual about 77%). Since switching to a multi-model ensemble in 2021, its average all-India error has fallen from 7.5% of the LPA in 2017–20 to 2.28% in 2021–24. In 2026 it forecast a below-normal 90%, and the season ended at 87%.
Monsoon Forecasting: Key Questions
140 Years of Forecasts in Ten Points
- The start: IMD was founded in 1875 and issued its first regular monsoon forecast on 4 June 1886.
- The first predictor: Henry Blanford linked heavy Himalayan snow to weaker monsoons.
- Walker’s legacy: the search for better predictors in 1904–24 uncovered the Southern Oscillation.
- Numbers, not words: the 1988 power regression model gave a forecast as a percentage of the LPA.
- The big misses: 2002, 2004 and 2009 each produced deficient rain after near-normal forecasts.
- Dynamical models: the Monsoon Mission from 2012 built a coupled ocean-atmosphere model for India.
- The 2021 reset: a multi-model ensemble cut average error from 7.5% to 2.28% of the LPA.
- Three clean years: forecasts for 2023, 2024 and 2025 all fell inside their stated error range.
- 2026: IMD forecast a below-normal season; it ended at 87%, the weakest since 2015.
- The limit: a correct national number can still hide floods in one state and drought in another.
How Monsoon Forecasting Works
A seasonal forecast is a single number for the whole country, not a prediction of rain where you live.
Each April IMD estimates how much rain India as a whole will get from June to September, expressed as a percentage of the Long Period Average, about 87 cm based on 1971–2020. It attaches a model error, usually ±4% or ±5%, and updates the forecast in the last week of May. A forecast of 106% does not mean every district will get 6% more rain than usual, or that the rain will come evenly through the season.
The seasonal forecast is one layer in a stack. Shorter forecasts answer different questions, and for a farmer deciding when to sow, or a city preparing for a cloudburst, they matter more.
| Forecast type | Range | What it answers |
|---|---|---|
| Nowcast | Next 3 hours | Is a thunderstorm about to hit this district or city? |
| Short and medium range | Up to 7 days (heavy rain warnings up to 7 days, up from 5 in 2014) | Where will heavy rain fall this week? |
| Extended range | Up to 4 weeks | When will the monsoon reach my area? Is a dry spell coming? |
| Monthly | One month ahead | Will July be wetter or drier than normal? |
| Seasonal (long range) | June to September, issued in April and May | Will India’s monsoon as a whole be normal? |
The Timeline: From the 1875 Founding to the 2026 Monsoon
Newest first. Tags mark forecasts that landed within range, forecast misses, changes of method and institutional milestones.
2026
The monsoon withdraws after a deficient season 2026
The withdrawal closed a season that ended well short of average. For Tamil Nadu, coastal Andhra Pradesh and south interior Karnataka, attention now turns to the October–December northeast monsoon, for which IMD issued a separate outlook on 1 October. Reservoir levels and rabi sowing in the south, which had a 24% shortfall in the main season, will depend heavily on it.
2026
2026 ends at 87% of the LPA: below normal, as forecast Within range
The season started with June rainfall about 40% below normal, one of the driest Junes on record, as El Niño took hold; NOAA declared El Niño conditions on 11 June. July recovered to around normal, but August and September were deficient again. The result, 87%, sat inside the May forecast’s range of 86–94% and on the lower edge of the April range. Unlike 2002 and 2009, IMD had warned of a poor year in advance, although it did not foresee how badly the south and north-east would fare, having expected the north-east to be near normal.
2026
The update cuts the forecast to 90% Method
The second-stage forecast went further than April’s, putting the most likely outcome close to the deficient threshold of 90%. It also flagged rain-fed farming areas specifically, the kind of regional guidance IMD did not issue before its 2021 strategy change.
2026
AI enters operational monsoon forecasting Method
Launched by Earth Sciences Minister Jitendra Singh and built by IMD, IITM Pune and NCMRWF, the system blends AI models with extended-range and statistical forecasts and is sent to farmers through the agriculture ministry. At the launch the minister said India had around 50 Doppler weather radars, up from 16 or 17 a decade earlier, with another 50 planned.
2026
IMD calls a below-normal season in April 2026
This was the test the 2002 and 2009 forecasts failed: anticipating a weak El Niño-affected monsoon months ahead. IMD’s April statement relied on its dynamical models, which showed the Pacific warming even while weak La Niña-like conditions were still present.
2026
Government reports a 1.9% average error for 2023–25 Within range
The reply also listed why forecasts still go wrong: the evolution of ENSO, the Indian Ocean Dipole, large swings within the season and models’ difficulty simulating monsoon low-pressure systems over central India. On IMD’s 151st foundation day on 15 January 2026, the minister had said seasonal and monthly forecast errors had fallen from about 7.5% to about 2.5%, and announced 50 automatic weather stations each for Delhi, Mumbai, Chennai and Pune.
A wet year, forecast correctly Within range
The Bharat Forecast System, developed at IITM Pune, runs a global model at a 6 km grid on the Arka supercomputer. Separately, the agriculture ministry, working with the University of Chicago, texted local forecasts of monsoon onset to 3,88,45,214 farmers in 13 states, based on a blend of AI weather models including Google’s NeuralGCM. A follow-up survey found that 31–52% of farmers changed planting decisions.
Mission Mausam and a close forecast Within range
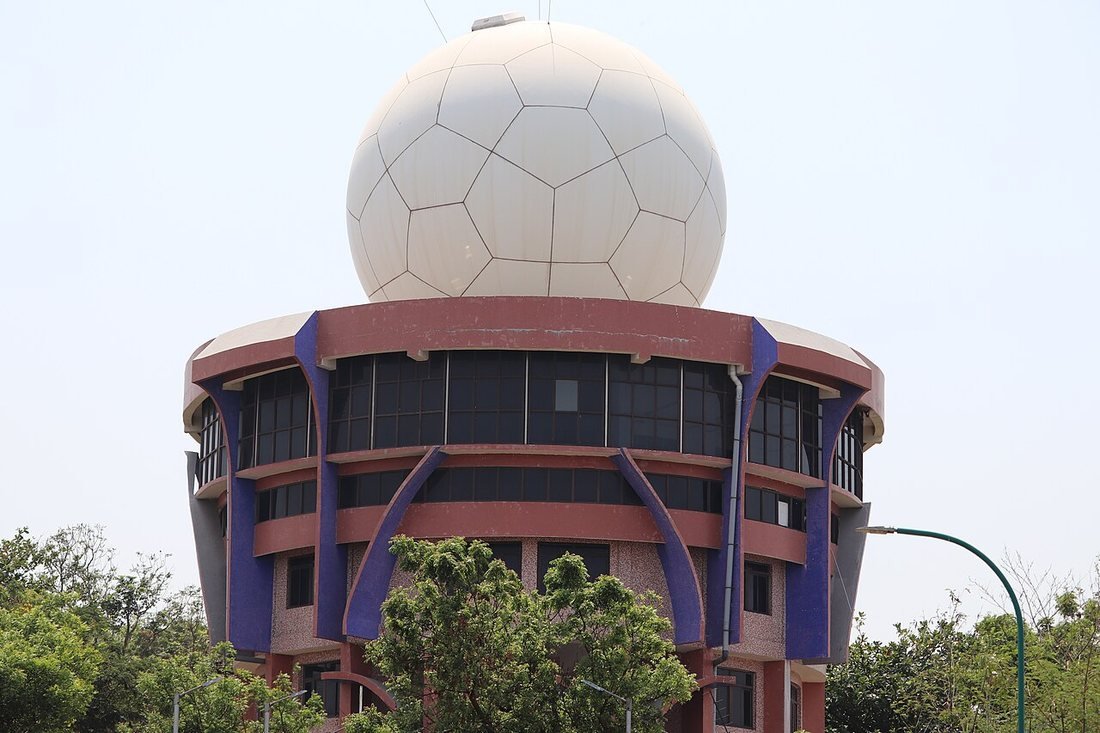
A La Niña-leaning season produced above-normal rain, as forecast. Mission Mausam funds new radars, satellites and supercomputers and better Earth-system models. By 2025, IMD’s rainfall monitoring stations had grown to 6,727 from 3,980 in 2015, and its high-performance computing capacity to about 22 petaflops.
An El Niño year handled well Within range
A seasonal total close to the forecast hid a dramatic month: August rainfall was about 36% below normal before a wetter September pulled the season back. It is a good example of why IMD now publishes monthly forecasts as well as a seasonal number.
Third year of the new strategy Within range
The late-May upgrade moved the forecast closer to the outcome. Heavy rain in central and southern India offset deficits in the Gangetic plains, another case of a national figure that masked regional extremes.
IMD switches to a multi-model ensemble Method
Instead of relying mainly on statistical regression, IMD now combines coupled global climate models from several prediction centres, including its own MMCFS, and gives probabilities for each rainfall category and maps of where rain is likely to be above or below normal. Average absolute error fell from 7.5% of the LPA in 2017–20 to 2.28% in 2021–24.
2020
Four years, three big errors Forecast miss
The misses ran in both directions. In 2019, a positive Indian Ocean Dipole helped deliver the wettest season in 25 years after IMD had forecast a normal one. These years were the immediate case for the 2021 overhaul.
2017
The Monsoon Mission builds a dynamical model Institution
The mission partnered with the US National Centers for Environmental Prediction to adapt its Climate Forecast System to Indian conditions. Dynamical models simulate the physics of ocean and atmosphere rather than relying on past correlations, which is what allows them to see an El Niño developing in a way statistical predictors could not in 2002 or 2009.
Another drought the forecast missed Forecast miss
Even the late-June update, issued after the season had begun badly, was well above the outcome. The government later told Parliament that El Niño had had a stronger impact than the models expected. Together with 2002 and 2004, the 2009 failure discredited purely statistical seasonal forecasting.
A statistical ensemble system Method
Instead of one regression equation, the system ran many statistical models with different combinations of predictors and averaged them. It reduced dependence on any single relationship, but as 2009 showed, all the models still drew on the same kind of historical correlations.
A second miss in three years Forecast miss
A paper in IMD’s journal Mausam by R. Jenamani and colleagues, ‘Another deficient monsoon 2004: a comparison with drought year 2002 and possible causes’, examined why. Both seasons had normal-looking forecasts and both broke down in July. The repetition showed that 2002 had not been a one-off.
Two-stage forecasts begin Method
The two-stage format, an April forecast followed by an update with more recent data, survives today, with the update now issued in the last week of May. The 16-parameter model was replaced by smaller models after several of its predictors lost their link with monsoon rainfall.
The forecast that missed a severe drought Forecast miss
IMD’s history describes how rapid warming of sea-surface temperatures in the central equatorial Pacific after the forecast was issued suppressed the monsoon, and that no group in India or abroad anticipated it. Kharif crops failed across large parts of the country. The episode triggered the review that produced the 2003 changes.
The 16-parameter power regression model Method
Associated with the scientist Vasant Gowariker, the model replaced qualitative forecasts with a number that could be checked. Between 1988 and 2001 it delivered a run of reasonable forecasts, which helped build the confidence that 2002 then shattered.
1924
Gilbert Walker and the Southern Oscillation Institution
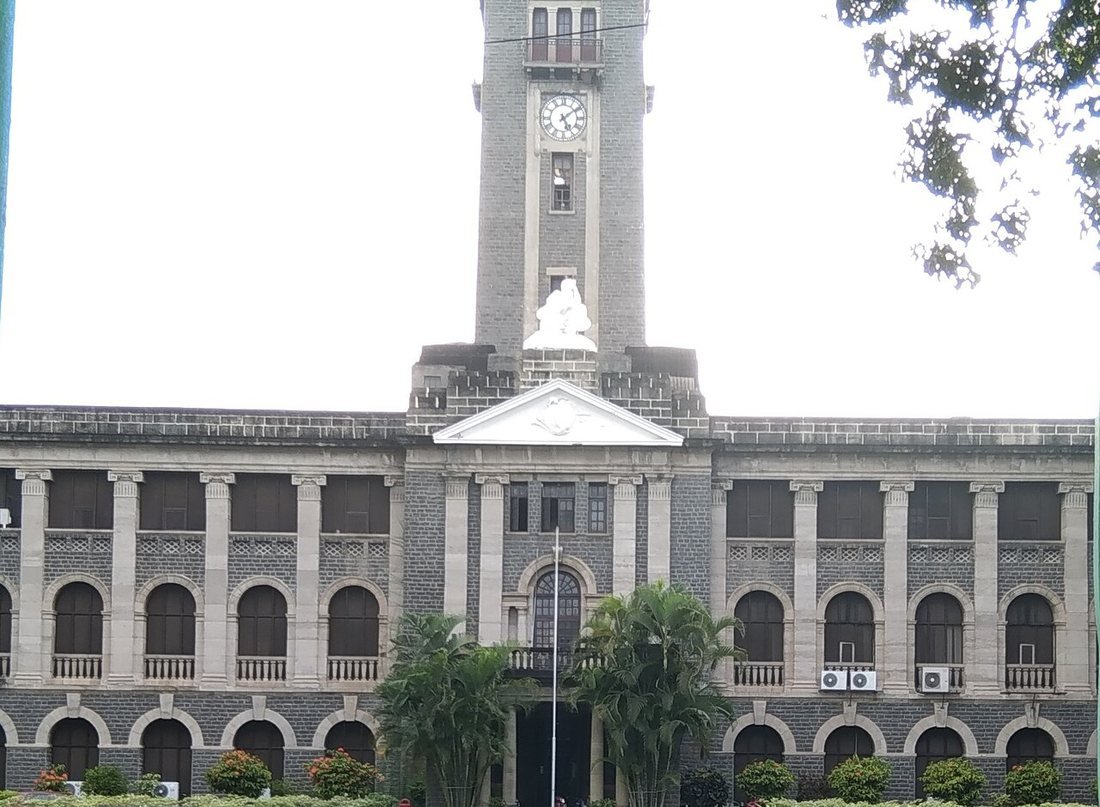
Working with hand calculations, Walker’s team searched global records for anything that correlated with the monsoon. Among the patterns they found was the Southern Oscillation, a see-saw of air pressure between the Pacific and Indian Oceans, now known to be linked with El Niño. His regional forecasts ran until the North-East India forecast was dropped in 1935.

1893
Forecasts widen Method
Within a few years of the first forecast, IMD had added mid-season and winter outlooks, the beginning of a forecast calendar that now runs from April to September.
1886
The first regular monsoon forecast Method
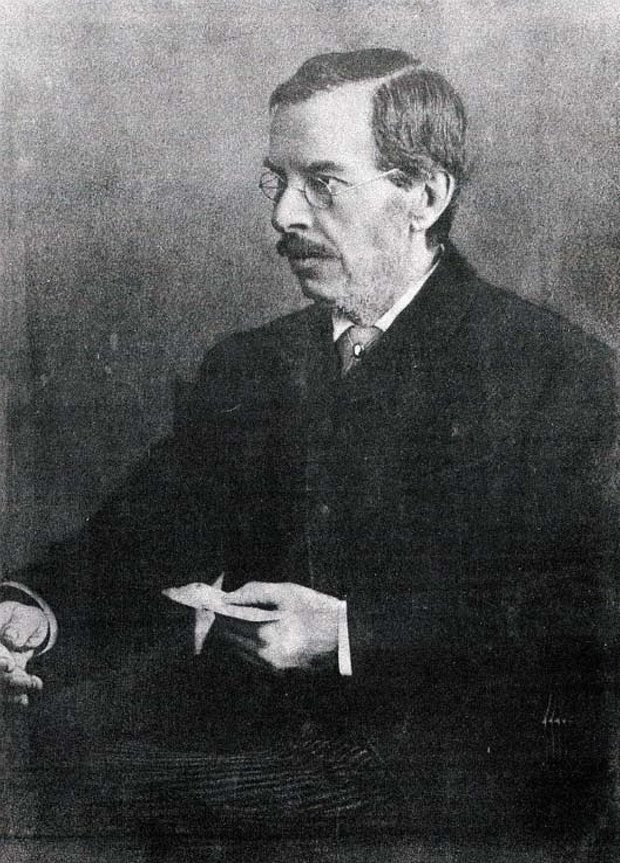
India became one of the first countries to issue a regular long-range seasonal forecast. Blanford’s method rested on one empirical link: more snow in the Himalayas in winter and spring tended to mean a weaker monsoon. Versions of that snow predictor were still in IMD’s models more than a century later.
1885
Tentative forecasts from Himalayan snow Method
After the famine of 1877, the government wanted warning of a failing monsoon. Blanford’s early trials gave enough promise for the department to commit to a regular forecast.
The India Meteorological Department is founded Institution
Before 1875, weather observation in India was handled by separate provincial services with no common standards. A central department made it possible to collect comparable data across the country, the foundation for every forecast that followed. IMD moved from Calcutta to Shimla, then to Pune in 1928 and finally to New Delhi.
The Scorecard: Forecast vs Actual
Pick a year to see how close IMD got, then compare the record before and after 2021.
Choose a year to compare IMD’s seasonal forecast with what actually fell.
–
The forecast shown is the latest one issued before the season (the late-May or June update where there was one). Actual figures are IMD’s all-India June–September totals.
| Year | Forecast (% of LPA) | Actual | Verdict |
|---|---|---|---|
| 2002 | 101 | about 81 | Major miss; severe drought |
| 2004 | about 100 | about 87 | Miss; deficient season |
| 2009 | 96 (April), 93 (June) | about 77 | Major miss; drought |
| 2018 | 97 | 91 | Miss |
| 2019 | 96 | about 110 | Miss; wet season underestimated |
| 2020 | 102 | 109 | Miss |
| 2021 | 101 | 99 | Within range |
| 2022 | 99 (April), 103 (May) | about 106.5 | Within range |
| 2023 | 96 | 94.4 | Within range |
| 2024 | 106 | 108 | Within range |
| 2025 | 105 (April), 106 (May) | 108 | Within range |
| 2026 | 92 (April), 90 (May) | 87 | Within range; deficient season called in advance |
Values are rounded all-India figures. The 2009 April forecast of 96% is used for the headline error; the June update was 93%.
How Much Has Accuracy Improved?
| Period | Average absolute error | What changed |
|---|---|---|
| 2017–2020 | 7.5% of LPA | Mainly statistical system; three large misses |
| 2021–2024 | 2.28% of LPA | Multi-model ensemble with MMCFS, monthly forecasts |
| 2023–2025 | 1.9% of LPA | Every year inside the ±4% range |
| 2026 | 3 points (May forecast) | Deficient year forecast as below normal |
These figures measure one thing: the error in the all-India June–September total. They are the government’s own numbers, given in replies to Parliament in December 2025 and February 2026. They do not show that every monthly, regional or heavy-rain forecast improved by the same margin, and a four-year average can be moved a lot by a single year, as 2019 showed.
What Does ‘% of LPA’ Mean?
Slide to any all-India rainfall figure to see IMD’s category and what it means in millimetres.
LPA = 868.6 mm, the 1971–2020 June–September average for India as a whole.
Why Monsoon Forecasts Still Miss
The drivers IMD itself lists when explaining errors.
El Niño can arrive late or strong
El Niño years tend to be drier, but timing and strength matter. In 2002 the warming came after the forecast; in 2009 its impact was stronger than expected. In 2026 the models saw it coming in April.
The Dipole can cancel El Niño
A positive Indian Ocean Dipole can boost rain even in an El Niño year. It helped make 2019 an excess season after a normal forecast.
Breaks and bursts
A single dry month can sink a season, as July did in 2002 and 2004 and August did in 2023. Seasonal models struggle to predict these swings months ahead.
Low-pressure systems are hard to model
Monsoon depressions bring much of central India’s rain. The government’s February 2026 reply said models’ difficulty simulating them reduces early accuracy there.
One number, many monsoons
In 2026 Central India got 97% of its average and the south 76%. A national forecast cannot capture that spread.
A shifting baseline
Heavier downpours with longer dry gaps between them make the distribution of rain harder to predict, even when totals are right.
What IMD’s Journey Teaches
Judge a forecast by the question it answers. An accurate seasonal number can sit alongside a district flood or a regional drought. In 2026 the national forecast was right while the north-east, expected to be near normal, ended 26% short.
Correlations age; physics travels better. The 1988 model worked for a decade and then broke down as its predictors lost their link with the monsoon. Dynamical models that simulate the ocean and atmosphere were what finally allowed IMD to see an El Niño year in advance.
Uncertainty is part of the forecast. Since 2021 IMD has published probabilities for each rainfall category alongside the headline number, which is more useful to a reservoir manager than a single percentage.
What Comes Next
The next frontier is resolution and lead time rather than the all-India total. The Bharat Forecast System runs at 6 km, the Uttar Pradesh pilot at 1 km, and the AI monsoon-advance forecast reaches sub-district level four weeks ahead. Mission Mausam is funding more radars and automatic weather stations to feed them.
AI models are now part of the operational mix, but IMD uses them alongside physical models, and their record over a full range of monsoon years is still short. The real test is whether these products give farmers, cities and disaster agencies usable warning of dry spells and extreme rain, not just a better national number.
Explore More Timelines
People Also Ask
Frequently Asked Questions
Conclusion: From a Snow Rule to Seeing El Niño Coming
India’s monsoon forecast began in 1886 as a single empirical rule and became, by 2026, an ensemble of climate models, satellites, radars and AI. The failures of 2002, 2004 and 2009 were the turning point: they showed that correlations alone could not see a drought coming, and they led to the Monsoon Mission and the 2021 overhaul.
The 2026 season was the clearest test yet. IMD forecast a below-normal monsoon in April, and it was right. The challenge now is to be as right about where and when the rain falls as about how much falls across India.
Related AiTimeline Stories
⚠️ Editorial Note
Forecast and rainfall figures are all-India June–September totals as a percentage of the Long Period Average, taken from IMD press releases, IMD’s history of long-range forecasting and Ministry of Earth Sciences replies to Parliament. Figures for 2002, 2004 and 2009 are rounded. Accuracy statistics describe the national seasonal forecast only, not regional, district or heavy-rainfall warnings. 2026 regional figures are from IMD’s end-of-season data as reported. This article is not a weather advisory; check IMD for current forecasts. Events after 19 October 2026 are not covered.
Sources & further reading
Every dated entry above was checked against these references. Last reviewed 19 October 2026.
- History of Long Range Forecasting in India
- Parliament Question: Monsoon Forecast Accuracy and Improvements (12 Feb 2026)
- Parliament Question: Operational Forecasting and Monitoring Mechanisms (3 Dec 2025)
- Long Range Forecast for the 2026 Southwest Monsoon Season Rainfall (13 April 2026)
- Updated Long Range Forecast for the 2026 Southwest Monsoon (29 May 2026)
- AI-enabled Systems Introduced by IMD to Provide Hyper-Local Weather Forecasts (12 May 2026)
- Another deficient monsoon 2004: a comparison with drought year 2002 and possible causes
- 2026 monsoon ends with nearly 13% rain deficit, worst since 2015: IMD
- How AI is helping 38 million farmers with advance weather predictions
- Imprint of El Niño and other weather patterns on India's deficit June 2026 rainfall
- IMD got only two monsoon forecasts right in past decade