Climate Change: India’s Rising Storm Risk & Global Impact
Is climate change giving India more cyclones? Not simply. Warmer seas, heavier rain, rising seas and exposure are reshaping storm risk. Data and timeline.
Latest Story
India is not simply getting more storms. The risk is changing shape. The country is warmer than at any time since records began, heavy rain bursts are more intense, the Arabian Sea is producing more severe cyclones, sea level is rising and more people and assets sit on exposed coasts and in crowded cities. Yet the total number of cyclones has not risen, and in 2026 not one had formed by late September. This article explains how climate change is changing India’s storm risk, what the records do and do not show, and why it matters beyond India’s borders.
💡 Short Answer
Climate change is raising India’s storm risk mainly through heavier rain, warmer seas, rising sea level and stronger storms in some basins, not through more cyclones overall. Yearly North Indian Ocean cyclone counts fell over 1951-2018, but Arabian Sea very severe cyclones rose about 150% in 2001-2019. 2024 was India’s warmest year; 2025 extreme weather killed about 2,760 people. Early warnings have cut cyclone deaths sharply.
India’s Storm Risk: Key Questions
India’s Changing Storm Risk in Ten Lines
- Hotter: 2024 was India’s warmest year since 1901; 10 of the 15 warmest came in 2011-2025.
- Not more cyclones: yearly North Indian Ocean counts fell over 1951-2018; 2026 had none by late September.
- Stronger in the west: Arabian Sea very severe cyclones rose about 150% in 2001-2019.
- Heavier bursts: localised heavy rain rose over 1951-2015, even as dry spells lengthened.
- Uneven rain: in 2025 the northwest got 127% of its monsoon normal while the east got 80%.
- Higher water: North Indian Ocean sea level rose about 3.3 mm a year in 1993-2017.
- Rain kills more than wind: 2025’s ~2,760 weather deaths were mostly floods, landslides and lightning.
- Exposure matters: more than 80% of Indians live in districts at risk of climate disasters.
- Warnings work: Odisha went from about 10,000 cyclone deaths in 1999 to 64 in 2019.
- Global stakes: Indian floods and storms can hit supply chains, shipping and food prices worldwide.
First: Cyclone Frequency Is Not Cyclone Risk
Why “more storms” is the wrong headline.
Bay of Bengal vs Arabian Sea
India’s Ministry of Earth Sciences, in its 2020 national climate assessment, found that the annual frequency of cyclones over the North Indian Ocean declined between 1951 and 2018, while very severe post-monsoon cyclones became more frequent over 2000-2018. A 2021 study led by the Indian Institute of Tropical Meteorology in Climate Dynamics found the split is geographic: the Arabian Sea became markedly more active, with cyclone intensity up by about 20-40% depending on season, while Bay of Bengal storm numbers slipped.
So the scientifically stronger statement is: climate change can alter cyclone intensity, rainfall and duration, while changes in frequency vary by basin, season and category. And storms are only one route to disaster. In 2025 cyclones killed 11 people in India. Rain, floods, landslides and lightning killed more than 2,600.
Which sentence best describes India’s storm problem?
Pick one. Then see what the records actually show.
Choose A, B or C.
Signal One: A Warmer India
Temperature is where every other change starts.
IMD’s statement for 2025 puts the long-term warming of India’s annual mean temperature at about 0.68°C per century since 1901, with daytime highs rising faster than night lows. The decade 2016-2025 was the warmest on record. 2025 itself opened with the warmest January-February season ever recorded, before a cooler monsoon pulled the annual figure down to eighth place.
The global picture is the same. The WMO’s State of the Global Climate 2025 says 2015-2025 were the 11 warmest years on record, with 2025 about 1.43°C above pre-industrial levels. Its Asia report adds that the region’s warming in 1991-2025 was roughly twice as fast as in 1961-1990. And in April 2026 a World Weather Attribution study found the pre-monsoon heatwave over northwest India and Pakistan was three times more likely because of climate change.
Signal Two: Rain Is Becoming More Extreme, Not Just More
Averages hide the bursts that cause floods.
A warmer atmosphere holds roughly 7% more water vapour per degree Celsius. That does not make it rain more everywhere. It means that when a monsoon trough, depression or cyclone wrings out the air, the heaviest bursts can be heavier. The Ministry of Earth Sciences reports that localised heavy rain events increased across India over 1951-2015, while droughts also became more frequent and widespread. The IPCC finds heavy precipitation has increased over much of Asia and will intensify further with every increment of warming.
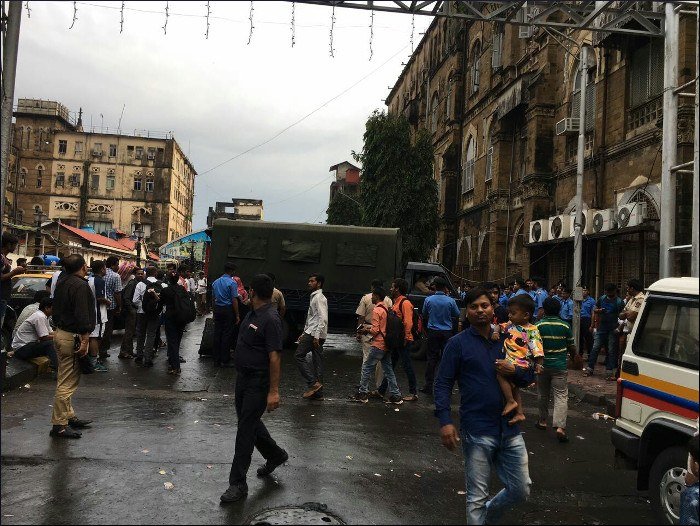
The result is a country that can have too little rain and too much rain in the same year. 2025 delivered 110% of normal annual rain and a record-wet May, yet east and northeast India ended the monsoon at 80%. In 2026, under a strong El Niño, the national monsoon ran roughly 12-15% below normal, and then a single September depression flooded Odisha and Uttar Pradesh.
Signal Three: Warmer Seas and Faster Storms
What the ocean is doing, and why the Arabian Sea matters.
Cyclones draw their energy from warm water. The Ministry of Earth Sciences reports that the tropical Indian Ocean warmed by about 1°C over 1951-2015, faster than the global ocean average. WMO says Asian ocean heat content reached a new record in 2025, and marine heatwaves covered more than 10 million square kilometres of Asian seas in July to September.
Warm water alone does not build a cyclone. A storm also needs low vertical wind shear, a moist mid-atmosphere and an initial disturbance. That is why the monsoon months rarely produce cyclones despite warm seas, and why the two peak windows are April-June and October-December. It is also why rapid intensification is the forecaster’s nightmare: when all the ingredients line up over unusually warm water, a storm can jump categories in a day, as Ockhi did in 2017 and Tauktae in 2021, leaving fishing fleets and coastal towns less time to act.
The 2025 Cyclones
All four formed after the monsoon.
| Storm | Dates (2025) | Basin | Peak category | Impact |
|---|---|---|---|---|
| Shakti | 1-7 Oct | Arabian Sea | Severe cyclonic storm | No deaths in India |
| Montha | 25-30 Oct | Bay of Bengal | Severe cyclonic storm | 9 deaths, Andhra and Telangana |
| Senyar | 25-27 Nov | Strait of Malacca | Cyclonic storm | Deadly floods in Indonesia, Malaysia, Thailand |
| Ditwah | 26 Nov-1 Dec | Bay of Bengal | Cyclonic storm | 2 deaths in Tamil Nadu; 410 in Sri Lanka |
The Hidden Threat: Storm Surge on a Rising Sea
Wind gets the headlines, but storm surge, sea water piled onto the coast by a cyclone’s winds and low pressure, has historically been the biggest killer. It drove most of the deaths in 1977 and 1999. A surge that arrives at high tide is worse, and a surge that starts from a higher baseline sea level reaches further inland.
North Indian Ocean sea level rose about 3.3 mm a year over 1993-2017, per the Ministry of Earth Sciences, up from roughly 1.06-1.75 mm a year over 1874-2004. That sounds small, but it compounds: the same storm now starts from a higher waterline, over coasts where mangroves and wetlands have often been cleared for ports, roads and housing. Hazard and risk are not the same thing: the storm is the hazard; who and what stands in its way decides the damage.
India’s Storm and Climate Timeline, 1875-2026
Newest first. Storms, floods, records and the policies they triggered.
No cyclone, still deadly
A deep depression crosses the south Odisha and north Andhra coast near Kalingapatnam around 22-23 September. It never becomes a cyclone, yet its rain reaches far inland: Odisha evacuates more than 15,000 people, Andhra reports nine deaths, and Uttar Pradesh reports more than 80 as the remnant soaks the plains. By 29 September, 2026 still has no cyclonic storm over the North Indian Ocean.
Heat first, then a failing monsoon
A World Weather Attribution study finds the 15-29 April heatwave over northwest India and Pakistan was about 1°C hotter and three times more likely because of climate change; Akola hits 46.9°C on 26 April. IMD cuts its monsoon forecast to 90% of normal on 29 May as El Niño builds, and by August the season is running roughly 12-15% below normal, with the south and east hit hardest.
Eighth-warmest year, 2,760 deaths
India is 0.28°C above the 1991-2020 average, the eighth-warmest year since 1901. Rain is 110% of normal but badly uneven: northwest India gets 127% of its monsoon normal, east and northeast India only 80%. Four cyclonic storms form, all after the monsoon: Shakti (Arabian Sea), Montha, Senyar and Ditwah. IMD counts about 2,760 weather deaths, over 1,310 from lightning and thunderstorms and over 1,370 from rain, floods, cloudbursts and landslides.
India’s warmest year on record
India records its warmest year since 1901, 0.65°C above the 1991-2020 average. On 30 July, extreme rain triggers landslides in Wayanad, Kerala, killing more than 200 people. In September the Union Cabinet approves Mission Mausam, about ₹2,000 crore to upgrade radars, models and AI forecasting. INSAT-3DS, a new weather satellite, launches in February.
Biparjoy and a glacial lake burst
Cyclone Biparjoy forms in the Arabian Sea on 6 June and wanders for more than a week, one of the longest-lived storms recorded there, before landfall near Jakhau, Gujarat, on 15 June after more than 100,000 people are moved. On 4 October, the South Lhonak glacial lake in Sikkim bursts; the flood surges down the Teesta and breaches the Chungthang dam on the Teesta.
Tauktae runs up the west coast
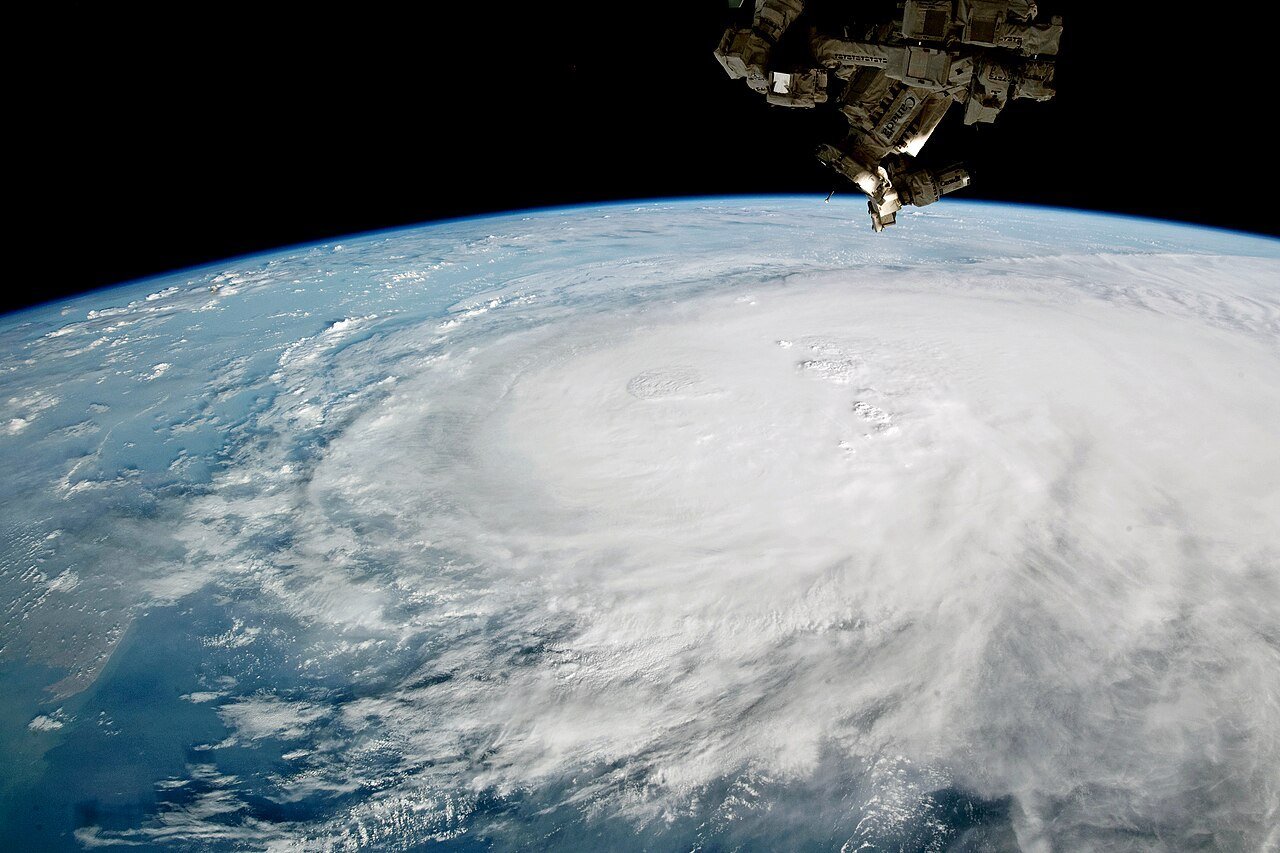
Cyclone Tauktae intensifies quickly off Kerala and Karnataka, skirts Goa and Mumbai, and strikes Saurashtra, Gujarat, as an extremely severe cyclonic storm on 17 May. The accommodation barge P305 sinks off Mumbai with heavy loss of life. A week later Cyclone Yaas hits Odisha from the Bay of Bengal.
Amphan, then Nisarga
Amphan becomes a super cyclonic storm over the Bay of Bengal, the strongest there since 1999, and makes landfall in the Sundarbans on 20 May. It becomes the costliest cyclone recorded in the North Indian Ocean, with damage estimated at more than US$13 billion. Two weeks later Nisarga hits near Alibag, the first cyclone to strike Maharashtra’s coast in June since 1891, by IMD records.
Fani and a record Arabian Sea year
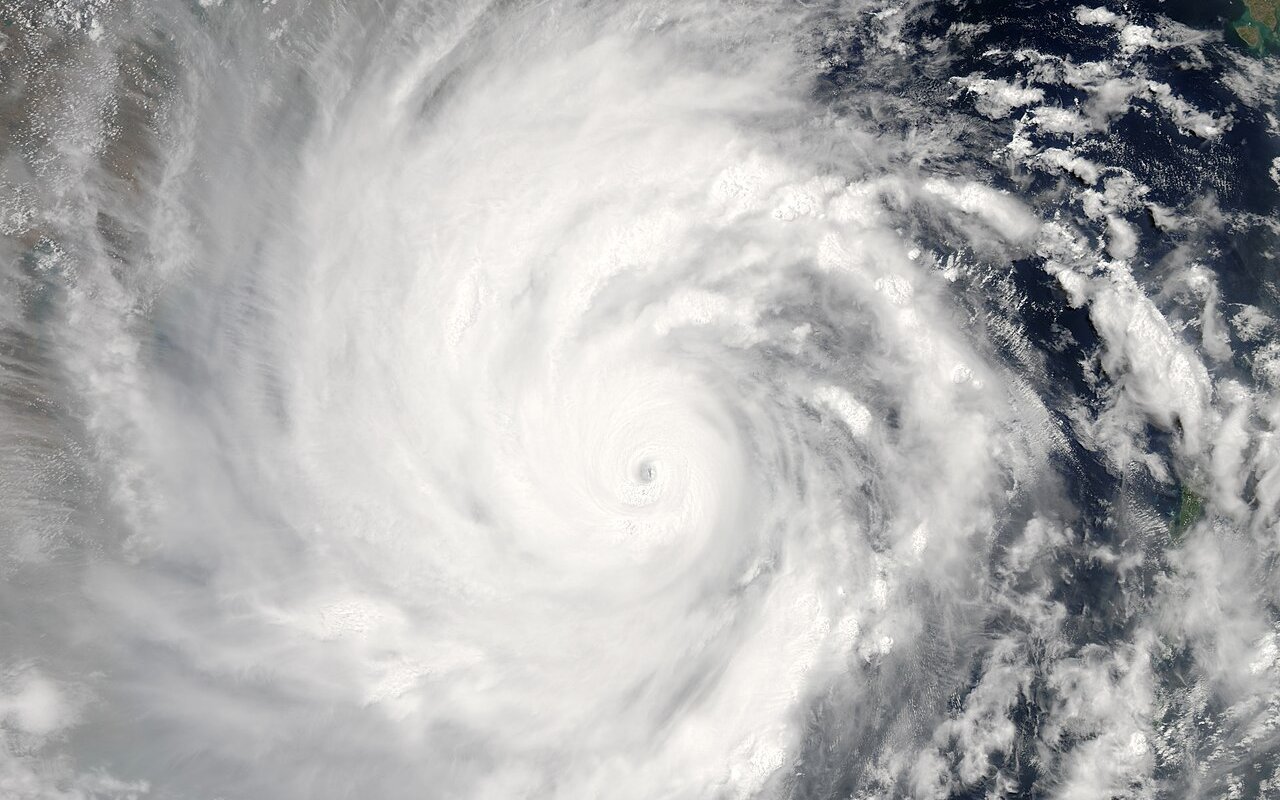
Cyclone Fani strikes Puri, Odisha, on 3 May as an extremely severe cyclone. About 1.2 million people are evacuated ahead of landfall, and the state records 64 deaths. Later that year the Arabian Sea has its most active season on record; Kyarr becomes a super cyclonic storm in October.
Ockhi and the Kerala floods
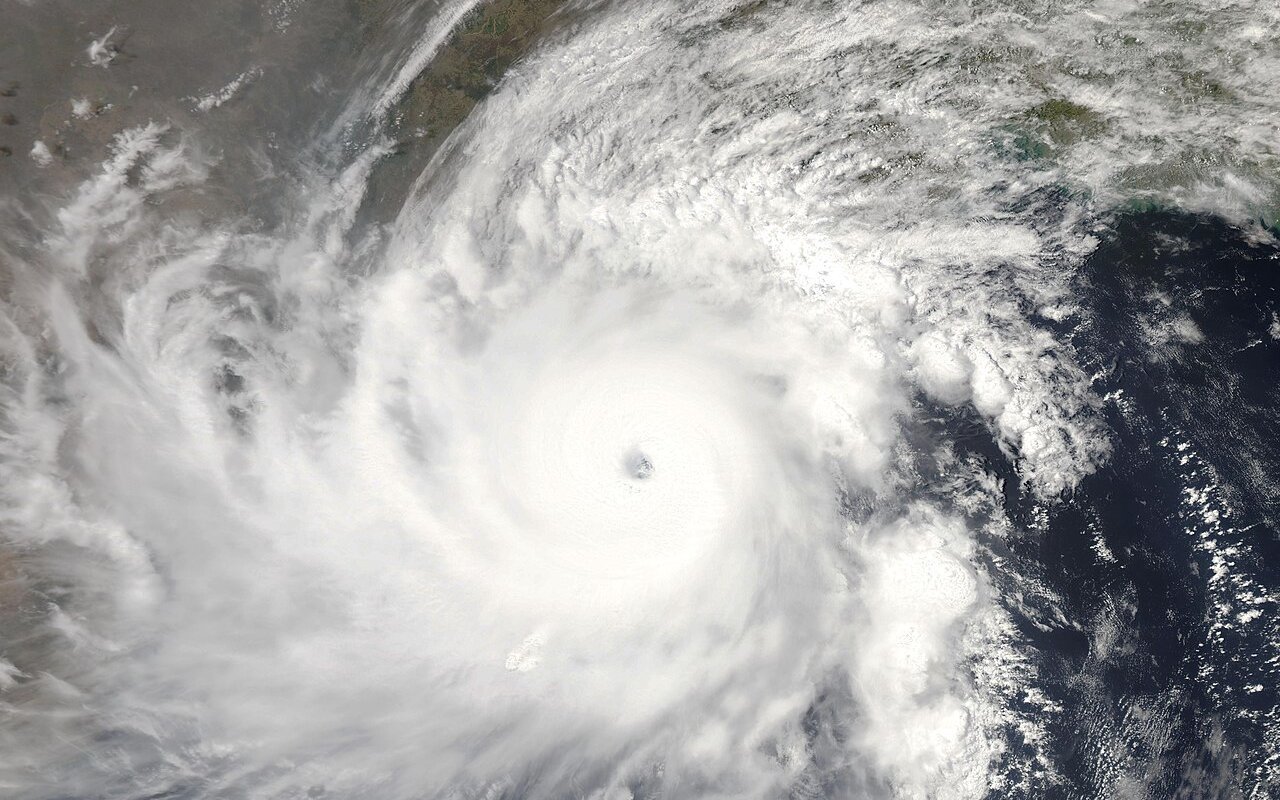
Cyclone Ockhi forms near Sri Lanka and intensifies rapidly into the Lakshadweep Sea, catching fishing boats from Kerala and Tamil Nadu at sea; hundreds of fishermen die or go missing. In August 2018, exceptional monsoon rain floods Kerala and kills about 480 people, the state’s worst flood since 1924.
Phailin shows warnings work
Cyclone Phailin, comparable in strength to the 1999 storm, hits Gopalpur, Odisha, on 12 October 2013. Close to a million people are evacuated and about 45 die. Months earlier, the June 2013 Kedarnath floods in Uttarakhand kill thousands. Hudhud hits Visakhapatnam in 2014, and in November 2015 Chapala becomes one of the strongest Arabian Sea storms on record before hitting Yemen.
Mumbai drowns, and a national plan
Santacruz records 944 mm of rain in 24 hours on 26 July 2005; Mumbai floods and more than 1,000 people die across Maharashtra. The Disaster Management Act follows in December 2005, creating the NDMA. In June 2007 Gonu becomes the first Category 5-equivalent storm on record in the Arabian Sea. India’s National Action Plan on Climate Change is released on 30 June 2008.
1999
The Odisha super cyclone
A super cyclone with winds around 260 km/h strikes near Paradip, pushing a storm surge several metres high across the coast. About 10,000 people die. In December Odisha sets up the Odisha State Disaster Management Authority, the first in India, and begins building the cyclone shelters and village drills later credited with saving lives.
The Andhra cyclone
A severe cyclone and storm surge sweep the Krishna delta; the toll is commonly put at about 10,000 people. The disaster pushes India toward a coastal cyclone warning network and, in time, cyclone-shelter programmes in Andhra Pradesh.
Measuring begins
The India Meteorological Department is established in 1875, after the 1864 Calcutta cyclone and monsoon failures in 1866 and 1871 exposed the need for organised weather warnings. IMD’s nationwide temperature series begins in 1901, the baseline for every ranking in this article.
One hypothetical cyclone. Four different worlds around it.
The storm’s winds stay fixed. Move the slider to change the climate and the city around it, then switch adaptation on or off.
Educational model with illustrative values. Sea-level figures follow IPCC global ranges; rainfall uses the roughly 7% more moisture per °C rule. This is not a forecast for any real storm or city.
The Himalayas Add a Second Front
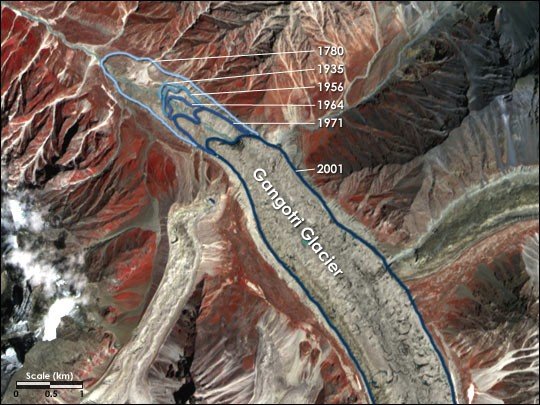
India’s storm risk is not only coastal. The Hindu Kush Himalaya warmed about 0.2°C per decade over 1951-2014, per the Ministry of Earth Sciences. Glaciers are retreating, glacial lakes are growing, and heavy rain on steep, unstable slopes triggers landslides and flash floods: Kedarnath in 2013, Chamoli in 2021, the South Lhonak lake outburst in Sikkim in 2023. WMO reports that all 23 monitored glaciers in high-mountain Asia lost mass in 2025, with several glacial lake outburst floods and glacier collapses.
The chain runs downhill: Himalayan warming → glacier and snow loss → changing river flows → flood and water-security risk → farms, cities and hydropower downstream.
Six regions, six different risk mixes
Risk = hazard × exposure × vulnerability. Tap a region.
Why Exposure Is Growing Faster Than the Hazard
The World Bank says more than 80% of Indians live in districts at risk of climate-induced disasters, and that economic losses from extreme weather doubled over the past decade. Cities are the sharpest edge: concrete stops rain soaking in, encroachment narrows drains and lakes, and storm drains built for older rainfall intensities overflow when a cloudburst arrives. On 26 July 2005 Mumbai’s Santacruz station recorded 944 mm in 24 hours, and the city stopped.
Water adds a paradox. India has about 18% of the world’s people and around 4% of its freshwater, and most of its rain falls in four monsoon months. NITI Aayog has estimated that some 600 million people face high to extreme water stress. The same district can flood in August and run dry by April, so flood walls alone are not adaptation; storage, groundwater recharge, watershed restoration and drainage have to move together.
Agriculture feels both ends. Farmers need rain at the right growth stage, not the right annual total. Heat stresses crops, livestock and outdoor workers; waterlogging and flood destroy standing crops; drought drains aquifers.
What Actually Killed People in 2025
IMD Statement on Climate of India 2025.
| Cause (2025) | Deaths | Notable |
|---|---|---|
| Heavy rain, floods, cloudbursts, landslides | 1,370+ | Maharashtra 210+; J&K 63 in one cloudburst (14 Aug) |
| Lightning and thunderstorms | 1,310+ | Uttar Pradesh 310+; 152 deaths in 13-17 June alone |
| Heat waves | ~35 | Uttar Pradesh about 20 on 13 June |
| Cyclones | 11 in India | Montha 9, Ditwah 2 |
| All extreme weather | ~2,760 | Worst: UP 410+, MP 350+, Maharashtra 270+ |
From Storm to Supply Chain
India’s growth increasingly depends on interconnected manufacturing, logistics, ports and digital infrastructure. A storm that shuts a Gujarat port, an Andhra pharma cluster or a Chennai electronics corridor becomes a supply-chain event for buyers in Europe, the Gulf and the United States. India is a major exporter of generic medicines, rice, textiles, chemicals and engineering goods, and it sits beside Indian Ocean shipping lanes that carry much of the world’s oil and container trade. WMO’s Asia reporting stresses the same point: climate extremes in the region increasingly ripple into economies, food security and development far away.
The Other Trend: India Got Much Better at Warning People
The strongest evidence that risk can be cut.
| Lead time | 2024 track error | 2019-23 average |
|---|---|---|
| 24 hours | 56 km | 72 km |
| 48 hours | 110 km | 112 km |
| 72 hours | 174 km | 156 km |
IMD’s verification data for 2003-2025 show cyclone track errors falling and skill rising; in 2024 the average 24-hour track error was 56 km. Better tracks let authorities start evacuations a day or more before landfall. Odisha’s model, built after 1999, links that forecast to village-level shelters, volunteers and drills. It is why Phailin and Fani, storms of similar strength to 1999, killed dozens rather than thousands.
The chain has to hold at every link: forecast → warning → message reaches people → people understand it → they move → response → recovery. WMO’s Early Warnings for All push is built on the same idea. Weak links remain: rain-driven floods and lightning give far less notice than a cyclone, and fishermen at sea, migrant workers and people in informal housing are still the hardest to reach.
New tools are arriving. INSAT-3DS (February 2024) tracks storms every few minutes; Mission Mausam (September 2024, about ₹2,000 crore) funds radars, high-resolution models and AI; and India’s private radar-satellite firms can map floods through cloud. AI does not replace physics: the strongest systems combine satellites, radar, ground stations, physical models, AI and human forecasters who know what a warning means on the ground.
Science Check: What Climate Change Does, and Doesn’t, Mean
| Claim | Verdict | Why |
|---|---|---|
| Climate change means more cyclones every year | Not supported | Too simple. Yearly counts fell over 1951-2018; trends differ by basin. |
| Extreme rainfall can become more intense | Supported | Strong evidence: localised heavy rain rose in 1951-2015. |
| A warmer atmosphere holds more moisture | Supported | Physics: about 7% more water vapour per °C. |
| Every Indian region will get wetter | Not supported | No. Dry spells and droughts also increased; 2025 east India got 80%. |
| Sea-level rise raises coastal flood risk | Supported | Strong evidence: about 3.3 mm/yr in the North Indian Ocean since 1993. |
| Every cyclone is caused by climate change | Not supported | Incorrect. It shifts background conditions, not every storm. |
| Climate change can make some cyclones stronger | Supported | Yes, especially evident in the Arabian Sea. |
| One disastrous monsoon proves climate change | Not supported | One season cannot establish a trend. |
| India’s climate risk is rising | Supported | Warming, rain extremes, sea level and exposure all point up. |
| Adaptation reduces losses | Supported | Odisha: about 10,000 deaths in 1999, 64 in 2019. |
Climate change changes the odds and the background conditions. It does not dictate every individual storm.
🤔 Did You Know?
- IMD was created in 1875, after the 1864 Calcutta cyclone and the monsoon failures of 1866 and 1871.
- The Odisha State Disaster Management Authority, set up in December 1999, was India’s first state disaster body.
- Cyclone names in the North Indian Ocean come from a list contributed by 13 countries; Arnab, from Bangladesh, is next in line.
- Cyclone Senyar in November 2025 formed in the Strait of Malacca, an extremely rare location for a tropical cyclone.
India’s Climate Dilemma
Adapt
Protect people, farms, cities and infrastructure from warming already under way: shelters, drains, heat plans, crop varieties, insurance.
Mitigate
India is the world’s third-largest emitter in total, though low per person. Slowing emissions growth limits future risk.
Develop
Hundreds of millions still need better housing, power and jobs, and poverty is itself a driver of vulnerability.
Finance
Adaptation costs money now; disasters cost more later. The question is shifting from “can we afford it?” to “what does not adapting cost?”
The Bigger Question
The most useful question for India is not “will there be more storms?” The records say the total count is not the problem. It is “can India make its cities, farms, coasts, water systems and infrastructure resilient faster than the risk is changing?”
The evidence shows a hotter India, more intense rain bursts, a warmer and higher sea, a more dangerous Arabian Sea, and far more people and assets in harm’s way. It also shows that better forecasts save lives: Odisha’s fall from 10,000 cyclone deaths to 64 is one of the clearest adaptation successes anywhere. The contest is not climate change against India. It is rising risk against rising resilience, and its outcome will shape how every fast-growing, climate-exposed economy copes with the decades ahead.
Quiz: India’s Storm and Climate Risk
Tap a question to reveal the answer.
1. What was India’s warmest year on record?
2. How many cyclonic storms formed over the North Indian Ocean in 2025?
3. In which basin did very severe cyclones rise about 150% in 2001-2019?
4. What killed the most people in India’s 2025 extreme weather?
5. How many people died in Odisha during Cyclone Fani in 2019?
6. How fast has North Indian Ocean sea level risen since 1993?
7. What share of Indians live in districts at risk of climate disasters, per the World Bank?
Explore More Timelines
People Also Ask
Frequently Asked Questions
Related AiTimeline Stories
⚠️ Editorial Note
This article separates observed trends from projections and from single events. Indian observations are from IMD’s Statement on Climate of India 2025 (1 January 2026), IMD/RSMC New Delhi cyclone verification, and the Ministry of Earth Sciences’ 2020 Assessment of Climate Change over the Indian Region; basin trends from Deshpande et al. (2021, Climate Dynamics); global and Asian indicators from WMO’s 2025 reports; exposure figures from the World Bank. 2026 events are from IMD bulletins and news reports and may be revised. Corrections made to circulating summaries: IMD counts about 2,760 weather deaths in 2025, not 2,690, with over 1,310 from lightning and thunderstorms and over 1,370 from rain, floods and landslides; the 15 cyclonic disturbances were 4 cyclonic storms plus 11 depressions; and the 2025 regional contrast refers to the monsoon season (northwest 127%, east and northeast 80% of normal). Interactive values are illustrative, not forecasts.
Sources & further reading
Every dated entry above was checked against these references. Last reviewed 29 September 2026.
- IMD: Statement on Climate of India during 2025 (1 January 2026)
- Ministry of Earth Sciences: Assessment of Climate Change over the Indian Region (2020)
- Deshpande et al. (2021), Changing status of tropical cyclones over the north Indian Ocean, Climate Dynamics
- WMO: Extreme heat and rainfall, glacier loss and record ocean heat impact Asia in 2025
- WMO: State of the Global Climate 2025
- World Bank: Advancing climate adaptation and building resilience in India (2023)
- IMD RSMC New Delhi: Annual cyclone forecast verification report 2024
- World Weather Attribution: pre-monsoon heat in South Asia, April 2026