India Metro Rail Timeline 2026: How 1,100+ km of Lines Transformed Urban Transit — and Why Ridership Lags
Follow India metro rail from Kolkata 1984 and Delhi 2002 to 1,159 km across 26 cities in 2026, with ridership data and the last-mile challenge.
Latest Story
In little more than two decades, India went from a single experimental underground line in Kolkata to a metro and regional-rail network the government now reports at 1,159 km across 26 cities as of the Monsoon Session of Parliament in July 2026 — the world’s third-largest, behind only China and the United States. That headline number, though, hides a harder story. Government and independent data both show that several of India’s newer metro systems are carrying a fraction of the daily riders their own project reports predicted, while a handful of older, denser networks carry the overwhelming majority of the country’s roughly 1.1–1.2 crore daily metro trips. This page tracks every major milestone from 1984 to today, and then asks the question the network-length headlines usually skip: is India’s metro boom becoming the everyday transport backbone it was designed to be?
July 2026: MoHUA told Parliament’s Monsoon Session the operational metro/RRTS network had reached 1,159 km across 26 cities, with roughly 886 km under construction across 30 projects and ₹30,942 crore earmarked for FY2026-27.
June 2026: Bengaluru’s BMTC buses began accepting the National Common Mobility Card alongside Namma Metro, via 11,000 new ETMs — the clearest 2026 step toward one-card multimodal travel outside Delhi and Mumbai.
April 2026: The Union Cabinet approved Jaipur Metro Phase 2 — a 41 km, 36-station corridor from Prahladpura to Todi Mod, costing ₹13,037.66 crore.
February 2026: The full 82 km Delhi–Meerut Namo Bharat corridor, including the Meerut Metro’s shared section, opened for commercial service on February 22; the first full day of combined operation recorded over 100,000 rides.
📌 How Much Metro Does India Have in 2026? — AI Overview
As of July 2026, India’s Ministry of Housing and Urban Affairs reported an operational metro and RRTS network of 1,159 km across 26 cities, up from 248 km in 5 cities in 2014. India is the world’s third-largest metro network by this measure, behind China and the United States. But network length has grown faster than ridership on several newer lines: independent analysis shows some corridors realizing only 8-35% of their original project-report ridership forecasts, while Delhi alone carries roughly 60% of the country’s daily metro trips.
India Metro Rail: Key Questions
Key Takeaways
- India’s operational network reached 1,159 km across 26 cities by July 2026, per MoHUA — up from 248 km in 5 cities in 2014.
- Kolkata, not Delhi, was India’s first metro — opened October 24, 1984, eighteen years before Delhi Metro.
- India ranks as the world’s third-largest metro network by length, behind China and the United States, though countries measure “metro” differently.
- National ridership has genuinely grown — past 11.2 million daily trips by 2025 — so “empty metros” is the wrong framing; uneven distribution is the real story.
- Independent research shows several systems running at just 8-35% of their original DPR ridership forecasts, with Delhi and Mumbai performing far closer to (or above) projections than smaller networks.
- Delhi’s 2019-20 books show an operating surplus but a net loss after debt servicing and depreciation — a distinction that matters when anyone claims a metro “makes money.”
- The Delhi-Meerut Namo Bharat corridor is not a city metro but a regional rapid-rail system — its full 82 km opened February 22, 2026.
- MetroLite and MetroNeo remain unbuilt as of August 2026 — both are still in DPR/pre-construction stage, not operating anywhere in India yet.
- The next expansion wave is Tier-2 focused: Jaipur Phase 2 (41 km, approved April 2026) plus Bengaluru, Pune, Surat and Bhopal projects already 60-95% physically complete.
How Much Metro Does India Actually Have?
Four different official numbers, one year — here’s why, and which one to use.
Ask “how many kilometres of metro does India have” in 2026 and you can get four different honest answers, because official releases used four different cutoffs and two different definitions in the same twelve months. A February 2026 industry compilation counted roughly 1,010 km across 20 cities, covering conventional metro only. By March 2026, government and press reporting had that figure at around 1,143 km, cited alongside India’s move into third place globally. A widely repeated spring figure put the total at 1,155 km. Then, in its Monsoon Session submission to Parliament (reported July 21, 2026), MoHUA gave the most current official figure: 1,159 km across 26 cities — a total that explicitly includes the Delhi–Meerut Namo Bharat RRTS corridor and the Meerut Metro’s shared infrastructure.
None of these numbers are wrong; they’re measuring slightly different things on different dates. This page uses 1,159 km / 26 cities (July 2026, metro+RRTS) as the headline current figure, and separately cites the ~1,010 km / 20 cities (February 2026, metro only) city-by-city breakdown wherever a like-for-like comparison across cities is needed, since that’s the most recent dataset with individual city figures attached. Roughly 886 km more is under construction across 30 projects, so the operational total will keep moving through 2026 and beyond.
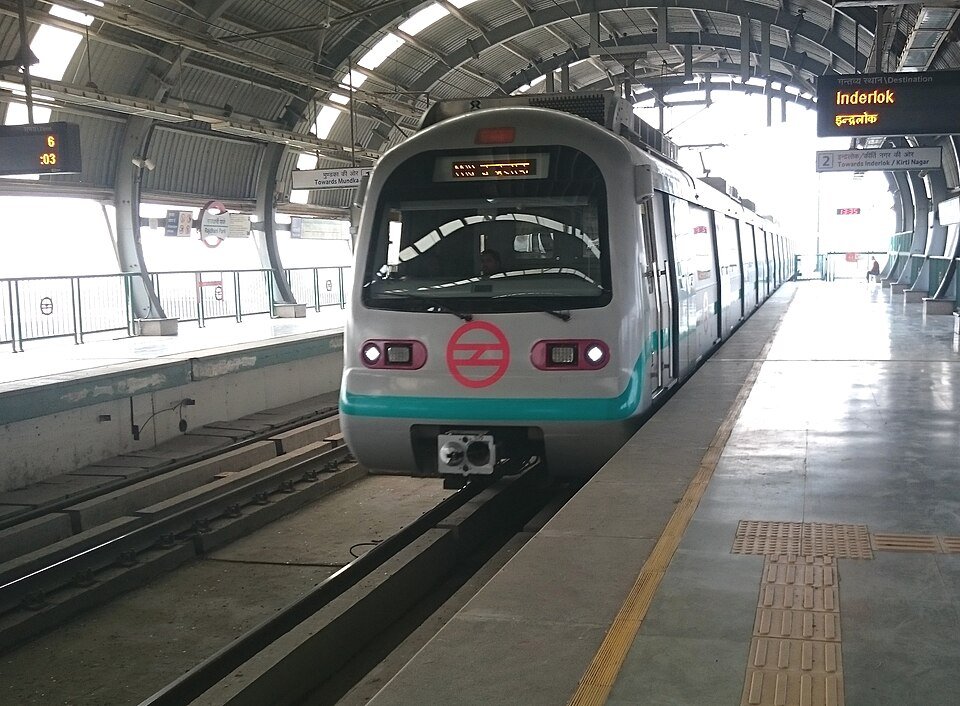
Delhi Metro at Inderlok interchange station — the network that still carries the largest single share of India’s daily metro ridership. Credit: Wikimedia Commons.
India Metro Rail Timeline: 1984–2026
Newest first — every confirmed milestone from Kolkata’s debut to the 2026 expansion wave.
MoHUA Reports 1,159 km Network to Parliament
What happened: The Ministry of Housing and Urban Affairs told the Monsoon Session that India’s operational metro and RRTS network had reached 1,159 km across 26 cities, with about 886 km under construction across 30 projects, and confirmed ₹30,942 crore earmarked for metro rail in the FY2026-27 Union Budget.
Why it matters: This is the most current official network figure as of this page’s last update, and the first to explicitly report a combined metro+RRTS total alongside a detailed under-construction pipeline.
Bengaluru Unifies Metro and Bus Ticketing on NCMC
What happened: From June 2026, BMTC buses across Bengaluru began accepting the National Common Mobility Card — the same contactless card Namma Metro riders had used since 2023 — via roughly 11,000 new Electronic Ticketing Machines installed under a four-year, ₹30 crore contract.
Why it matters: One of the clearest concrete steps toward the “one card, any transport mode” goal the 2017 Metro Rail Policy set out, following similar NCMC rollouts on Delhi’s DTC/DMRC/RRTS network (September 2025) and Mumbai’s Metro Line 3 (2025).
Jaipur Metro Phase 2 Approved
What happened: The Union Cabinet approved Jaipur Metro Phase 2: a 41 km North-South corridor with 36 stations running from Prahladpura to Todi Mod, at a total project cost of ₹13,037.66 crore, to be implemented by Rajasthan Metro Rail Corporation Limited, a 50:50 Centre-state joint venture.
Why it matters: Jaipur’s existing network is just 11.98 km — Phase 2 would more than quadruple it, and is a useful test of whether a second-phase corridor in a Tier-2 city can outperform Phase 1’s underwhelming ridership (see the ridership-paradox section below).
Full Delhi-Meerut Namo Bharat Corridor Opens
What happened: Prime Minister Narendra Modi inaugurated the complete 82 km Delhi-Meerut RRTS corridor from Sarai Kale Khan to Modipuram, alongside the Meerut Metro’s shared-infrastructure section, cutting end-to-end travel time to under 50 minutes. Commercial service began that evening; the first full day of combined operation (February 23) recorded over 100,000 rides — the corridor’s highest single-day figure to date.
Why it matters: This is India’s first fully operational Regional Rapid Transit System corridor — a new category of rail distinct from conventional metro (see the Metro vs Namo Bharat comparison below) — and the single largest driver of the jump in reported “metro+RRTS” network length in 2026.
India Confirmed as World’s Third-Largest Metro Network
What happened: The Union Housing and Urban Affairs Minister stated India had become the world’s third-largest operating metro network, behind China and the United States, with plans to expand metro presence to around 29 cities.
Why it matters: A milestone government statement, though “third-largest” rankings vary depending on whether a country’s total includes light rail, commuter rail or RRTS-equivalent systems alongside conventional metro — the comparison is not perfectly apples-to-apples across countries.
India’s First Underwater Metro Opens in Kolkata
What happened: On March 6, 2024, Prime Minister Modi inaugurated the Esplanade-Howrah Maidan stretch of the East-West Metro, including a 520-metre twin-tunnel section running 37 metres beneath the Hooghly River — India’s first underwater metro tunnel. Howrah Maidan, at 32 metres below ground, became the country’s deepest metro station.
Why it matters: A genuine engineering first for Indian metro construction, connecting Kolkata’s twin cities across the river for the first time by rail and completing a stretch of the East-West Metro that had been under construction for well over a decade.
Delhi Launches India’s First Driverless Metro Line
What happened: On December 28, 2020, Delhi Metro’s Magenta Line (Janakpuri West-Botanical Garden) became India’s first fully automated, driverless metro corridor, running under Unattended Train Operation with a train operator present for door supervision and emergencies.
Why it matters: Not every Delhi Metro line runs driverless — Magenta and later the Pink Line were retrofitted for automated operation, while older lines still run under manual/semi-automatic control. This is often over-generalized to “all Delhi Metro trains are driverless,” which is inaccurate.
National Metro Rail Policy Shifts Focus to Ridership and TOD
What happened: The Ministry of Housing and Urban Affairs issued India’s first Metro Rail Policy, making Transit-Oriented Development, multimodal integration, feeder-service planning, alternative-analysis studies and stricter ridership/economic appraisal mandatory for new project approvals, and formally opening the door to PPP financing.
Why it matters: A deliberate pivot from “build the line” to “build the line and the city around it” — the policy framework this page’s ridership and last-mile sections keep returning to, and the origin of lighter-cost alternatives like MetroLite and MetroNeo for smaller cities.
Metro Rail Spreads Beyond the Metros
What happened: Chennai (June 2015), Kochi (June 2017), Lucknow (September 2016) and Hyderabad (November 2017) all opened their first metro sections in this window, alongside Jaipur’s initial Pink Line stretch (June 2015) — the fastest multi-city expansion phase in Indian metro history to that point.
Why it matters: This is also the phase whose ridership performance is most scrutinized today — several of these systems are the ones later found running well below their original Detailed Project Report forecasts (see the ridership-paradox table below).
The 248 km / 5-City Baseline
What happened: By 2014, India’s entire operational metro network stood at roughly 248 km across five cities — Kolkata, Delhi, Bengaluru (from 2011), Chennai’s suburban-adjacent MRTS aside, and Gurgaon’s Rapid Metro. Annual central budgetary support for metro projects that year was ₹5,798 crore.
Why it matters: This is the fixed reference point every “India’s metro network grew Nx” claim on this page and elsewhere is measured against — a roughly 4.7x increase in length by mid-2026.
Namma Metro Begins in Bengaluru
What happened: Bengaluru’s Namma Metro opened its first stretch on October 20, 2011, beginning what would become one of India’s most consistently expanding networks, now approaching 100 km across the Purple, Green and Yellow lines.
Why it matters: Bengaluru illustrates a distinct problem from ridership shortfall elsewhere: strong underlying demand from the city’s tech corridor, but a network that has taken 15 years to approach full coverage of the routes commuters actually need, particularly the airport and Outer Ring Road IT corridor.
Delhi Metro Opens, Sets the National Template
What happened: Delhi Metro’s first section, on the Red Line, opened on December 24, 2002, under the Delhi Metro Rail Corporation. Built with strict project-management discipline and cost/time control, it became the institutional and engineering reference point for nearly every Indian metro project that followed.
Why it matters: Delhi Metro is now, at 353 km, India’s largest single network and still carries the country’s largest share of daily metro ridership — the clearest evidence that network scale, line density and interchange coverage compound each other over two decades rather than growing in a straight line.
Kolkata Metro — India’s First
What happened: Kolkata Metro began commercial service on October 24, 1984, between Esplanade and Bhowanipore (now Netaji Bhavan) — a modest initial stretch that made it not just India’s first metro but South Asia’s first underground rapid-transit railway. Construction had begun in 1972.
Why it matters: Kolkata, not Delhi, opened India’s first metro — a fact frequently misattributed. The line proved Indian engineering and construction firms could deliver underground heavy rail through some of the country’s most challenging urban geology, setting a precedent every later project built on.
₹ Lakhs of Crores Invested — Is Ridership Keeping Pace?
National ridership is genuinely growing. The real problem is which corridors are carrying it.
Start with what’s true: national daily metro ridership passed 11.2 million (roughly 1.12 crore) trips by 2025 and continues rising, so “Indian metros are empty” is simply wrong as a national claim. The real question is narrower and more useful: why do several newer or smaller systems carry only a fraction of the ridership their own Detailed Project Reports forecast, while a handful of mature networks carry the overwhelming bulk of daily trips?
An April 2026 policy analysis compiling government and research data put a number on that gap. Comparing early-2020s Detailed Project Report (DPR) forecasts against actual ridership recorded between 2017 and 2020, it found: Delhi realizing 38-79% of projections (the range reflects different counting methodologies over time), Mumbai 74% (by 2019-20), Bengaluru 27%, Chennai 13%, Hyderabad 15.2%, Kochi 14.5%, Lucknow 8.6%, Jaipur 7.6%, and Kanpur as low as 2%. Across the board, the analysis concluded most corridors nationally were realizing only 25-35% of planned ridership. A newer example: Mumbai’s 33.5 km Aqua Line (Metro 3) was carrying roughly one-tenth of its projected 1.5 million daily riders as of early 2026.
| System | DPR ridership realized | Data period | Read this as |
|---|---|---|---|
| Delhi | 38-79% | 2017-20, varies by counting method | Best-performing large network; still below plan |
| Mumbai (older lines) | ~74% | By 2019-20 | Closest to forecast among major metros |
| Mumbai Aqua Line (Metro 3) | ~10% | Early 2026, of 1.5m/day target | New underground line still ramping up |
| Bengaluru | ~27% | 2017-20 | Incomplete network at time of measurement |
| Chennai | ~13% | 2017-20 | Well below plan; Phase 2 aims to fix gaps |
| Hyderabad | ~15.2% | 2017-20 | PPP-financed; large network, low uptake |
| Kochi | ~14.5% | 2017-20 | Small network; limited catchment |
| Lucknow | ~8.6% | 2017-20 | Single corridor; weak feeder connectivity |
| Jaipur | ~7.6% | 2017-20 | 11.98 km Phase 1; Phase 2 approved April 2026 |
| Kanpur | ~2% | 2017-20, earliest years | Newest system; only a partial corridor open |
DPR-vs-actual figures compiled from an April 2026 policy analysis drawing on government and independent transport research; treat as directional, not to the decimal point — methodologies for counting “a ridership trip” have themselves changed over this period. Not directly comparable across systems measured at different network-completion stages.
Why Do Some Indian Metro Systems Miss Ridership Forecasts?
No single cause explains the gap — it’s usually several of these stacking on the same corridor:
💡 The Main Contributing Factors
- Incomplete networks: a single isolated line carries far less value than an interconnected system with real interchanges — several of the weakest performers above were measured while still running only Phase 1.
- Last-mile connectivity: commuters often live or work several kilometres from the nearest station, and the trip to and from that station can outweigh the time saved on the train itself.
- Walking conditions: broken footpaths, unsafe road crossings and heat exposure discourage the walk to a station that looks short on a map.
- Feeder-bus gaps: where feeder services exist, frequency and schedule integration with train arrivals are often weak.
- Competing modes: two-wheelers, autos and shared mobility remain cheaper or door-to-door in ways a metro trip with two transfers often isn’t.
- Land-use mismatch: stations don’t always sit where dense housing or major employment clusters already exist.
- Optimistic DPR assumptions: forecasts made years before opening sometimes assumed faster network completion, feeder rollout or modal shift than actually happened.
- Cheap or informal parking: makes driving to a destination directly more attractive than a multi-leg metro trip.
- Interchange penalty: multiple tickets and inconvenient transfers between lines reduce the appeal of longer, multi-line journeys.
- Affordability: research cited in the 2026 policy analysis noted an integrated metro journey can consume up to 20% of a lower-income household’s daily commuting budget, against a global benchmark closer to 10-15%.
A Metro Line Is Worth More Once It Becomes a Network
Delhi’s own history is the clearest evidence for why early ridership numbers understate a system’s eventual potential. A single line connects two points; a network of interconnected lines multiplies the number of useful trips non-linearly, because every new line adds not just its own riders but new combinations of origin and destination across every line it connects to. That’s a structural reason several of the lower-performing systems in the table above — most of which were measured on partial, Phase-1-only networks — shouldn’t be read as a verdict on their final potential. It’s also why Chennai, Bengaluru and Hyderabad’s Phase 2 expansions matter more for ridership than their headline kilometre counts suggest.
The 2-km Problem: Getting To and From the Station
A metro operator can build an immaculate station and run a train every five minutes. But if a passenger has to walk along a broken footpath, cross six lanes of unsignalled traffic and negotiate an expensive auto ride before even reaching the platform, the railway has already lost part of its advantage before the commuter has boarded. Commuters evaluate the whole door-to-door journey — home, walk or feeder, station, train, interchange, station, last mile, destination — not just the in-train time. A 25-minute metro ride can lose to a 20-minute motorcycle trip if reaching the station adds another 20 minutes on each end. That’s why the next phase of India’s metro expansion is less about laying more rail and more about the city immediately around each station: footpaths, feeder buses, cycle access, safe crossings and affordable last-mile options.
Framed that way, metro versus bus is the wrong comparison. A functioning system needs metro, bus, walking, cycling, feeder services and (where relevant) regional rail working together — metro investment was never meant to substitute for city bus networks, and cities that treat it as a replacement rather than a complement tend to see weaker last-mile outcomes.
Do Indian Metro Systems Make Money?
“Operating surplus” and “financially sustainable” are not the same claim.
The honest answer needs three separate categories, not one. Farebox operating surplus means ticket revenue exceeds day-to-day running costs. Operating profitability adds other operational income like advertising and rentals. Full financial profitability also accounts for interest on construction debt and depreciation of assets — and this is where the numbers change. In FY2019-20, Delhi Metro posted operational revenue of ₹5,951 crore against ₹4,215 crore of operating expenditure — a genuine operating surplus — but still recorded a net loss of ₹541 crore once debt servicing and depreciation were included. Mumbai, Bengaluru and Chennai all posted overall deficits of roughly ₹242-599 crore that same year despite positive operating numbers.
Revenue mix varies sharply by city: Delhi drew about 48% of revenue from fares (more diversified than most, from advertising, rental and property income), Mumbai around 89%, Bengaluru 79% and Chennai 42%. By comparison, internationally diversified systems like Hong Kong’s MTR draw over half their revenue from non-farebox sources — mainly property development around stations. That gap is exactly what India’s growing focus on Transit-Oriented Development and station-area property/retail leasing is meant to close, and it’s a reasonable one: metro value also includes travel-time savings, congestion reduction and road-safety gains that never show up on an operator’s balance sheet, so full fare-cost recovery was never a realistic bar for judging success on its own.
What Does Metro Rail Cost to Build in India?
There is no single national cost-per-km figure worth quoting — underground, elevated and at-grade construction have fundamentally different cost structures, and land, station count and city density all move the number further. Reported averages: Delhi’s Phase III cost roughly ₹253 crore/km (against an all-phase average nearer ₹181 crore/km), Mumbai’s elevated lines around ₹389 crore/km, Bengaluru around ₹327 crore/km, and Chennai around ₹259 crore/km. Since 2014, 38 metro projects covering 1,051 km have been sanctioned nationally at an estimated ₹3.44 lakh crore; since January 2024 alone, a further 328.63 km has been approved at roughly ₹1.59 lakh crore.
Metro vs Namo Bharat: What’s the Difference?
| Conventional Metro | Namo Bharat / RRTS | |
|---|---|---|
| Main purpose | Within-city trips | Regional commuting across NCR cities |
| Station spacing | Shorter, ~1 km apart | Longer, several km apart |
| Operating speed | Lower, ~32-35 km/h average | Higher, designed for 160 km/h top speed |
| Typical trip length | Within one city | Delhi to Meerut, ~82 km |
| Example | Delhi Metro, Kolkata Metro | Delhi-Ghaziabad-Meerut Namo Bharat |
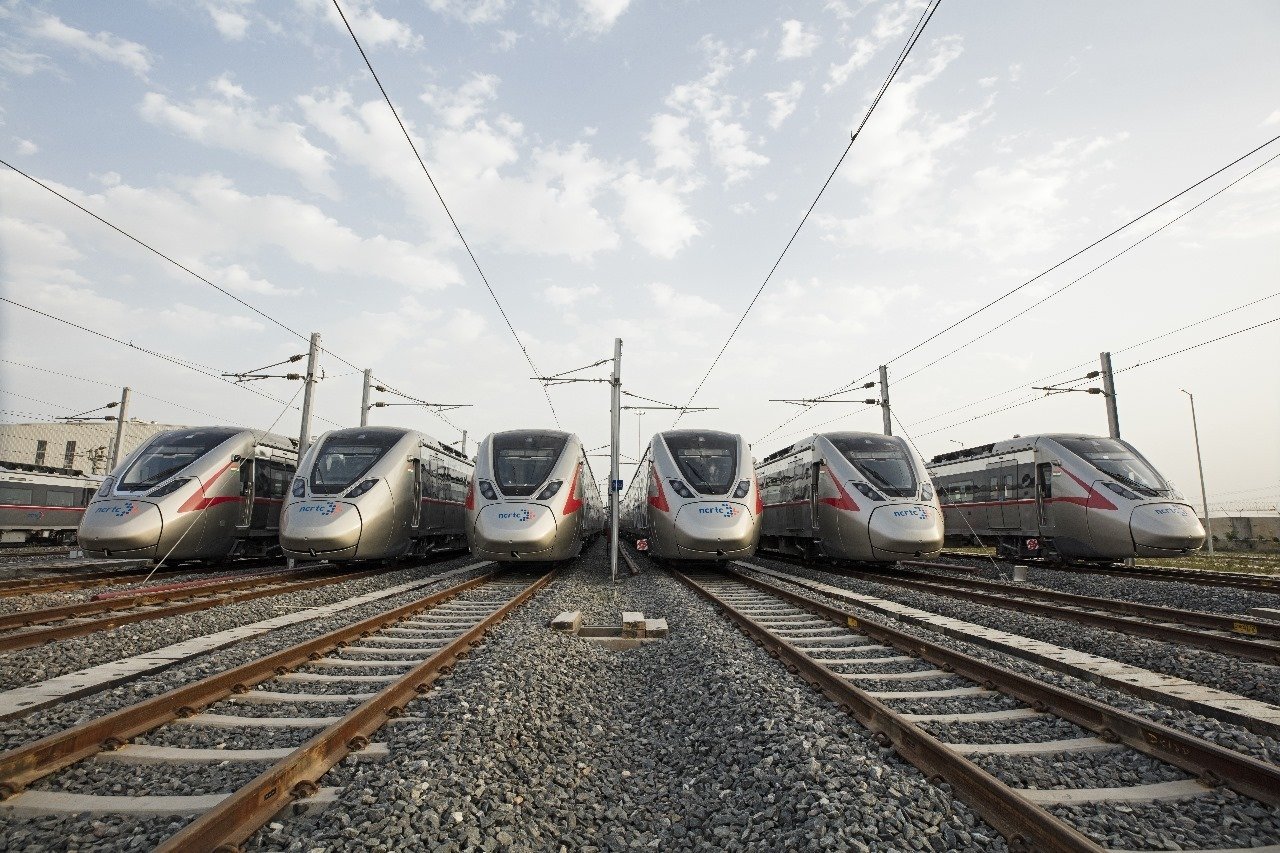
Namo Bharat trainsets at an NCRTC depot ahead of the Delhi-Meerut corridor’s full opening. Credit: Wikimedia Commons / Government Open Data License — India.
MetroLite and MetroNeo: Still on Paper, Not on Track
MetroLite
A standard-gauge, lower-capacity light-metro format proposed for medium-demand corridors in smaller cities, at a fraction of conventional metro’s construction cost. As of August 2026, no MetroLite system is operational anywhere in India — proposals remain at DPR or pre-construction stage.
MetroNeo
A rubber-tyred, overhead-wire or battery-powered light-rail concept aimed at even smaller demand corridors than MetroLite. The Nashik MetroNeo project has faced technical and planning setbacks; no MetroNeo system is operational in India as of August 2026.
Both formats are frequently described in planning documents and press coverage as if they were already serving passengers somewhere in India. They are not, as of this page’s last update. Treat any claim of an “operational MetroLite” or “operational MetroNeo” line as inaccurate until a specific city’s system opens for commercial service and MoHUA confirms it.
Which Indian Cities Have Metro Rail?
Operational network length by city, conventional metro only (excludes RRTS) — February 2026 snapshot, the most recent city-by-city dataset available.
| City | Operational km | First opened |
|---|---|---|
| Delhi-NCR | 353.31 | Dec 2002 |
| Bengaluru | 94.34 | Oct 2011 |
| Mumbai | 79.5 | Jun 2014 |
| Kolkata | 73.11 | Oct 1984 |
| Hyderabad | 67 | Nov 2017 |
| Ahmedabad | 67.51 | Mar 2019 |
| Chennai | 54.1 | Jun 2015 |
| Nagpur | 38.22 | Mar 2019 |
| Pune | 31.25 | Mar 2022 |
| Noida | 29.70 | Jan 2019 |
| Kochi | 27.96 | Jun 2017 |
| Lucknow | 22.90 | Sep 2016 |
| Kanpur | 16 | Dec 2021 |
| Jaipur | 11.98 | Jun 2015 |
| Navi Mumbai | 11.10 | — |
| Gurgaon | 12.1 | Nov 2013 |
| Bhopal | 6.22 | 2025 |
| Indore | 5.8 | 2025 |
| Agra | 5.2 | 2024 |
| Patna | 3.2 | 2024 |
Totals as compiled in a February 2026 industry snapshot; roughly 1,010 km across 20 cities at that date, before Bhopal’s later-2026 addition brought the government’s own count to 26 cities by July. Individual line lengths change as new sections open.
How Does India’s Metro Network Compare Globally?
Indian government statements since March 2025 have consistently described India as having the world’s third-largest operational metro network by length, behind China and the United States. Worth flagging: countries define “metro” differently for these rankings — some totals bundle in commuter rail, light rail or regional-rail mileage that others count separately, which is part of why an India-vs-US comparison can look surprising at first glance. Treat cross-country network-length rankings as directionally accurate rather than strictly apples-to-apples, and prefer within-country, same-definition comparisons (like the DPR-vs-actual ridership table above) wherever precision matters more than headline rank.
Major Metro Projects to Watch Through 2026-27
Physical progress as reported to Parliament, Monsoon Session 2026 (as of June 2026 unless noted).
| Project | Physical progress | Status |
|---|---|---|
| Pune Metro Line 3 (PPP) | 95.73% | Under construction |
| Bengaluru Metro Phase 2 | 95.70% | Under construction |
| Delhi Metro Phase IV (priority corridors) | 82.20% | Under construction |
| Kanpur Metro (remaining corridors) | 82% | Under construction |
| Surat Metro | 81.10% | Under construction |
| Bengaluru Metro Phase 2A & 2B | 72.75% | Under construction |
| Agra Metro (remaining corridors) | 72% | Under construction |
| Indore Metro | 64.15% | Under construction |
| Bhopal Metro | 59.94% | Under construction |
| Chennai Metro Phase II | 54.62% | Under construction |
| Patna Metro (remaining corridors) | 53% | Under construction |
| Jaipur Metro Phase 2 | Not yet started | Approved April 2026 |
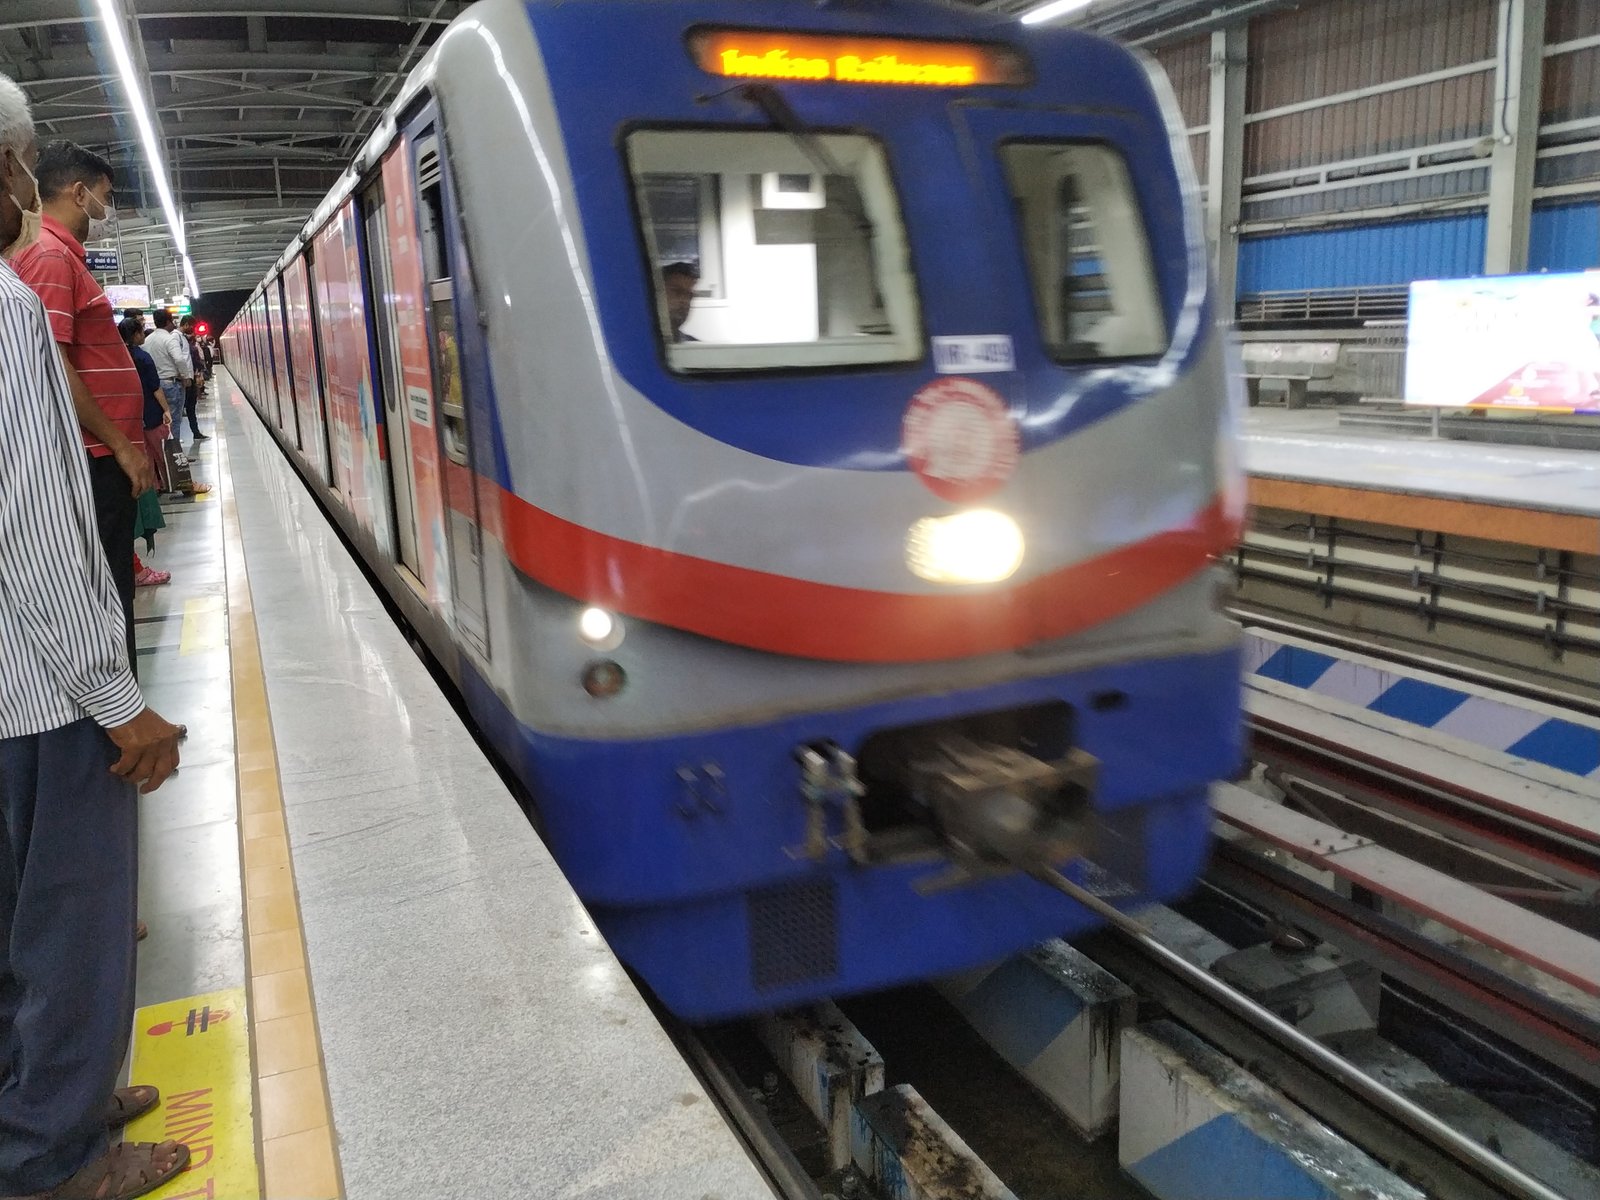
A Kolkata Metro train arriving at Dakshineswar station. Kolkata opened India’s first metro in 1984 and, in 2024, its first underwater tunnel. Credit: Ravi Dwivedi / Wikimedia Commons, CC BY-SA 4.0.
India Metro Dashboard — August 2026
| Indicator | Latest value | Date / source |
|---|---|---|
| Operational network (metro+RRTS) | 1,159 km | Jul 2026, MoHUA |
| Cities served | 26 | Jul 2026, MoHUA |
| National daily ridership | 11.2 million+ | 2025 baseline, rising through 2026 |
| Under-construction network | ~886 km / 30 projects | Jul 2026, MoHUA |
| FY2026-27 budget support | ₹30,942 crore | Union Budget, reported Jul 2026 |
| Sanctioned investment since 2014 | ₹3.44 lakh crore / 1,051 km | Cumulative to 2026 |
| Newly approved since Jan 2024 | ₹1.59 lakh crore / 328.63 km | Cumulative to 2026 |
| Global rank by network length | 3rd, behind China & USA | Since Mar 2025 |
💡 Worth Knowing
- Kolkata opened India’s first metro in 1984 and its first underwater metro tunnel in 2024 — a 40-year span bookended by two national firsts in the same city.
- Not all Delhi Metro lines are driverless — only the Magenta and Pink lines run under Unattended Train Operation; older lines remain manual/semi-automatic.
- “1,155 km,” “1,143 km” and “1,159 km” have all been accurate at different points across 2026 — network length changes month to month as new sections open.
- The riders-per-km metric used to compare systems is a simplistic one; it says nothing about network completeness, interchange quality or how recently a line opened.
Explore More Timelines
People Also Ask
Frequently Asked Questions
Related Reading on AiTimeline
⚠️ Editorial Note
Network-length and ridership figures on this page are drawn from Ministry of Housing and Urban Affairs parliamentary reporting, NCRTC, DMRC and other metro-corporation releases, and independent transport-policy analysis, cited inline with dates throughout. Because official figures for “India’s metro network” have varied by several hundred kilometres within 2026 alone depending on cutoff date and whether RRTS is included, every headline number here states its date and scope rather than presenting a single all-purpose figure. DPR-vs-actual ridership comparisons are approximate and drawn from a secondary policy analysis rather than primary CAG/EAC-PM source documents; treat them as directional. This is editorial, AI-assisted content compiled from publicly available sources and may contain inaccuracies or become outdated as new data is released — it is not investment, policy or engineering advice.
Sources & further reading
Every dated entry above was checked against these references. Last reviewed 15 September 2026.
- Ministry of Housing and Urban Affairs - Metro Rail
- Metro Rail Today - India's Metro Network Reaches 1,159 km (Jul 2026)
- National Capital Region Transport Corporation (NCRTC) - Namo Bharat
- PMO India - Cabinet Approves Jaipur Metro Project Phase-2
- Delhi Metro Rail Corporation (DMRC) Official Site
- The Metro Rail Guy - List of Metro Rail Projects in India (2026 Snapshot)
- India's Metro Networks: Ambitious Expansion Meets Enduring Ridership and Financial Realities
- Wikipedia - Metro Systems in India