Toronto Flood Timeline 1954–2026: Major Floods, Extreme Rain and Climate Risk
Explore Toronto's flood history from Hurricane Hazel in 1954 to 2026, including major storms, extreme rainfall, infrastructure and growing flood risk.
Latest Story
Toronto is Canada’s largest city, but a few hours of heavy rain can still overwhelm its roads, basements, subway access points, highways and power grid. This Toronto flood timeline traces that pattern from Hurricane Hazel in October 1954 — the storm that reshaped how the region manages rivers and floodplains — through the major flash flood of July 2024, when the Don Valley Parkway and Billy Bishop Airport’s pedestrian tunnel both went under water, to the storm that cut power to 45,000 homes on September 2, 2026. This is a record of Toronto flooding history, infrastructure pressure and climate risk — not a claim that every flood shares one identical cause.
🧠 Quick Answer — Why Does Toronto Keep Flooding?
Toronto floods because intense rainfall can overwhelm rivers, creeks, roads, sewers, basements and stormwater systems, especially in low-lying or heavily paved urban areas. Hurricane Hazel in 1954 reshaped flood management across the region, but modern storms — including the July 2024 flood and the September 2026 storm that cut power to 45,000 homes — show that urban growth, aging infrastructure and heavier downpours still create serious risk.
What Toronto’s Flood History Really Shows
- Hurricane Hazel in 1954 remains the defining flood disaster in Toronto’s modern history, killing 81 people and reshaping how the region regulates rivers and floodplains.
- Toronto’s flood risk is shaped by rivers, ravines, paved surfaces, basements, aging stormwater systems and intense rainfall — not any single cause.
- July 2013 still holds the one-day rainfall record: 126mm at Pearson Airport, breaking the mark Hazel had set in 1954, and it produced the most expensive insured natural disaster in Ontario history at the time.
- July 2024 showed how fast extreme rain can disrupt a modern city: the Don Valley Parkway flooded, Billy Bishop Airport’s tunnel closed, and roughly 167,000 Toronto Hydro customers lost power.
- A real flood event did hit Toronto in 2026: a September 2 storm brought hail, tornado warnings and flooding that closed the DVP and several other roads, cutting power to about 45,000 customers.
- The City of Toronto runs flood-protection and basement-flooding programs, but infrastructure upgrades take years and cost billions.
- Use “climate risk” carefully: heavier extreme rainfall can increase flood risk generally, but each individual flood event needs its own careful attribution, not a blanket assumption.
- Insurers are already responding: national severe-weather insured losses topped $2.4 billion in 2025, and about 10% of Canadian households now face flood risk too high to insure at standard rates.
- For any future event, verify the date, rainfall amount, affected areas and official statements before treating a claim as fact.
Toronto Flooding: Key Questions
Toronto Flood Timeline: 1954–2026
Newest first — from the September 2026 storm back to Hurricane Hazel
Toronto Flood Risk Remains a Live Issue
What happened: A powerful storm system hit Toronto on September 2, 2026, bringing large hail, destructive winds and tornado watches and warnings across the region. Flooding closed the Don Valley Parkway, the Allen Road southbound at Lawrence Avenue, the Gardiner Expressway eastbound at Jarvis Street, the Bayview Avenue Extension, and Lake Shore Boulevard West between Strachan Avenue and British Columbia Road.
Impact: Toronto Hydro reported about 45,000 customers without power at the peak, around 8pm that evening. The Toronto and Region Conservation Authority issued a flood warning for parts of the watershed and then downgraded it to a Watershed Conditions Statement later the same day as conditions eased.
Why it matters: Coming barely three days before this article was last updated, the storm is a live reminder that Toronto’s flood story is not history — it is an active, ongoing issue shaped by infrastructure upgrades, basement-flooding programs and renewed concern about how the city handles heavier rain.
Flood Costs and Preparedness Warnings Continue
What was reported: No single major Toronto flood event defined 2025, but national severe-weather insured losses in Canada exceeded $2.4 billion for the year, according to the Insurance Bureau of Canada — the country’s 10th costliest year on record, driven mainly by an Ontario-Quebec ice storm and wildfire and flood losses elsewhere in Canada.
Toronto-relevant warnings: The Insurance Bureau of Canada estimated that about 10% of Canadian households now face flood risk too high to insure at standard rates. Separately, the Canadian Climate Institute warned in February 2025 that more than 540,000 homes could be built in flood-prone areas nationally by 2030, adding roughly $2 billion a year in flood damage.
Why it matters: Flood damage is increasingly a financial and infrastructure issue, not just a weather story — and Toronto’s exposure sits inside these national trends even without a single headline event of its own that year.
Toronto Flooding Disrupts the City
What happened: Torrential rain on July 15–16, 2024 caused flash flooding across Toronto, submerging sections of the Don Valley Parkway after the Don River overflowed, stranding vehicles, and flooding Billy Bishop Airport’s underwater pedestrian tunnel, which closed as a result.
Power and cost: Toronto Hydro reported roughly 167,000 customers without power at the peak of the storm. The Insurance Bureau of Canada initially estimated insured damage near $940 million; CatIQ’s final revision in 2025 settled the figure at approximately $899 million, making it one of the costliest insured weather events in Ontario history.
Why it mattered: The storm showed how quickly intense rainfall can overwhelm a modern city’s transport, power and drainage systems at once, even outside the single-day rainfall record set in 2013.
Extreme Rain Hits Toronto Again
What happened: A severe thunderstorm dropped 126mm of rain at Pearson Airport on July 8, 2013 — breaking the previous single-day rainfall record of 121mm set by Hurricane Hazel in 1954. Widespread flash flooding knocked out power to more than 300,000 customers and stranded about 1,400 passengers aboard a GO Transit train surrounded by rising water.
Cost: Insurers paid out an estimated $940 million (in 2013 dollars), making it the most expensive insured natural disaster in Ontario history at the time, according to the Insurance Bureau of Canada.
Why it mattered: The scale of the payout and the stranded-train images made 2013 a national reference point for the insurance protection gap and for urban flood risk beyond river valleys.
A Major GTA Rainstorm Exposes Urban Flooding
What happened: A severe storm dropped about 103mm of rain on parts of Toronto on August 19, 2005, washing out a roughly 30-metre section of Finch Avenue West and flooding thousands of basements across the city.
Cost: Insurers received about 15,000 claims, with insured damage estimates ranging from roughly $500 million to $600 million depending on the source — a scale that, at the time, was unusual for a single urban rainstorm rather than a hurricane or river flood.
Why it mattered: The 2005 storm showed that Toronto’s flood risk extended well beyond the historic river-valley disasters like Hazel, into ordinary urban infrastructure — roads, sewers and basements — that a fast, intense downpour could overwhelm on its own.
Urban Growth Adds New Pressure
What changed: Toronto’s rapid expansion through these decades added far more paved surfaces — roads, parking lots, driveways and rooftops — across the region. More hard surfaces mean rainfall runs off faster into drains, creeks and rivers instead of soaking naturally into the ground.
Why it mattered: This slow, compounding shift raised the baseline flood risk for storms of a given size, independent of any single dramatic event, and set the stage for the urban flash floods of 2005, 2013 and 2024.
Floodplains Become Protected
What changed: One of Hazel’s most lasting legacies was a shift away from building homes in the most dangerous floodplain areas. In the years after the storm, the province merged local conservation bodies into what became the Toronto and Region Conservation Authority, strengthening conservation-based flood planning across the region.
Why it mattered: Land that had been residential before 1954, particularly along the Humber River, was converted to parkland and conservation areas rather than rebuilt — a direct, physical legacy of the disaster still visible in Toronto’s ravine system today.
Hurricane Hazel Changes Toronto Forever
What happened: Hurricane Hazel struck the Toronto region on October 15–16, 1954, dropping more than 200mm of rain in 24 hours on already-saturated ground, with winds reaching 124 km/h. Rivers and creeks overflowed catastrophically — the Humber River widened from about 65 feet to 350 feet at Woodbridge at the storm’s peak.
Toll: The storm killed 81 people, more than 30 of them on Raymore Drive alone, where an entire street was swept away, and left roughly 1,900 families homeless. It remains Canada’s deadliest single storm-related disaster in a major urban area.
Why it mattered: Hazel devastated floodplain communities and directly reshaped how the region manages rivers, conservation areas and floodplain development, a legacy that still governs Toronto’s flood policy seven decades later.
Why Heavy Rain Overwhelms Toronto
The same basic chain repeats in every major Toronto flood
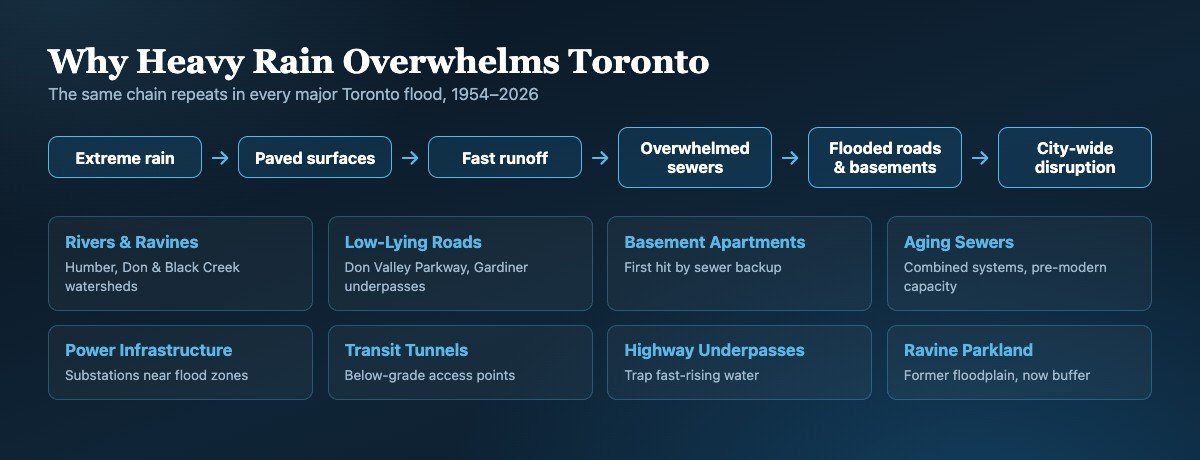
Rivers and Ravines
The Humber, Don and Black Creek watersheds channel huge volumes of runoff through the city and can rise fast during intense storms.
Low-Lying Roads
The Don Valley Parkway and sections of the Gardiner Expressway sit close to river level and flood repeatedly during heavy rain.
Basement Apartments
Basements are the first place overloaded sewers back up into, making basement flooding the most common household flood damage in the city.
Aging Sewers
Much of Toronto’s combined and storm sewer network predates modern rainfall-intensity standards and fills quickly in a downpour.
Power Infrastructure
Substations and electrical equipment near flood-prone areas are a recurring source of storm-driven outages, as seen in 2013, 2024 and 2026.
Transit Tunnels
Underground and below-grade transit access points, including Billy Bishop Airport’s pedestrian tunnel, are vulnerable to sudden water intrusion.
Toronto Flood Milestones at a Glance
| Year | Event | What happened | Why it mattered |
|---|---|---|---|
| 1954 | Hurricane Hazel | Deadly river flooding across the Toronto region, 81 dead | Reshaped floodplain planning and conservation policy for decades |
| 2005 | Major GTA rainstorm | 103mm rain, Finch Ave West washout, 15,000 claims | Showed modern flood risk extends beyond river valleys |
| 2013 | Toronto extreme rain | 126mm record rainfall, 300,000+ without power | Exposed vulnerability of city systems, costliest insured event at the time |
| 2024 | July flash flooding | DVP, airport tunnel, power and transit affected | Showed how fast intense rainfall can overwhelm a modern city |
| 2026 | September storm | Hail, tornado warnings, DVP closed, 45,000 without power | Confirms flood resilience remains a live Toronto issue |
Why Toronto Floods Even After Decades of Planning
- Toronto has many rivers, creeks and ravines running through densely built neighbourhoods.
- Older neighbourhoods were built before today’s rainfall-risk assumptions and sewer-capacity standards existed.
- Paved surfaces — roads, parking lots, driveways and rooftops — increase runoff speed and volume.
- Basement flooding happens when sewer and drainage systems are overloaded faster than they can drain.
- Highways, underpasses and transit corridors near river valleys can become flood traps within minutes.
- Climate risk means heavier rainfall events can become more likely or more damaging, but attribution for any single storm must be careful and sourced.
- Infrastructure upgrades — new sewer tunnels, basement-flooding programs, the Port Lands Flood Protection project — are expensive, disruptive and slow to complete.
Climate Risk: What Can Be Said Carefully
Scientists and public agencies warn that a warmer atmosphere can hold more moisture, increasing the potential for heavier rainfall. For Toronto, that does not mean every flood has one simple cause. It means the city must plan for stronger downpours, faster runoff and more expensive damage when drainage systems are overwhelmed.
For context: the Insurance Bureau of Canada reported national severe-weather insured losses exceeding $2.4 billion in 2025, and the Canadian Climate Institute warned in February 2025 that continued development in flood-prone areas could add roughly $2 billion a year in flood damage nationally by 2030. These are national trend indicators, not a Toronto-specific attribution for any single storm.
What Changed After Hurricane Hazel?
- Greater focus on floodplain control, restricting new construction in the most flood-prone river valleys.
- A stronger, unified conservation authority role — the Toronto and Region Conservation Authority — managing watershed planning across municipal boundaries.
- More caution around building in river valleys, with many previously residential floodplain areas converted to parks and protected land.
- Modern flood forecasting and stormwater planning practices that trace their institutional roots directly back to Hazel’s aftermath.
Toronto Flood Risk: Vulnerable Areas
Vulnerability depends on elevation, river proximity, sewer capacity and drainage — not a single official hazard map
Toronto does not publish one single authoritative “flood map” that residents can check street by street; flood risk instead depends on a combination of local elevation, proximity to a river or creek, sewer capacity and drainage design. Areas that have repeatedly flooded in the events covered by this timeline share common traits: they sit low relative to a nearby watercourse, they include an underpass or below-grade corridor, or they carry aging combined sewers.
- Don Valley Parkway corridor — flooded in 2013, 2024 and 2026, due to its proximity to the Don River.
- Finch Avenue West near Black Creek — washed out in 2005 and remains a recurring flood point.
- Gardiner Expressway underpasses — low-lying sections flood during intense downpours, including the 2026 storm.
- Billy Bishop Airport’s pedestrian tunnel — a below-grade access point that flooded in 2024.
- Humber River floodplain communities — the historic site of Hazel’s worst damage, now largely parkland and conservation land.
- Older neighbourhoods with combined sewers — more prone to basement backup during intense, short-duration storms.
Residents in any of these types of areas should check the City of Toronto’s basement-flooding program resources and their own property’s grading and sewer connections rather than relying on a single map.
What Toronto Homeowners Should Watch
Informational Checklist — Not Professional Advice
- Basement backwater valve, to stop sewer water from backing up into the home during overloaded-system events.
- Sump pump, to manage groundwater and foundation-drainage water.
- Downspout disconnection where applicable, to keep roof runoff out of the sewer system.
- Lot grading, to direct surface water away from the foundation.
- Sewer backup insurance, since standard home insurance does not always cover this specific risk.
- City subsidy programs, including Toronto’s expanded basement-flooding protection subsidies.
- Local flood-risk information from the City of Toronto and the Toronto and Region Conservation Authority.
⚠️ This section is informational only and is not professional engineering, plumbing or legal advice. Homeowners should consult a licensed contractor or the City of Toronto directly before undertaking flood-protection work.
🧠 Short Answer: Is Toronto’s Flood Risk Getting Worse?
Toronto’s flood risk is growing because intense rain is colliding with urban development, paved surfaces, older drainage systems and vulnerable low-lying areas. Climate risk can increase the chance of heavier rainfall, but each flood event should be described with verified rainfall data and official sources. The key issue is not only more rain; it is how fast water reaches roads, rivers, sewers and basements.
Explore More Timelines
People Also Ask
Frequently Asked Questions
Explore More on AiTimeline
⚠️ Editorial Note
This article separates verified official figures (TRCA, City of Toronto, Environment and Climate Change Canada, Insurance Bureau of Canada, CatIQ) from general background context, and avoids attributing any single flood event to climate change without careful qualification. Rainfall totals, outage numbers and insured-loss figures are cited to their original source and may be revised by those sources over time. This is editorial content, not engineering, insurance or legal advice.
Sources & further reading
Every dated entry above was checked against these references. Last reviewed 15 September 2026.
- The Canadian Encyclopedia: Hurricane Hazel
- Hurricane Hazel Chronology Archive (TRCA/CVC)
- CBC: 10 Years After Historic Toronto Floods
- Insurance Bureau of Canada: July 2024 Toronto Flood Losses
- Insurance Business Canada: CatIQ Final 2024 Loss Revision
- Insurance Bureau of Canada: 2025 Severe Weather Losses
- City of Toronto: Basement Flooding Protection Program
- CTV News: September 2026 Toronto Storm and DVP Closure