Iranian Rial Collapse: How Sanctions, War and Inflation Broke the Currency
Iranian rial collapse timeline, 1979-2026: how sanctions, inflation and the 2026 war took the open-market dollar from 4,036 rials to over 2.5 million.
Latest Story
The Iranian rial collapse is not the result of one sanctions package or one political crisis. It is the outcome of decades of inflation, economic isolation, falling confidence, restricted access to foreign currency and repeated exchange-rate interventions. In 2026 war, restrictions on oil exports and a US naval blockade pushed the open-market rate from about 1.5 million rials per dollar in January to more than 2.5 million by 29 September.
💡 Short Answer
The Iranian rial hit a record on the Tehran open market on 29 September 2026, when traders exchanged more than 2.5 million rials for one US dollar, according to AP. Sanctions, oil-revenue restrictions, inflation, policy weakness and the 2026 war all contributed. That is an open-market rate, not the official rate for every transaction; the unofficial rate was 4,036 rials per dollar in 1995.
Iranian Rial: Key Questions
The Rial Collapse in Nine Points
- Latest verified record: more than 2.5 million rials per dollar on 29 September 2026, an open-market rate.
- Date check: the record was in late September, not October; a tracker showed about 2.73 million on 31 October, unverified.
- War timeline: strikes began 28 February; ceasefire 7-8 April; blockade 13 April; memorandum 17 June; ceasefire collapse 8 July.
- Early calm: the rial held for weeks early in the war because trade slowed, then fell from late April.
- 2018: the US withdrawal from the nuclear deal was a major trigger; the rate neared 150,000 by 5 November.
- 2012-14: sanctions cut the unofficial rial’s value about 56%.
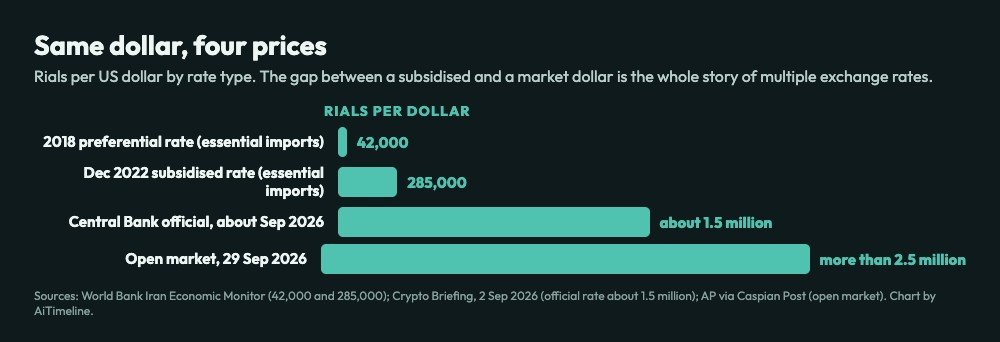
- Multiple rates: 42,000, 285,000, about 1.5 million official and 2.5 million open-market rates show the gap.
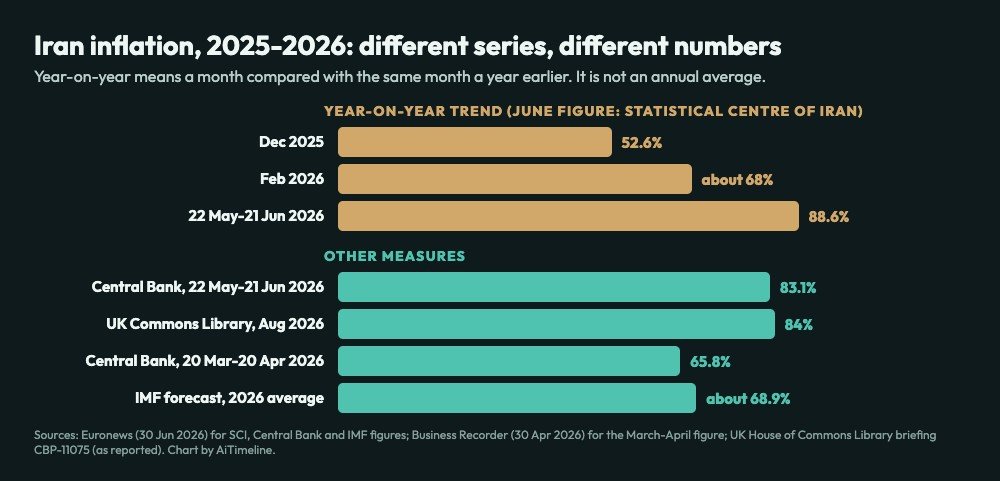
- Inflation: 83-89% year-on-year in mid-2026, depending on the series; not an annual average.
- Protests: the January 2026 unrest began over prices and the currency but later included wider political demands.
Iranian Rial Collapse Timeline: 1979 to 2026, Latest First
Each entry is colour-coded by period. Rates are rials per US dollar unless stated; sources are listed below.
A rate tracker shows about 2.73 million rials per dollar Protests, war and free fall
What it shows: The Alanchand open-market tracker listed the dollar at about 2,734,000 rials on 31 October 2026, down 21,000 rials (0.76%) on the day. That is roughly 273,400 tomans.
How far to trust it: This is a tracker reading, not a report from a news agency, and street quotes differ by tracker and by hour. We could not corroborate it with a second source, so the last verified record in this article remains the 2.5 million-plus figure reported on 29 September.
Traders in Tehran exchange more than 2.5 million rials for one dollar Protests, war and free fall
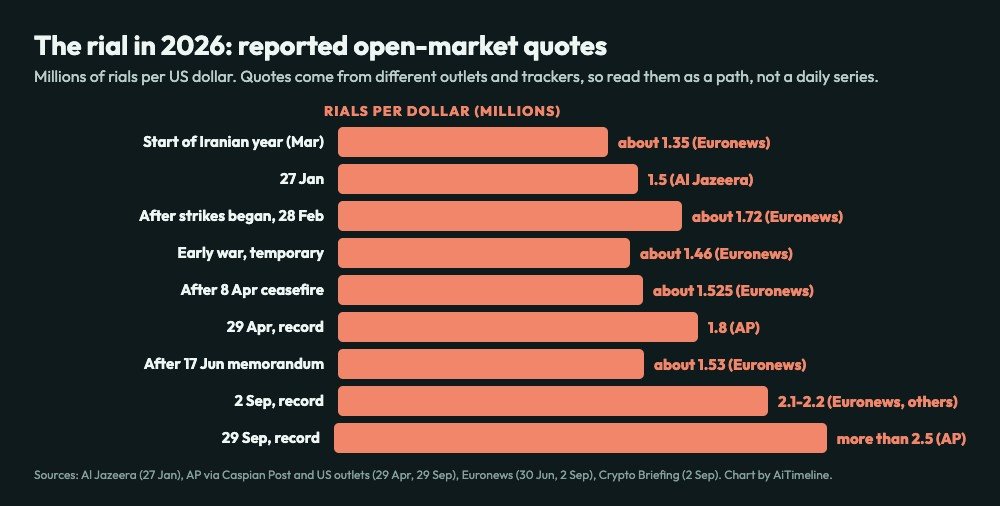
What happened: On Tuesday 29 September 2026, traders in Tehran were exchanging more than 2.5 million rials for one US dollar, a new record low, according to the Associated Press. The previous record had been about 2.2 million rials on 2 September, 27 days earlier. Before the war began in February, the open-market rate was about 1.7 million.
Which date?: Some summaries place this record in “October”. The AP-based reports and Democracy Now date it to 29 and 30 September. It is also an open-market rate, not the official rate used for every government transaction.
Why: The reports tie the slide to economic damage from the war, restrictions on Iranian oil exports and new sanctions, on top of years of inflation.
The dollar breaks 2.1 million rials; central bank promises $2 billion Protests, war and free fall
What happened: On 2 September 2026 Euronews reported that the dollar had broken 2.1 million rials on Tehran’s free market, with the euro at a record 2.55 million. Other outlets that day put the dollar at about 2.2 million, so the figure depends on the tracker and the hour. The headline of Euronews’s own web address says 2.2 million.
The intervention: Central Bank of Iran governor Abdolnaser Hemmati said the bank was ready to inject $2 billion into the foreign-exchange market. A report the same day put the official central-bank rate at about 1.5 million rials, a gap of roughly 40-45% with the street.
The “60%” claim: Euronews said the rial had lost around 60% of its value since March, when the dollar traded at about 1.35 million rials. From 1.35 million to 2.1-2.2 million, the dollar’s price rose about 56-63%; the rial’s purchasing power fell about 36-39%. See the explainer below.
Inflation near 84-89% as war damage and shipping limits bite Protests, war and free fall
What the UK briefing said: A House of Commons Library briefing, published 27 August 2026, reported that the rial had reached a record low in August and that year-on-year inflation had reached 84%. We could not open the briefing itself, so we attribute that figure to it.
Other measures: Euronews reported two official series for the 22 May-21 June month: the Statistical Centre of Iran put year-on-year inflation at 88.6% and the Central Bank at 83.1%. The two differ by methodology. The IMF projected average inflation of about 68.9% for 2026 and a contraction of about 6.1% in GDP.
Careful with the word: “Year-on-year” compares one month with the same month a year earlier. It is not an annual average, and it is not a verified November figure.
A memorandum steadies the rial for a few weeks, then the ceasefire collapses Protests, war and free fall
What happened: The presidents of the United States and Iran signed the Islamabad Memorandum on 17 June 2026, a memorandum of understanding that set a 60-day period to negotiate final terms. Pakistan had mediated the earlier ceasefire and the talks. Sources describing the oil terms are thinner, and we have not verified that Iranian oil exports actually resumed.
The rial: Euronews reported that the rial recovered to about 1.53 million per dollar after the memorandum, from a record near 1.9 million. By its 30 June report, renewed tension had pushed it back toward 1.7 million.
The collapse: According to Wikipedia’s timeline, the ceasefire collapsed on 8 July after attacks by both sides, and fighting resumed. The diplomatic opening did not restore lasting stability.
Rial hits 1.8 million as a shaky ceasefire holds Protests, war and free fall
What happened: On Wednesday 29 April 2026 the rial hit a record low of 1.8 million to the dollar while a shaky ceasefire with the United States and Israel was in place. AP reported that the rial had stayed relatively stable for weeks during the war, partly because there was little trading or importing, then weakened from about 1.4 million to 1.6 million in less than a week. Currency-tracking websites showed rates between 1.76 and 1.81 million.
The blockade: The US blockade of Iranian ports, AP reported, had cut into a key source of government revenue and hard currency by stopping or intercepting oil shipments.
Inflation: The Central Bank figure reported by Business Recorder put year-on-year inflation for the Iranian month from 20 March to 20 April at 65.8%.
Ceasefire, failed talks and a blockade of Iranian ports Protests, war and free fall
What happened: A two-week US-Iran ceasefire, mediated by Pakistan, was agreed on 7-8 April. Talks in Islamabad led by US Vice President JD Vance failed on 12 April. The next day, 13 April, US forces began a blockade of ships entering or leaving Iranian ports, according to CENTCOM.
Why it matters here: The blockade is a separate step from the 28 February strikes. It was imposed about six weeks later and targeted the oil and import flows on which the foreign-currency supply depends. Euronews reported the rial at about 1.63 million after a 7 April threat of further strikes, and about 1.525 million after the ceasefire.
US and Israeli strikes begin the war Protests, war and free fall
What happened: The United States and Israel began strikes on Iran on 28 February 2026. We use that date, which AP and Euronews both give. A passage in the UK Commons Library briefing refers to 29 February 2026, which was not a calendar date; we treat it as a typing error.
The rial: Euronews put the rate at about 1.72 million per dollar after the strikes began, and AP gave about 1.7 million before the war. During the early conflict it temporarily eased to about 1.46 million as reduced activity lowered demand for dollars. Different trackers and a changing market make single numbers fragile.
The shock: The war added risks to oil exports, shipping through the Strait of Hormuz, trade and investment, and to the foreign-currency earnings that support the rial.
Rial falls to 1.5 million per dollar Protests, war and free fall
What happened: On Tuesday 27 January 2026 exchange shops in Tehran offered a record 1,500,000 rials per dollar, according to Iranian currency-tracking websites cited by Al Jazeera.
The protests: Demonstrations began in the capital on 28 December 2025 and spread nationwide. About a month before the latest drop, shopkeepers in Tehran’s Grand Bazaar had shut their stores to protest the rial’s decline, high inflation and the end of some food and fuel subsidies. Demonstrators later raised wider political demands, so the exchange rate was a trigger, not the only grievance.
Protests begin after months of rising prices Protests, war and free fall
The backdrop: Euronews reported year-on-year inflation of 52.6% in December 2025, rising to about 68% by February 2026. Shopkeepers and traders were hit hardest by the fast-changing exchange rate, which made it hard to price goods, replace imported stock and plan.
Careful attribution: The protests spread beyond the capital and took on political demands. We do not attribute every demonstration to the exchange rate alone.
Maximum pressure returns; the dollar passes 94,000 tomans Protests, war and free fall
What happened: On 4 February 2025 the White House restored a “maximum pressure” policy toward Iran, with the stated aim of driving Iranian oil exports toward zero. Sanctions and uncertainty over nuclear diplomacy added pressure to the foreign-exchange market.
The rate: An academic study of Iran’s repeated currency shocks records the free-market dollar at 93,500 tomans on 28 February and 94,500 on 2 March 2025. In rials, that is about 935,000 to 945,000.
A new subsidised rate of 285,000 rials Sanctions era
What happened: Six months after ending the 42,000-rial policy, the Central Bank introduced a new fixed rate of 285,000 rials per dollar for essential imports in December 2022, the World Bank reports.
The catch: The World Bank notes that the policy of defending a fixed rate by direct intervention widened the gap with the parallel market. A subsidised rate cannot guarantee that every importer can actually obtain dollars at that price.
Women, Life, Freedom protests coincide with a weaker rial Sanctions era
What happened: The death of Mahsa Amini in September 2022 after her detention by the morality police set off nationwide protests under the slogan Women, Life, Freedom.
The rate: The study records the free-market dollar rising from slightly above 33,000 tomans in September (about 330,000 rials) to around 50,000 tomans (about 500,000 rials) by the end of 2022. The protests were not the sole cause; sanctions, inflation and the dollar shortage were already at work.
The 42,000-rial preferential rate is scrapped Sanctions era
What happened: In May 2022 the government eliminated the subsidised exchange rate, set at 42,000 rials per dollar after the 2018 sanctions, for essential imports. Limited access to reserves abroad, large demand and misallocation of funds had undermined it, the World Bank says.
The cushion: Under a cash-transfer scheme introduced in June 2022, people in the first three income deciles received 4 million rials a month and those in the fourth to ninth deciles 3 million, reaching about 78 million of Iran’s 85 million people.
The US leaves the nuclear deal and the rial breaks Sanctions era
What happened: The United States withdrew from the 2015 nuclear deal (JCPOA) on 8 May 2018. The Congressional Research Service says the first tranche of sanctions returned on 7 August 2018 after a 90-day wind-down, and the rest, including measures on oil and banking, on 5 November.
The rate: CRS records the unofficial rate at about 95,000 rials per dollar in August 2018 and nearly 150,000 by 5 November, easing to about 100,000 at the start of 2019. The Vahabi study has the dollar peaking at 18,500 tomans (185,000 rials) in October 2018 and passing 30,000 tomans (300,000 rials) in 2020. The sources differ on the exact peak.
The response: After the reimposition the government established a subsidised rate of 42,000 rials per dollar for essential imports. The withdrawal was a major trigger for the fall, not its only cause.
Nuclear diplomacy steadies the currency Sanctions era
What happened: The election of Hassan Rouhani and the 2013 interim nuclear agreement (the Joint Plan of Action) caused the rial to stabilise at about 35,000 to the dollar, the Congressional Research Service says. The final JCPOA, reached in July 2015, raised hopes of more oil exports, investment and access to international finance.
The limit: Stability depended on continued international cooperation. It was a pause after the 2012 collapse, not a return to earlier rates.
Oil and banking sanctions halve the rial’s value Sanctions era
What happened: The United States and European Union tightened pressure over Iran’s nuclear programme, restricting oil purchases and international banking. A US executive order also blocked foreign banks from transactions in rials.
The rate: The Congressional Research Service says sanctions caused the value of the rial on unofficial markets to decline about 56% from January 2012 to January 2014.
Another sharp depreciation: 2,635 to 4,036 rials per dollar Revolution to the 1990s
The numbers: The Cambridge study Recurrent exchange rate shocks and Anfal in Iran records the unofficial rate rising about 46% in 1994, from 1,806 to 2,635 rials per dollar, and a further 53% in 1995, to 4,036 rials. These are rials, not tomans; confusing the two is a common error in quoting this period.
Why it matters: The episode shows that currency instability did not begin with the 2010s sanctions. High inflation, pressure on foreign-exchange availability and policy uncertainty were enough.
Governments try to close the gap between official and market rates Revolution to the 1990s
What happened: In 1991 the Central Bank raised the official rate from 67.8 to 1,420.2 rials per dollar to narrow the gap with the unofficial rate. Attempts to unify the rates in the early 1990s then failed, the Vahabi study says, as fiscal pressure and continued preferential access to foreign currency undermined the system. Other accounts date a unification attempt to March 1993; we have not reconciled the dates.
The lesson: An official rate is hard to hold when the state cannot consistently supply dollars at the promised price.
Revolution, then eight years of war Revolution to the 1990s
The first shock: Political upheaval and capital flight followed the 1979 revolution. The Vahabi study has the open-market dollar rising from about 7 to 27 tomans (roughly 70 to 270 rials) between 1979 and 1981, though the paper words the size of that move inconsistently, so treat it as indicative.
The war: The Iran-Iraq War began in September 1980 and lasted eight years. It strained public finances, industry and oil facilities, and Iran ran a complicated foreign-exchange system with different rates for different transactions.
The Rial Rate Path: From Thousands to Millions
Same currency, converted into one unit.
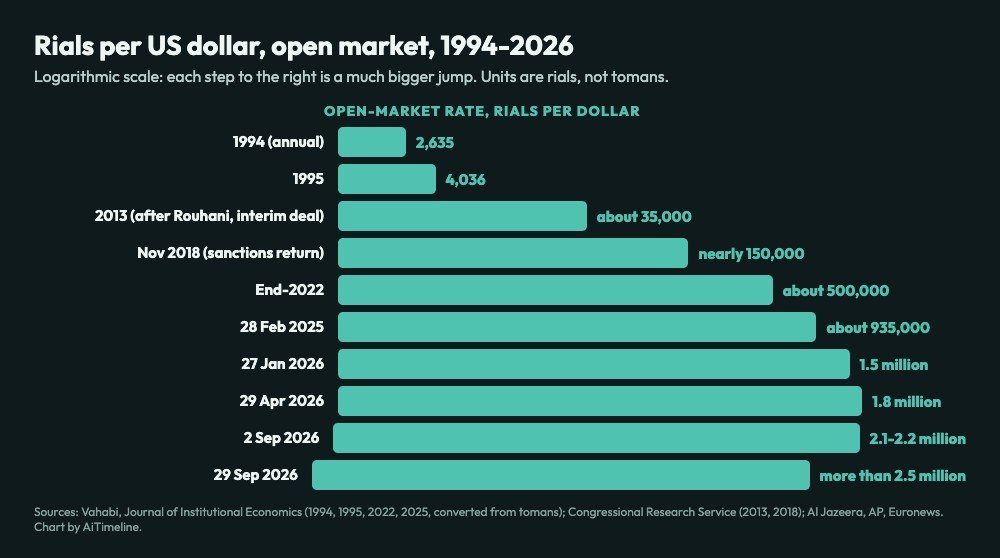
The table converts older quotes into rials per US dollar so they can be compared. Tomans have been multiplied by 10. Open-market quotes differ by outlet and tracker, so each row names its source.
| Date | Rate (rials per US dollar) | Type | Source |
|---|---|---|---|
| 1994 | 2,635 | Unofficial, annual | Vahabi, Journal of Institutional Economics |
| 1995 | 4,036 | Unofficial, annual | Vahabi |
| 2013 | About 35,000 | Unofficial | Congressional Research Service |
| Aug 2018 | About 95,000 | Unofficial | Congressional Research Service |
| 5 Nov 2018 | Nearly 150,000 | Unofficial | Congressional Research Service |
| End-2022 | About 500,000 (50,000 tomans) | Free market | Vahabi |
| 28 Feb 2025 | About 935,000 (93,500 tomans) | Free market | Vahabi |
| 27 Jan 2026 | 1,500,000 | Open market | Al Jazeera |
| 29 Apr 2026 | 1,800,000 | Open market | AP |
| 2 Sep 2026 | 2.1-2.2 million | Open market | Euronews; Crypto Briefing |
| 29 Sep 2026 | More than 2.5 million | Open market | AP |
| 31 Oct 2026 | About 2.73 million | Open market (tracker, unverified) | Alanchand |
Within 2026 the path was uneven. The rial stayed relatively stable for weeks after the 28 February strikes, partly because trading and imports slowed, then fell once the blockade began and activity resumed. A memorandum in June pulled it back toward 1.53 million, and renewed tension pushed it up again. For the wider war, see our Iran-US war 2026 explainer and our timeline on Iran’s demands over the Strait of Hormuz.
Why Does Iran Have More Than One Dollar Rate?
Iran has repeatedly run several exchange rates at once. The government has offered subsidised rates for selected imports, while businesses and individuals relied on other regulated or open-market rates. A headline of 2.5 million rials per dollar describes the market rate, not necessarily the rate used for every government transaction or subsidised import.
The problem is that an official rate cannot guarantee that dollars are available at that price. When the official rate is far stronger than the market rate, those with access to subsidised foreign exchange gain an advantage over those forced to buy at market prices, which creates arbitrage, distorts prices and makes the official rate a poor measure of the currency’s value.
| Rate type | Level | Used for | Source |
|---|---|---|---|
| Preferential rate, 2018 to May 2022 | 42,000 rials per dollar | Essential imports | World Bank |
| Subsidised rate from Dec 2022 | 285,000 rials per dollar | Essential imports | World Bank |
| Central Bank official rate, about Sep 2026 | About 1.5 million | Official reference | Crypto Briefing |
| Open market, 29 Sep 2026 | More than 2.5 million | Street and trader transactions | AP |
Inflation: Different Series, Different Numbers
Inflation and the exchange rate feed each other: a weaker rial makes imports dearer, higher prices increase demand for dollars as people protect savings, and that deepens the depreciation. The UK House of Commons Library briefing reported year-on-year inflation of 84% in August 2026; Iran’s own agencies reported 83.1% (Central Bank) and 88.6% (Statistical Centre) for the month to 21 June.
Those are year-on-year figures. The same Euronews report gave a 62.0% annual figure for the Statistical Centre and 57.7% for the Central Bank. Always check which measure is being quoted.
Why Has the Rial Lost So Much Value?
The rial’s fall is not the result of a single sanctions package or one political crisis. Five forces have repeatedly reinforced one another, and each major shock weakened the currency further. Attempts to defend it through several official exchange rates often widened the gap between the government rate and the price ordinary Iranians faced.
Sanctions are the best-known factor, and our history of US secondary sanctions shows how financial restrictions work. But the 1994-95 slide, from 1,806 to 4,036 rials per dollar, happened without the modern sanctions regime, and domestic policy and structural weaknesses have also contributed to the long-term decline.
| Force | How it hits the rial | Caution |
|---|---|---|
| Sanctions | Restrict oil exports, banking and payments, so fewer dollars come in and are harder to use | Major driver, but not the only one |
| Oil-revenue shocks | Oil is a main source of government foreign exchange; a blockade or export limit cuts the supply of dollars | The 2026 blockade began 13 April |
| Inflation | When prices rise faster than confidence in the currency, people shift savings into dollars, gold or goods | Figures differ by series; see the inflation section |
| Economic management | Budget deficits, monetary expansion and banking weakness add to price pressure | Cited by economists; hard to separate from sanctions |
| Political and military shocks | Protests, nuclear tension and war raise demand for foreign currency as a safe store of value | Rates can move on news within days |
What the Rial’s Collapse Means for Ordinary Iranians
- Food and household goods: imported products and goods that depend on imported ingredients become dearer.
- Medicine and healthcare: shortages of foreign currency can complicate the supply of medicines and equipment.
- Savings: people holding rials see purchasing power fall quickly; those with dollars, gold or overseas assets are better protected.
- Business: importers face unpredictable costs, and retailers struggle to reprice and restock.
- Wages and pensions: the effect is sharpest when pay does not rise as fast as prices.
Can the Iranian Rial Recover?
A lasting recovery would need more than a dollar injection by the Central Bank. The short rallies after the April ceasefire and the June memorandum faded when tensions returned. Five conditions would matter: sanctions relief that restores oil exports and access to finance; lower political and military risk; lower inflation and less deficit financing; a more transparent exchange-rate system that narrows the official-market gap; and investment and exports beyond oil.
Other economies show how currency crises can unfold, from the Turkish lira to Lebanon, Venezuela and Sri Lanka. For how the same oil and war shock reached another currency, see our Indian rupee timeline and India’s economic exposure to the Iran war.
The Terms Behind the Headlines
Rial and toman
The rial is the official currency. Everyday prices are often quoted in tomans, and 1 toman equals 10 rials.
So 250,000 tomans is 2.5 million rials. Always check the unit before comparing a historic rate with a modern one.
The “60% loss” arithmetic
If the dollar rose from 1.35 million to 2.1-2.2 million rials, its price rose about 56-63%. The rial’s purchasing power fell by 1 minus 1.35/2.1 or 2.2, about 36-39%.
The starting point also came after the rial had briefly firmed during the early war.
Year-on-year versus annual
Year-on-year inflation compares a month with the same month a year earlier. Annual inflation usually averages a full year.
For June 2026 the Statistical Centre reported 88.6% year-on-year and 62.0% annual, so the label changes the number.
Six things often told wrongly about the rial
- “The 2.5 million record was in October.” AP-based reports date it to Tuesday 29 September 2026. It is an open-market rate, not the official rate.
- “The dollar was at 2.1 million all September.” The 2.1-2.2 million figure is from 2 September reports; it was not the rate throughout the month.
- “The rial lost 60% of its value this year.” The dollar’s price rose about 56-63% from a 1.35 million start; the rial’s purchasing power fell about 36-39%.
- “Inflation is 84% a year.” The 84% figure is year-on-year, from the UK Commons Library briefing for August; it is not an annual average or a verified November figure.
- “The strikes began on 29 February.” There was no 29 February in 2026. The strikes began on 28 February.
- “Sanctions caused the whole collapse.” The 2018 withdrawal from the nuclear deal was a major trigger, not the sole cause; inflation, policy and war also matter.
Explore More Timelines
People Also Ask
Iranian Rial Collapse: Frequently Asked Questions
Conclusion: A Currency Crisis Built Over Decades
The rial’s collapse is a story of repeated shocks rather than one event: the 1979 revolution and the Iran-Iraq War, the exchange-rate crises of the 1990s, nuclear-related sanctions, the 2018 US withdrawal from the nuclear deal and the 2026 war each added pressure to an already vulnerable system.
The deeper problem is structural. Without sustained control of inflation, credible monetary policy, access to international markets and a more transparent exchange-rate system, temporary interventions may slow the fall without resolving it. The last verified market figure is the 29 September record; the rate was still moving when this article was updated.
Related AiTimeline Stories
⚠️ Editorial Note
Last updated 1 November 2026. Open-market rates come from AP, Euronews, Al Jazeera and Crypto Briefing; older figures come from the Congressional Research Service, the World Bank and a Cambridge study (Vahabi). Where sources differ, such as the 2 September rate (2.1 vs 2.2 million) and the 2018 peak, we say so. We could not open the UK Commons Library briefing and attribute its 84% figure to it. The 31 October figure is a tracker reading we could not corroborate. Articles here are informational and are not investment or currency-trading advice.
Sources & further reading
Every dated entry above was checked against these references. Last reviewed 1 November 2026.
- Associated Press: Iran's currency hits a new record low as war erodes the country's economic stability
- Caspian Post: Iranian rial plunges to new record low amid economic pressure (29 Sep 2026)
- Euronews: Iranian rial hits record low as US dollar breaks 2.1 million mark (2 Sep 2026)
- Euronews: Iran's inflation spiral deepens as rial slides and tensions rise (30 Jun 2026)
- Al Jazeera: Iran's currency drops to record low against dollar as tensions soar (27 Jan 2026)
- Congressional Research Service: Iran sanctions (RS20871)
- World Bank: Iran Economic Monitor, Spring 2024
- Vahabi, Journal of Institutional Economics: Recurrent exchange rate shocks and Anfal in Iran