Sensex Crashes Since 1992: India’s Biggest Falls by Points and Percent
Sensex crashes since 1992 compared: 4,390-point 2024 fall, 13.15% COVID drop, 2008 and the 2026 Iran-war sell-off, with intraday and closing figures.
Latest Story
The biggest Sensex crashes since 1992 include the Harshad Mehta scam, the 2008 global financial crisis, the COVID-19 panic, the 2024 election shock and, most recently, the 2026 Iran-war sell-off. This timeline runs newest first and labels every figure as an intraday low or a closing fall, in points or in percent, because the same session can be a 2,273-point crash or an 875-point one depending on the basis.
💡 Short Answer
The record one-day fall in points is 4,389.73 on 4 June 2024 (election results). The largest closing percentage fall is 13.15 per cent on 23 March 2020 (COVID-19), ahead of 12.77 per cent on 28 April 1992 (Harshad Mehta scam). The 2008-09 bear market took the index down about 61 per cent. In 2026 the Iran war brought falls of about 2,496 points on 19 March and more than 1,600 points on three later days.
Sensex Crashes: Key Questions
The Crash Record in Ten Points
- 1992: 570 points and 12.77% on 28 April as the Harshad Mehta scam unravelled.
- 2004: 564.71 points (11.14%) on election results; first index-wide halt.
- 2006-07: margin calls and participatory-note curbs produced halts and huge intraday falls that partly reversed.
- 2008: 21-22 January swings, then a 10.96% close on 24 October and a 61% drawdown.
- 2015-16: China devaluation (1,624 points) and demonetisation day (1,689 points).
- 2020: four of the ten biggest point falls in March alone; record 13.15% on the 23rd.
- 2022: 2,702.15 points on the Russian invasion of Ukraine.
- 2024: record 4,389.73 points on election day, then 2,222.55 on 5 August.
- 2025: tariff shock of 7 April, with a 3,940-point intraday gap versus a 2,227-point close.
- 2026: Budget-day STT fall, the Iran-war March crashes, and a 1,923-point intraday drop on 8 July.
Sensex Crashes Timeline, Latest First
Each entry is tagged by trigger and ends with why it matters. Use the filter to isolate a type.
Scandals, politics or global shocks? Filter the Sensex crashes timeline by trigger.
–
Sensex near 72,000-74,000, about 15% below its 2024 record Global shock
In mid-October 2026 the Sensex was trading in a band of roughly 72,000 to 74,000. It closed at 71,924.68 on 12 October (down 0.76 per cent) and at 72,781.89 on 14 October (down 0.34 per cent), then gained more than 600 points in early trade on 15 October as crude oil eased after the US relaxed shipping sanctions on some vessels. Against the record close of 85,836.12 set on 26 September 2024, a close of 72,781.89 is about 15 per cent lower. The month has had large drifts but no single-day fall near the size of March’s. One report of a very long unbroken losing streak could not be verified and is not used here.
2026
US-Iran ceasefire collapses: intraday fall of 1,923 points Global shock
On 8 July 2026 the Sensex fell as much as 1,923 points to an intraday low of 76,259.03 after the US-Iran ceasefire broke down; the president declared the truce “over”, US strikes hit Iranian targets and Iran retaliated against US facilities in the Gulf. At the time of one report the index was down 1,601.13 points (2.05 per cent) at 76,579.59, the Nifty had dropped as much as 594 points, India’s volatility index jumped 28 per cent and the rupee weakened to about 95.7 per dollar. That report called it the worst day since March. The closing figure was not confirmed for this page, so only the intraday and time-of-report numbers are given.
2026
Sensex closes 1,313 points lower at 76,015 as oil tops $105 Global shock
Upstox reported that the Sensex closed 1,313 points lower at 76,015 on 11 May 2026, its biggest one-day loss in more than two months, as crude oil rose above $105 a barrel after the US president rejected Iran’s response to a proposed peace deal. The Nifty ended below 23,820. The move is smaller than the March falls but shows how closely the index was tracking oil and war headlines through the spring.
2026
Two more 1,600-plus point falls in four days Global shock
The March sell-off did not end on 23 March. On 27 March the Sensex ended 1,690 points lower with the Nifty below 23,000 and about Rs 9 lakh crore of market value lost; on 30 March it fell 1,635 points, the Nifty dropped about 2 per cent and the rupee crossed 95 per dollar, according to the reports cited in Wikipedia’s Sensex entry. Together with 19 and 23 March, that made four falls of more than 1,600 points in the last two weeks of the month.
2026
Sensex closes 1,837 points lower at 72,696 Global shock
On 23 March 2026 the Sensex closed at 72,696, down 1,837 points or 2.46 per cent, with the Nifty at 22,513, down 602 points. Twenty-six of the 30 Sensex stocks declined and every BSE sectoral index ended lower as the West Asia conflict escalated and global markets opened weak. All India Radio said the market had fallen to levels last seen in April 2025.
2026
Black Thursday: Sensex falls about 2,500 points, 3.3% Global shock
The Sensex fell by roughly 2,496 points on 19 March 2026, about 3.3 per cent (Dhan reports 3.26 per cent), the biggest fall of 2026 and the sixth-largest one-day point fall on Wikipedia’s table. It opened more than 2.5 per cent lower at about 74,750. Reports put the loss of investor wealth at about Rs 12 lakh crore as oil surged past $110 a barrel on fears around the Strait of Hormuz and the US-Israel-Iran war. Sources differ by a point or so (2,496 or 2,497) and the closing level was not confirmed for this page. Earlier in March, on the 9th, the Sensex had already fallen 1,353 points.
2026
Union Budget day: Sensex falls 1,547 points on an STT hike Politics & policy
On Budget day, 1 February 2026, the Sensex fell 1,547 points and the Nifty dropped below 24,900 after the Budget proposed a higher securities transaction tax on derivatives, according to a Mint report cited in Wikipedia. Budgets have moved the index before, including a fall of nearly 1,000 points (987.96) on 1 February 2020, but the move shows that a tax change alone can trigger a sharp one-day reaction.
2025
US tariff shock: 2,227 points lower at close, 3,940 at the low Global shock
On 7 April 2025, after the United States announced sweeping reciprocal tariffs, global markets fell sharply. The Sensex opened more than 3,300 points lower, touched an intraday low of 71,425.01, almost 3,940 points below the previous close of 75,364.69, and then recovered to close at 73,137.90, down 2,226.79 points or 2.95 per cent. All 30 Sensex stocks ended lower, Tata Steel the biggest drag at 7.16 per cent, and the volatility index jumped 65.7 per cent to 22.79. The brief’s “almost 4,000 points” is the intraday low; the closing loss was 2,227.
2024
Global sell-off: 2,222.55 points lost Global shock
On 5 August 2024 the Sensex fell 2,222.55 points as global equities slid on US recession worries and the unwinding of yen carry trades. It was the eighth-largest point fall on Wikipedia’s table and came only two months after the election-day drop, and a few weeks before the index set its record in September.
2024
Election results: Sensex falls 4,389.73 points, a record Politics & policy
On 4 June 2024, the day general-election results were counted, the Sensex closed at 72,079.05, down 4,389.73 points or 5.74 per cent from 76,468.78, the largest one-day fall in points in its history. The Bharatiya Janata Party won fewer seats than expected and lost its single-party majority, so it needed coalition partners to form the government. The Nifty fell about 5.9 per cent that day and recovered to 24,141.95 by 1 July. Markets had priced in a bigger majority, and the reaction reflected that gap.
2022
Russia invades Ukraine: Sensex falls 2,702 points Global shock
On 24 February 2022 the Sensex lost 2,702.15 points as Russia launched its invasion of Ukraine, sending oil prices up and global equities down. Wikipedia lists it as the fifth-largest one-day fall in points. It fits a pattern in which war and oil-price shocks, whether in Europe in 2022 or West Asia in 2026, have caused India’s sharpest sell-offs.
2020
COVID-19: 3,934.72 points and 13.15% in one day Global shock
On 23 March 2020 the Sensex closed at 25,981.24, down 3,934.72 points or 13.15 per cent as the pandemic and India’s lockdown announcements triggered extreme selling. It was the largest one-day percentage fall at the close on the figures reviewed and the second-largest fall in points. The index was at its lowest since 2016. The brief gives the same two numbers; its description of a record high in February 2020 is corrected in the next entry.
A bear market in weeks: 20 January peak to 23 March low Global shock
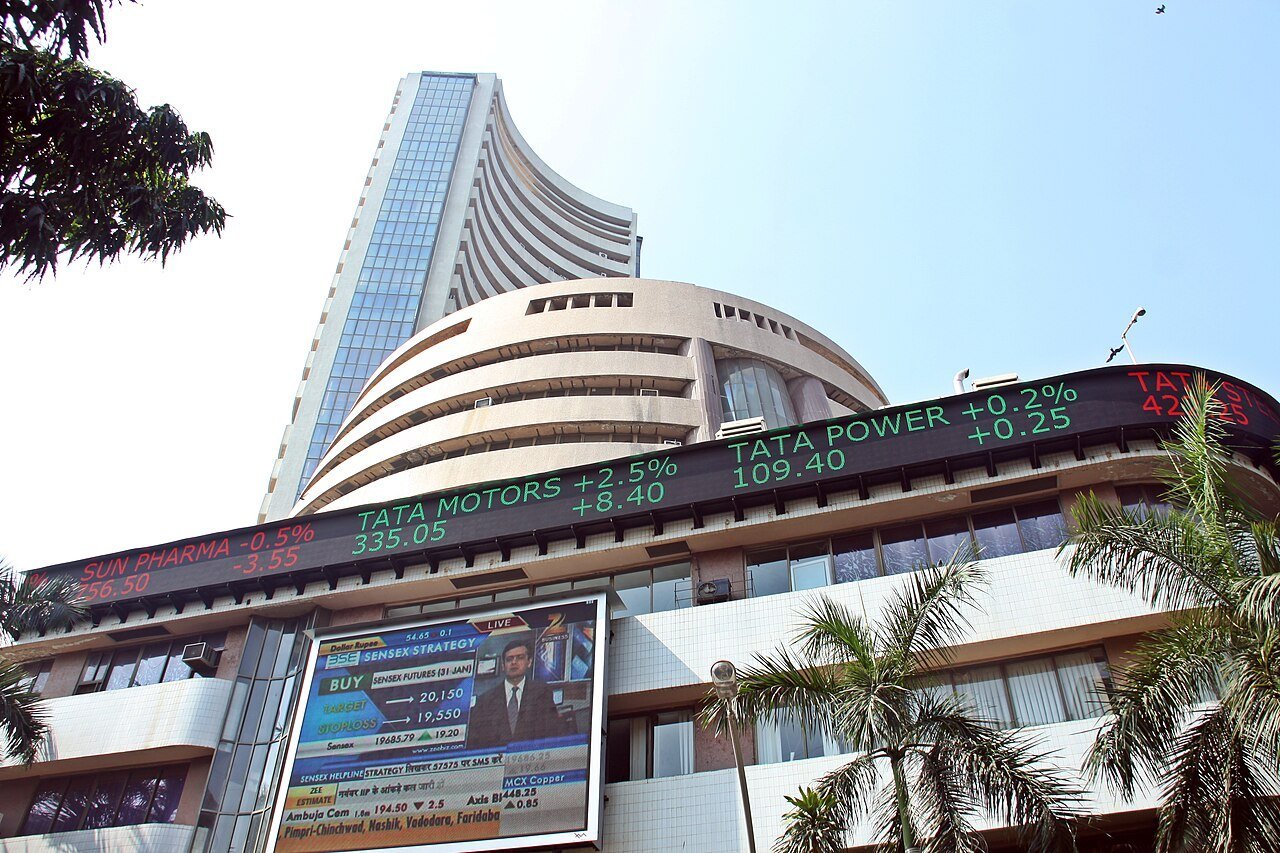
The Sensex reached a record of about 42,273 on 20 January 2020, not in February as the brief says. By 23 March the close was 25,981, a fall of about 38.5 per cent. On 9 March the index fell 1,941.67 points; on 12 March, the day the WHO called COVID-19 a pandemic, it fell 2,919.26 points (8.18 per cent) to 32,778.14. On 13 March the Sensex hit its lower circuit and trading paused for 45 minutes, with an intraday low of 29,687.52, 9.43 per cent below the previous close, yet it ended the day up 1,325 points. On 16 March it lost 2,713.41 points. Four of the ten largest one-day point falls in history came in this single month.
2016
Demonetisation week: Sensex falls 1,689 points Politics & policy
The day after the Government announced the withdrawal of Rs 500 and Rs 1,000 notes on 8 November 2016, the Sensex fell 1,689 points to 26,902, about 5.9 per cent, and the Nifty lost 541 points to 8,002. The US presidential election result also became clear that day, and analysts at the time linked the fall to both. The market recovered over the following weeks.
2015
China-led sell-off: 1,624 points, 5.9% Global shock
On 24 August 2015, after China’s currency devaluation and slowdown fears hit world markets, the Sensex fell 1,624 points to 25,741, about 5.9 per cent, and the Nifty closed at 7,809. At the time it was the largest one-day point fall in the index’s history. India’s fundamentals had not changed; foreign investors were cutting emerging-market risk.
2008
Global financial crisis: Sensex falls 10.96% to 8,701 Scandal & credit
On 24 October 2008 the Sensex closed at 8,701.07, down 1,070.63 points or 10.96 per cent, as the collapse of US financial institutions froze credit and foreign investors pulled money out of India. Three days later, on 27 October, it touched an intraday low of 7,697.39 before closing at 8,509.56. The closing low of the bear market came on 9 March 2009 at 8,160.40. From its closing high of 20,873.33 on 8 January 2008 (the intraday peak was 21,206.77 on 10 January) to that closing low is a fall of about 61 per cent. See our Lehman Brothers collapse story for the trigger.
2008
Black Monday and a 2,273-point intraday plunge Scandal & credit
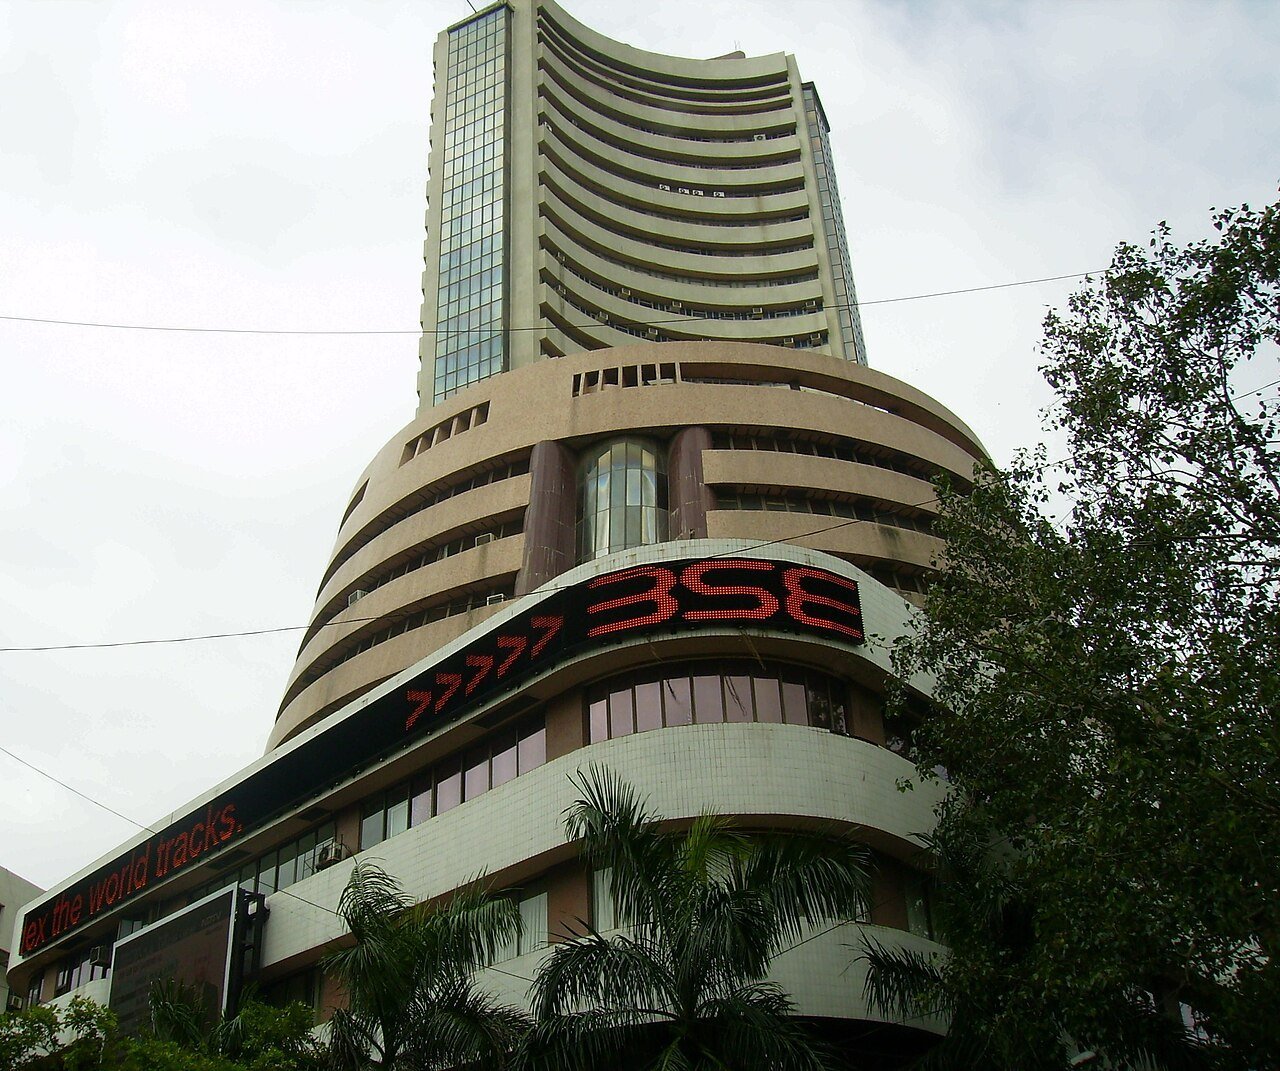
On 21 January 2008 the Sensex fell 1,408.35 points to 17,605, the largest one-day point fall at that time, after touching 16,963.96 intraday. The next day, 22 January, it hit the lower circuit within a minute of opening, fell as far as 15,332, which is 2,273 points below the previous close, and recovered to close at 16,730, down 875 points. So the often-quoted figure of more than 2,200 points is the fall from the previous close at the intraday low, not the closing loss. Worries over US subprime losses, foreign selling and leveraged positions drove the fall.
2007
Participatory-note curbs: 1,744 points lost in minutes Politics & policy
On 16 October 2007 SEBI proposed curbs on participatory notes, a route that then accounted for roughly half of foreign institutional investment. On 17 October the Sensex dropped 1,743.96 points (9.15 per cent) to 17,307.90 within minutes and trading was halted for an hour. After the finance minister said the Government was not against foreign investors, it recovered to close at 18,715.82, down 336.04 points. The 717.43-point, 3.83 per cent closing fall was on 18 October, and the brief’s sources sometimes conflate the two days.
2006
Margin calls: 826 points on 18 May, a halt on 22 May Scandal & credit
On 18 May 2006 the Sensex fell 826 points, about 6.8 per cent, to 11,391 in a global emerging-market sell-off. On 22 May it fell 1,111.70 points (10.16 per cent) to 9,826.91 by 11:55, and the index circuit breaker halted trading for an hour, only the second such halt in Indian history. It recovered to close at 10,481.77, down 456.84 points or about 4.2 per cent. Margin calls on leveraged positions amplified the fall, and the finance minister and SEBI chairman reassured markets that there was no payment crisis.
2004
Election surprise: 11.14% closing fall and two halts Politics & policy
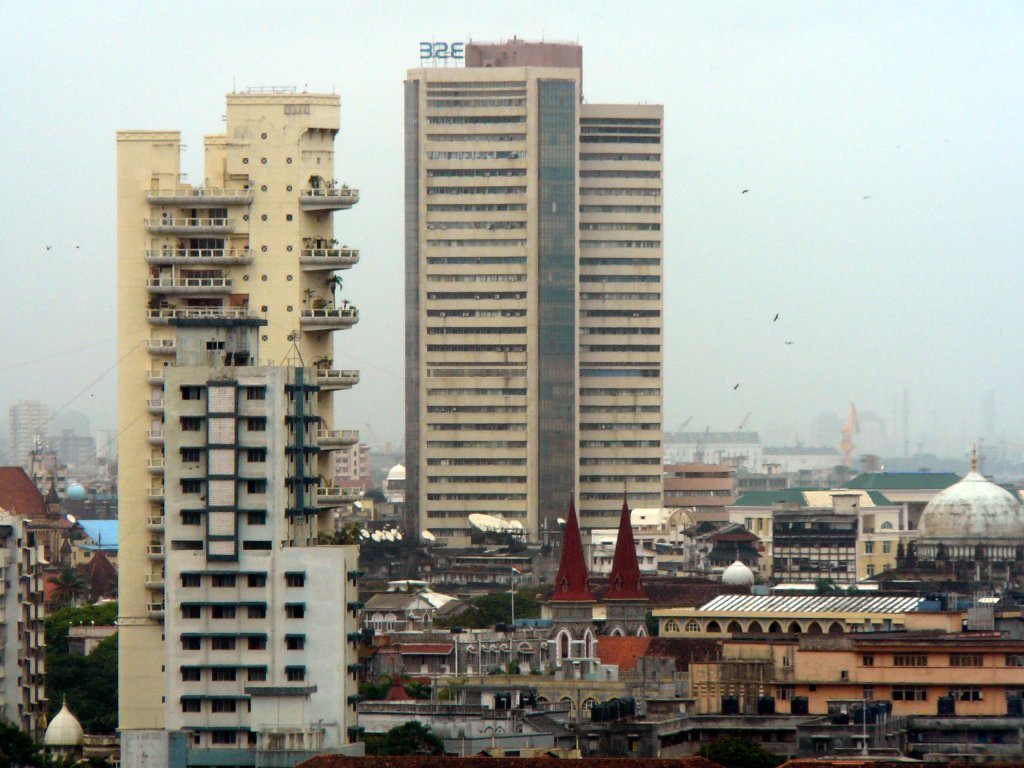
On 17 May 2004 the Sensex fell 564.71 points, or 11.14 per cent, to close at 4,505.16 after election results showed the NDA government losing power and raised doubts about reforms and privatisation. The index circuit breaker halted trading for an hour at about 10:16 and again at about 11:18, the first index-wide halt in India. The intraday fall was about 15.5 per cent, which Wikipedia calls the largest percentage fall in the index’s history, although the closing fall was smaller. Markets recovered as the new coalition clarified its economic policy.
1992
Harshad Mehta scam: 570 points and 12.77% in a day Scandal & credit
On 28 April 1992 the Sensex fell 570 points, or 12.77 per cent, to about 3,870 as the securities scam linked to broker Harshad Mehta unravelled; press reports in the days before had exposed the diversion of bank funds through fake bank receipts. The index had risen from about 2,000 in January 1992 to 4,467 in April, then fell to 2,529 by August, according to reports. The episode exposed weaknesses in settlement and in bank oversight and fed the case for stronger market regulation. See our Harshad Mehta scam timeline for the full story.
The Biggest Falls in Points
The Biggest Falls in Percent
Intraday Panic vs Closing Loss
Major Sensex Crashes at a Glance
Closing and intraday figures are labelled separately. Figures are rounded and may differ slightly between sources.
| Date | Trigger | Close or intraday | Figure |
|---|---|---|---|
| 19 Mar 2026 | Iran war, oil above $110 | Close | About 2,496 points (3.26%) |
| 7 Apr 2025 | US reciprocal tariffs | Close / intraday | 2,226.79 points (2.95%) / low 3,940 points below previous close |
| 4 Jun 2024 | Election results | Close | 4,389.73 points (5.74%) |
| 24 Feb 2022 | Russia invades Ukraine | Close | 2,702.15 points |
| 23 Mar 2020 | COVID-19 and lockdown | Close | 3,934.72 points (13.15%) |
| 9 Nov 2016 | Demonetisation, US election | Close | 1,689 points (about 5.9%) |
| 24 Aug 2015 | China devaluation sell-off | Close | 1,624 points (about 5.9%) |
| 24 Oct 2008 | Global financial crisis | Close | 1,070.63 points (10.96%) |
| 22 Jan 2008 | Global turmoil, subprime | Intraday / close | 2,273 points at low / 875 points at close |
| 17 Oct 2007 | Participatory-note curbs | Intraday / close | 1,743.96 points at halt / 336.04 points at close |
| 22 May 2006 | Margin calls, EM sell-off | Intraday / close | 1,111.70 points at halt / 456.84 points at close |
| 17 May 2004 | Election result | Close / intraday | 564.71 points (11.14%) / about 15.5% at the low |
| 28 Apr 1992 | Harshad Mehta scam | Close | 570 points (12.77%) |
Reading Crash Numbers
| Term | Meaning | Why it matters |
|---|---|---|
| Intraday fall | Lowest level in the session versus the previous close | Shows peak panic, often later reversed |
| Closing fall | Change between the previous close and the day’s close | The figure used for official records and rankings |
| Points vs percent | Absolute change versus change relative to the index level | Percent compares eras; points favour high index levels |
| Circuit breaker | Index-based trading halt: 1 hour at 10%, 2 hours at 15% (per Parliament reply) | First used 17 May 2004 |
| Drawdown | Fall from a peak to a later trough | A 2008-09 style bear market, not one day |
| Market capitalisation | Total value of listed shares | Media often quote “lakh crore wiped out” |
Why Do Sensex Crashes Happen?
Financial scandals and loss of trust. Fraud and manipulation, as in 1992, make investors doubt prices and reported numbers.
Global economic shocks. Recessions, banking crises and pandemics hit expected earnings and risk appetite: 2008, 2015, 2020 and 2025.
War and oil. India imports most of its oil, so wars in Europe or West Asia, as in 2022 and 2026, hurt the rupee, inflation and profits.
Political and policy surprises. Election results in 2004 and 2024, the 2007 note curbs and the 2026 tax change moved expectations at once.
Foreign investor outflows. Large portfolio investors can sell together and amplify declines.
Leverage and herd behaviour. Margin calls force selling, and panic can feed on itself, as on 22 May 2006.
Did the Sensex Recover After Each Crash?
Yes, each time, at different speeds. The 2008-09 bear market took the index about 61 per cent lower from its closing high to its closing low, and the January 2020 record of about 42,273 was roughly double the 2008 peak. After the 23 March 2020 close of 25,981, the index went on to records above 85,000 by September 2024. But the 2024 record close of 85,836.12 was about 15 per cent above the mid-October 2026 level, so a recovery to new highs does not mean every investor, or every stock, recovered, and there is no guarantee of the next one.
Six Lessons From the Crashes
1. Label every number. Say whether it is intraday or close, points or percent, and which date.
2. Compare eras in percent. Points favour recent, higher index levels; 570 points in 1992 was 12.77 per cent.
3. Leverage turns falls into spirals. Margin calls drove 2006 and 2008.
4. Shocks cluster. March 2020 and March 2026 each brought several giant falls within two weeks.
5. A crash is not a buy signal. Further falls followed many first big drops, including 2008 and March 2026.
6. Do not predict the bottom. The 2008 low came months after the first crash, and 13 March 2020 turned a crash into a rebound within hours.
The Popular Story vs the Record
Short versions of the crash story blur several details.
| Popular version | What the record shows |
|---|---|
| The 1992 Harshad Mehta fall is the biggest percentage crash | On closing figures it is second (12.77%) behind 23 March 2020 (13.15%); the 2004 intraday fall was deeper (about 15.5%) |
| The 7 April 2025 crash was almost 4,000 points | That was the intraday low; the Sensex closed 2,226.79 points lower (2.95%) |
| The Sensex lost 2,200 points in a day on 22 January 2008 | It fell 2,273 points at the low but closed down 875 points |
| The 17 October 2007 close was 717 points lower | The 717.43-point close was on 18 October; 17 October closed 336.04 points lower |
| The pre-COVID record was in February 2020 | The record of about 42,273 was on 20 January 2020 |
| Sensex crashes ended with the 2024 election | The index fell about 2,496 points on 19 March 2026 and 1,923 intraday on 8 July 2026 |
The Crashes in Numbers
| Measure | Figure | Source and caveat |
|---|---|---|
| Record one-day fall, points | 4,389.73 (4 Jun 2024) | Wikipedia table |
| Record one-day fall, closing % | 13.15% (23 Mar 2020) | Wikipedia crashes page |
| Largest intraday %, 2004 | About 15.5% | Wikipedia; close was 11.14% |
| Bear market 2008-09 | About 61% fall | Closing high 20,873.33 to closing low 8,160.40 |
| Peak before COVID | About 42,273 (20 Jan 2020) | Fall to 25,981 close is about 38.5% |
| 2024 record close | 85,836.12 (26 Sep 2024) | Wikipedia table; later highs not checked |
| Mid-Oct 2026 close | 72,781.89 (14 Oct) | Kotak Neo; about 15% below the 2024 record |
| 2026 falls above 1,600 points | 19, 23, 27, 30 Mar | Reports cited by Wikipedia |
Who Shapes a Crash
Roles as described in public sources.
BSE Ltd
Calculates the Sensex, the 30-company benchmark, and runs the index circuit breakers.
SEBI
Proposed the 2007 participatory-note curbs and oversees market conduct.
Ministry of Finance
Budget proposals such as the 2026 STT rise and crisis reassurances in 2006 and 2007 came from here.
Reserve Bank of India
Sets rates and manages the rupee, which weakened past 95 per dollar in 2026.
FPIs and FIIs
Their outflows amplified falls in 2008, 2015 and 2025.
Leveraged traders
Margin calls drove the May 2006 sell-off; bank-receipt abuse drove 1992.
Business press
Reports such as Sucheta Dalal’s in 1992 and live market blogs supply many of the numbers used here.
Retail and institutions
Their reactions determine how far a shock travels and how fast prices rebound.
Explore More Timelines
People Also Ask
Frequently Asked Questions
Related AiTimeline Stories
⚠️ Editorial Note
This page is a dated, sourced record of market falls, not investment advice, and past recoveries do not predict future ones. Figures are rounded and can differ between sources depending on whether they use intraday lows, closing changes or peak-to-trough declines; each is labelled. Several details in the original brief were corrected: the pre-COVID record was on 20 January 2020, not February; 17 October 2007 closed 336.04 points lower (the 717.43-point fall was 18 October); 22 January 2008 was a 2,273-point intraday fall from the previous close and an 875-point closing fall; 7 April 2025 closed 2,226.79 points lower; the 1992 fall ranks second, not first, by closing percentage. The brief also omitted 2026 (Budget day, the March war crashes, 11 May, 8 July), 2016, 2022 and 5 August 2024; these are added. Closing levels for 19 March 2026 and 8 July 2026, and the Sensex record high after 2024, were not confirmed. Dot-com era falls of 2000-01 were not verified and are omitted.
Sources & further reading
Every dated entry above was checked against these references. Last reviewed 21 October 2026.
- BSE SENSEX (largest falls, record values, 2024-2026 events)
- Stock market crashes in India
- India suspends stock market trading (17 May 2004)
- Market mayhem unabated (22 May 2006)
- Indian financial markets in the aftermath of the Harshad Mehta-headlined securities scam
- Stock market live updates, 7 April 2025 (close, intraday range)
- Sensex crashes nearly 2,500 points, Rs 12 lakh crore wiped out as oil surges past $110 (19 Mar 2026)
- Sensex down by 1,837 pts, Nifty tumbles by 602 pts (23 Mar 2026)
- Sensex drops 1,313 points, biggest single-day loss in over two months (11 May 2026)
- Stock market crash on 8 July 2026: Sensex drops 1,923 points intraday
- Stock market update, 15 October 2026 (previous close 72,781.89)
- BSE India: official exchange website and index data