England Drought 2026: Live Status, Causes and Full Timeline
England's 2026 drought explained: Environment Agency status, reservoir and river levels, hosepipe bans by company, and the full history since 1976.
Latest Story
England is living through one of its most serious water crises in decades. As of a 16 September 2026 National Drought Group meeting, the government and Environment Agency describe almost three-quarters of England as still in official drought status, with reservoirs down to 56.1% of capacity nationally (19.7 percentage points below the seasonal average) and ten water companies enforcing hosepipe bans covering an estimated 30 million people, after England’s driest July on record in a rainfall series dating back to 1836. This is the third time England has entered official drought in five years, after 2022 and 2025.
None of this means England is running out of water in any absolute sense — the country still receives roughly the same total annual rainfall it always has. The problem is that not enough of that rain fell where and when it was needed, on top of a water system already stretched by population growth, ageing pipes and years of underinvestment in new supply. The Environment Agency now says England needs 120% of typical rainfall over the next seven months (to April 2027) for every affected area to recover, and even under a wetter-than-average scenario, Devon and Cornwall and East Anglia are projected to remain in drought at that point — a reminder that, as this page explains, even a wet spell now would not instantly end the drought.
🧠 Short Answer
Yes, England is currently in a widespread, serious drought. As of a National Drought Group meeting on 16 September 2026, ten of the Environment Agency’s 14 operational areas remain formally in drought and four more in “prolonged dry weather,” with almost three-quarters of England affected overall following the driest July on the England rainfall record (since 1836) and a summer that brought only 64% of expected rainfall. Reservoirs are down to around 56.1% full nationally (19.7 percentage points below the long-term average), and ten water companies — including Bristol Water and Wessex Water, each imposing their first hosepipe ban since the mid-1970s — have restrictions covering an estimated 30 million people. It is England’s third drought in five years, after 2022 and 2025, and the Environment Agency says the country needs 120% of typical rainfall over the next seven months (to April 2027) for every area to recover.
England Drought 2026: Key Questions
What to Know About England’s 2026 Drought
- England is not “running out of water” in an absolute sense. The country still receives its normal long-run rainfall total most years; the crisis is about timing, location and storage, not a permanent shortfall.
- This is England’s third drought in five years. 2022, 2025 and 2026 have each brought official Environment Agency drought declarations — a frequency without a modern precedent in the instrumental rainfall record.
- 2025 mattered as much as 2026. Drought hit the north and Midlands hard in 2025; several reservoirs and rivers entered 2026 already below normal before this year’s dry spell even began.
- July 2026 was England’s driest July on record since 1836, according to the Environment Agency — drier, England-wide, than 2022’s widely reported “driest since 1935.”
- Reservoir storage numbers can mislead if read in isolation. A national average of 56.1% (as of mid-September 2026) hides reservoirs already “exceptionally low,” while other regions sit closer to normal.
- Hosepipe bans affect gardens and cars, not drinking water. Showers, toilets, drinking supply and washing machines are unaffected; only specific outdoor and non-essential uses are restricted.
- Chalk streams are a genuinely global rarity concentrated in England. Around three-quarters of the world’s roughly 210 chalk streams are in England, and they are especially sensitive to low flows and abstraction.
- New reservoirs will not fix 2026. Havant Thicket (Hampshire) is due in 2031 at the earliest; the proposed White Horse Reservoir near Abingdon is not expected to open before 2040.
- Desalination is not a simple fix either. Thames Water’s Beckton desalination plant, built in 2010, had run only five times by September 2025 and produces water at roughly 28 times the standard price.
- One wet month will not end this drought. Reservoirs, groundwater and soil moisture all recover on different timescales, and it typically takes a sustained wet season, not a single storm, to fully reverse a drought like this one.
England’s Drought in Three Numbers
The headline figures that matter most right now, and why each one is measured the way it is.
Headline Figure
Rainfall Record
Frequency
What Is Happening in England Right Now?
The situation in one paragraph, before the full detail below.
England has spent the summer of 2026 getting drier, not just staying dry. By early July, seven of the Environment Agency’s operational areas — East Anglia, Hertfordshire and London, Thames Valley, Hampshire and the Isle of Wight, Devon and Cornwall, the West Midlands, and Wessex — had been formally declared in drought, covering roughly half the country. Through late July and into August, dry conditions pushed into the central Midlands and north-east England too, and by mid-September, government figures put the share of England in drought at almost three-quarters of the country, with the number of Environment Agency areas formally in drought unchanged at ten (plus four in prolonged dry weather) since early August. Ten water companies now have Temporary Use Bans (hosepipe bans) in force, together covering an estimated 30 million people — including Bristol Water and Wessex Water, each imposing its first hosepipe ban since the mid-1970s. Reservoir storage nationally has fallen further, to 56.1% of capacity as of 15 September 2026, 19.7 percentage points below where it would normally be at this point in the year, and environmental incidents recorded in 2026 have risen to 349, already above the whole of 2025’s total. Environment Agency chief executive Philip Duffy told the 16 September National Drought Group meeting: “The drought situation remains very serious, and we cannot underestimate the challenge ahead over the coming months.”
Two things distinguish 2026 from most previous English droughts. First, England’s official rainfall series (which the Environment Agency dates back to 1836) recorded its driest July on record this year — not just “driest since the 1930s,” as was widely reported for 2022, but the driest full stop, England-wide. Second, this is not an isolated dry summer: it is the third time in five years that England has entered official drought, after 2022 and 2025, meaning water resources have had comparatively little time to recover between events. Water Minister Emma Hardy summed up the government’s framing of that pattern on 29 July 2026: “Our climate is changing, droughts are increasingly common, and we need to be prepared for this new normal.” By September, the Environment Agency was framing recovery itself as uncertain: it says England needs 120% of typical rainfall over the seven months to April 2027 for every area to come out of drought, and under its most likely scenario Devon and Cornwall and East Anglia would still be in drought at that point even with a wetter-than-average autumn and winter.
Why Is England in Drought?
It is rarely just “not enough rain.” Several factors are stacking on top of each other at once.
England’s 2026 drought is not the result of a single cause, and reducing it to “climate change” alone would flatten a more complicated, more useful picture. At least six distinct pressures are compounding each other this year:
- An exceptionally dry, hot summer. July 2026 brought just 10% of the long-term average rainfall across England, with some southern and eastern areas receiving under 1%, according to the Environment Agency. By early August, England had gone seven consecutive weeks with under 10mm of rain.
- High temperatures driving evaporation. Multiple heatwaves through May, June and July 2026 increased evaporation from soil, reservoirs and vegetation, compounding the effect of low rainfall rather than simply sitting alongside it — dry ground under a heatwave loses moisture faster than dry ground in mild weather.
- An unfinished recovery from the 2025 drought. Parts of northern England and the Midlands were still in drought status as recently as August 2025. Reservoirs and rivers there did not necessarily refill to normal levels over the following winter before 2026’s dry spell began layering on top.
- Low river flows and falling groundwater. By early August 2026, over half of monitored river sites were classed as notably or exceptionally low, and groundwater-fed chalk and limestone aquifers — which respond more slowly than rivers — were also under strain in parts of southern and eastern England.
- Demand that does not fall just because supply does. Domestic, agricultural and industrial water demand typically rises during hot, dry weather — more garden watering, more irrigation, more drinking water — at precisely the moment supply is under the most pressure.
- A water system with limited slack. England’s population has grown, housing development continues in some of the driest parts of the country, and leakage still accounts for a meaningful share of treated water lost before it reaches a tap, all of which narrow the margin between normal supply and a crisis.
Climate change is a real and measurable contributor to several of these factors — particularly the tendency toward hotter, drier summers in southern England, discussed in detail further down this page — but it operates through and alongside the other five pressures, not instead of them. A useful way to read 2026: this is what happens when a naturally dry summer lands on a water system that already had very little margin for error.
Drought and Water Scarcity Are Not the Same Thing
Two related but distinct problems, often used interchangeably in headlines.
Drought is a weather-driven, temporary condition: an extended period of below-average rainfall that reduces river flows, groundwater levels, reservoir storage and soil moisture below what an area normally experiences. It ends, eventually, when enough rain falls to restore those levels — though as this page explains, “enough rain” is a higher bar than most people assume.
Water scarcity (sometimes called water stress) is structural, not weather-driven: it describes a place where demand for water is high relative to the reliable supply available, independent of any particular dry spell. The Environment Agency classifies large parts of south-east England as “seriously water stressed” in most years — drought or no drought — because of high population density, limited local rainfall, and a heavy reliance on rivers and aquifers that are already worked hard even in normal conditions.
A simple way to picture the difference: drought is the weather; water scarcity is the geography and the plumbing. A region with low underlying water scarcity can still experience a severe drought (a temporary shock to an otherwise comfortable system). A region with high underlying water scarcity, like much of the South East, experiences even a moderate drought as a crisis, because it had little spare capacity to begin with. 2026 is unusual precisely because it combines both: a severe weather-driven drought landing on some of England’s most structurally water-stressed regions at once.
2025–2026 England Drought Timeline
Reverse chronological. Every entry is sourced to an Environment Agency report, GOV.UK release, or named news organisation.
National Drought Group: England needs 120% of normal rainfall to recover
Meeting on 16 September, the National Drought Group said almost three-quarters of England remained in drought, with the Environment Agency’s area count unchanged at ten in drought and four in prolonged dry weather. The Agency said England needs 120% of typical rainfall over the seven months to April 2027 for every area to recover, and under its most likely scenario Devon and Cornwall and East Anglia would still be in drought at that point — putting roughly a 1-in-4 chance on around half of England remaining in drought by spring 2027. The government announced a £65 million support package for drought-hit farmers (including up to £15 million for on-farm reservoirs), £100 million for extreme-weather and wildfire response, and Planning Act changes intended to speed up approval of nine reservoirs planned by 2050. The following day’s EA weekly report put reservoir storage at 56.1% (19.7 points below average) and 2026 environmental incidents at 349, already above 2025’s full-year total of 321.
Bristol Water and Wessex Water impose first hosepipe bans since the 1970s
Bristol Water and Wessex Water each announced Temporary Use Bans — their first since 1975 and 1976 respectively — bringing the number of English water companies with active hosepipe bans to ten. Wessex Water said demand across its region had stayed above 400 million litres a day, around 30% above average. Two more reservoirs, Ardingly (South East Water) and Clatworthy (Wessex Water), joined the Environment Agency’s “exceptionally low” list during this period.
71.3% of England now in drought
Government figures put roughly 71.3% of England in drought, up from about half in late July, as the central Midlands and north-east England joined previously affected regions. DEFRA said all regions of the UK were under water-resource pressure, with none rated “normal.” A fifth heatwave of the summer, with temperatures forecast into the mid-30s°C, was expected with little rain in the outlook.
Environment Agency: driest July on record for England
The Environment Agency’s weekly report confirmed July 2026 as England’s driest July on record in a series dating back to 1836, with the month bringing just 10% of the long-term average and parts of the east and south-east under 1mm for the week. Reservoir storage had fallen to 69%, 11.6 percentage points below average, with five reservoirs — Blagdon, Clywedog, the Dove Group, Hanningfield and Wimbleball — classed as exceptionally low. Eight water companies were now enforcing hosepipe bans, covering more than 25 million customers, and 1,534 abstraction licence restrictions were in force, including 302 in East Anglia alone.
Drought officially declared across half of England
The Environment Agency formally declared drought status in seven areas — East Anglia, Hertfordshire and London, Thames Valley, Hampshire and the Isle of Wight, Devon and Cornwall, the West Midlands, and Wessex — with a further six areas in prolonged dry weather. July rainfall stood at just 7% of average nationally, falling to around 1% across southern England; 78% of monitored rivers were below normal or lower. Helen Wakeham, the Environment Agency’s director for the response, said: “The hot and dry weather means we are currently using water faster than nature can replenish it.” Met Office chief meteorologist Will Lang added that many areas had “received very little or no rainfall throughout July, extending below-average rainfall since spring.”
Hosepipe bans roll out company by company
Restrictions began in Kent under South East Water on 3 July, followed within days by Cambridge Water, Anglian Water and Southern Water across the eastern and southern supply areas. Thames Water’s ban, covering London, the Thames Valley and the home counties, took effect on 23 July — the largest single Temporary Use Ban of the year, affecting an estimated 10 million-plus customers. Affinity Water followed with restrictions across its Central region (Bedfordshire, Berkshire, Buckinghamshire, Hertfordshire, Surrey and parts of Essex and London); exact start dates for Affinity’s ban are reported inconsistently across sources (17 vs 23 July) and should be confirmed directly with the company for any time-sensitive purpose.
Record June heat, weeks without meaningful rain
England recorded a new national June temperature record — an initial reading of 37.7°C was later verified by the Met Office’s quality-control process at 38°C — and parts of Devon and Hampshire went 49–50 consecutive days without measurable rainfall during the following dry spell, among the longest such streaks logged at those stations. Conditions were already being described as a rapid, or “flash,” escalation from prolonged dry weather into drought (see the Flash Drought section below for how that term is and isn’t officially used).
Recovery from 2025 was partial, not complete
Comparing the Environment Agency’s August 2025 and August 2026 weekly reports shows a telling pattern: the two droughts hit different parts of the country. In August 2025, drought status was concentrated in Cumbria and Lancashire, Greater Manchester/Merseyside/Cheshire, Yorkshire, the East Midlands and the West Midlands — the north and Midlands. By July 2026, the first areas to reach drought status were East Anglia, Hertfordshire and London, the Thames Valley, Hampshire, Devon and Cornwall, and Wessex — the south and east. Only by August 2026, once the Midlands and north-east joined too, did the two years’ geography converge into something close to a nationwide event. This inversion suggests winter 2025–26 rainfall was not sufficient to fully recharge every region’s reservoirs and groundwater before summer 2026’s dry spell began.
2025 drought: five EA areas formally in drought
The Environment Agency’s report for that week recorded five areas — Cumbria and Lancashire, Greater Manchester/Merseyside/Cheshire, Yorkshire, the East Midlands and the West Midlands — in drought, with six more in prolonged dry weather. National reservoir storage stood at 65.6%, down 2.1 percentage points on the week, with the Pennines reservoir group at just 37.8% and Yorkshire’s at 41.9%. Rivers were declining at 93% of monitored sites, with 77% below normal or lower, including the Wye, Severn and Ely Ouse at exceptionally low levels. Just over 1,000 “hands-off-flow” abstraction restrictions were active by 13 August.
Rivers fall to 1976 levels in places
By early July 2025, some rivers were flowing at levels as low as those recorded during the 1976 drought — still the benchmark against which English droughts are measured a half-century later. Northern and eastern England, along with Scotland, were particularly badly affected, a different geographic pattern from 2022’s south-and-east-centred drought.
Sixth-driest spring, second-hottest June on record
Spring 2025 ranked as the sixth-driest in England’s rainfall series dating back to 1836, and June 2025 was the second-hottest in the temperature series dating back to 1884. The 2025 UK wildfire season was already the worst on record (in a series dating to 2012) by April, driven by relentlessly dry, sunny conditions since March — England’s sunniest March since 1910.
Rainfall: How Dry Has It Really Been?
England rainfall timeline, 2025–2026, as a percentage of the long-term average (LTA).
| Period | Rainfall vs long-term average | Notes | Source |
|---|---|---|---|
| Spring 2025 | 6th driest on record (series from 1836) | Set up a dry base heading into summer 2025 | Cross-referenced climate records |
| June 2025 | 2nd hottest on record (series from 1884) | Heat, not just dryness, accelerated evaporation | Cross-referenced climate records |
| Early Aug 2025 (12 days) | 29% (north-west) to 4% (south-east) of LTA | Regional split foreshadowed 2026’s different geography | Environment Agency, 8–14 Aug 2025 report |
| July 2026 (England) | 10% of LTA | Driest England July on record since 1836 | Environment Agency, 31 Jul–6 Aug 2026 report |
| July 2026 (southern/eastern England) | ~1% of LTA in parts | Some stations recorded 49–50 consecutive dry days | Environment Agency; cross-referenced reporting |
| Week of 31 Jul–6 Aug 2026 | Under 10mm nationally, under 1mm in east/south-east | 7th consecutive week under 10mm | Environment Agency, 31 Jul–6 Aug 2026 report |
| Early Aug 2026 | Under 10% of LTA in every part of England | No region exempt, unlike earlier in the summer | Environment Agency, 31 Jul–6 Aug 2026 report |
Two figures are easy to conflate and shouldn’t be: England’s 2022 drought is usually described as following the “driest July since 1935,” a comparison to a specific earlier year. The Environment Agency’s own description of July 2026 is different in kind — “driest on record” against the full England series stretching back to 1836. Where regional figures differ from the England-wide number (for instance, south-east England recording closer to 1% of average against a national 10%), this page states both rather than picking one, because they answer different questions: how dry was the whole country, and how dry was any one place.
Was July 2026 Really England’s Driest July?
Checking the claim rather than repeating it.
The claim is specific and, on the sourcing available for this article, appears to be accurate as stated by the Environment Agency: July 2026 was England’s driest July “on record,” in a rainfall series the Agency itself dates to 1836, with the month bringing just 10% of the long-term average. That is a stronger claim than 2022’s “driest July since 1935,” because it is not bounded to a comparison year — it is a claim about the entire available record.
Three caveats are worth stating plainly, in the spirit of not overstating a record claim. First, “on record” always means “since reliable measurement began” — 1836 for England’s rainfall series — not literally ever. Second, national and regional figures diverge: the Environment Agency’s 29 July 2026 release cited July rainfall at 7% of average nationally with southern England nearer 1%, while the later 31 July–6 August report cited 10% for the full month — a normal feature of provisional-to-final data revision as more of the month’s readings are processed, not a contradiction. Third, this article could not independently verify a separate Met Office ranking statement (distinct from the Environment Agency’s own figure) in this research pass; readers wanting the Met Office’s own official ranking should consult metoffice.gov.uk directly, since the Met Office and the Environment Agency sometimes use slightly different reference periods and station networks.
England Reservoir Levels Explained
Why one number can hide a very different regional picture.
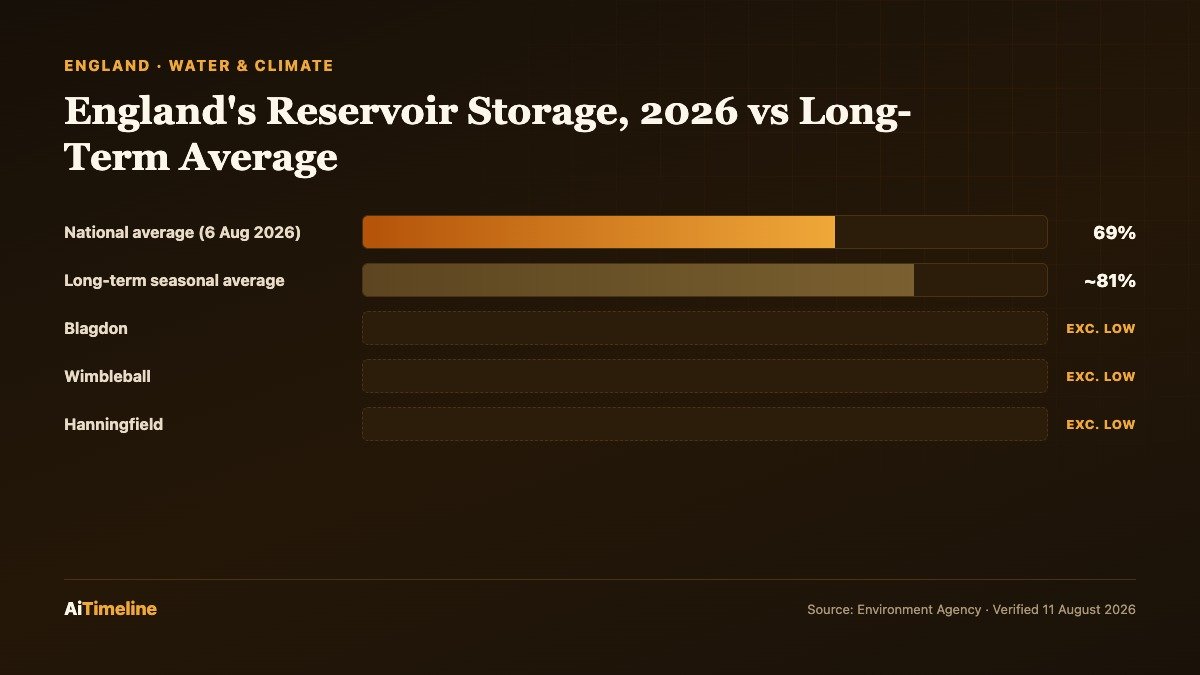
“Reservoir storage” is usually reported as a single national percentage — 56.1% as of mid-September 2026, down from 69% in early August — but that figure is an average across dozens of individual reservoirs owned by different water companies, each with its own catchment, rainfall pattern and demand. A national average of 56.1% is consistent with some reservoirs sitting near normal while others are “exceptionally low,” which is exactly what the Environment Agency’s own classifications showed across 2025 and 2026; by mid-September, 13 reservoirs or reservoir groups nationally were below 50% of capacity.
Reservoirs refill only when rainfall in their specific catchment exceeds what is being drawn out for supply, evaporation and environmental releases combined — which is why a rainy week in one region does not move the national percentage much if that region’s reservoirs were already close to full, or if the rain fell somewhere else entirely. Recovery is also seasonal: reservoirs and rivers in Great Britain typically do most of their recharging over autumn and winter, when evaporation and plant water use are low, not during summer storms, which are often heavy but brief and largely run off rather than soak in.
| Reservoir / group | Water company | Status | When reported | Source |
|---|---|---|---|---|
| England, national average | All companies | 56.1% of capacity, 19.7 points below LTA | 11–17 Sep 2026 | Environment Agency |
| England, national average | All companies | 69% of capacity, 11.6 points below LTA | 31 Jul–6 Aug 2026 | Environment Agency |
| Ardingly | South East Water | Exceptionally low | Sep 2026 | Environment Agency |
| Clatworthy | Wessex Water | Exceptionally low | Sep 2026 | Environment Agency |
| Clywedog | Hafren Dyfrdwy | Exceptionally low | Aug–Sep 2026 | Environment Agency |
| Dove Group | Severn Trent Water | Exceptionally low | Aug–Sep 2026 | Environment Agency |
| Hanningfield | Essex and Suffolk Water | Exceptionally low | Aug–Sep 2026 | Environment Agency |
| Wimbleball | South West Water | Exceptionally low | Aug–Sep 2026 | Environment Agency |
| Blagdon | Bristol Water | Exceptionally low (Aug); off list by mid-Sep report | Aug 2026 | Environment Agency |
| England, national average | All companies | 65.6% of capacity, down 2.1 points on the week | 8–14 Aug 2025 | Environment Agency |
| Pennines group | United Utilities | 37.8% — critically low | Aug 2025 | Environment Agency |
| Yorkshire group | Yorkshire Water | 41.9% — critically low | Aug 2025 | Environment Agency |
Rivers: Low Flows and Ecological Stress
By mid-September 2026, the Environment Agency classified 45% of monitored river sites as normal for the time of year, 31% as below normal, 16% as notably low and 5% as above normal — an improvement in the share of sites at normal levels compared with early August, when 18 sites (33%) were below normal, 17 (31%) notably low and 12 (22%) exceptionally low. A river can still visibly contain water while being under serious ecological stress: what matters for fish, invertebrates and plants is not whether a channel looks full, but whether flow, depth, temperature and oxygen levels stay within the ranges those species need, and low flows push all of them in the wrong direction at once — shallower water heats up faster, holds less dissolved oxygen, and concentrates pollutants that would normally be diluted.
Rivers are also shared infrastructure in a very literal sense: they supply drinking water abstraction points, irrigate farmland, dilute treated wastewater discharges, and sustain fish and other wildlife simultaneously. During drought, the Environment Agency can impose “hands-off-flow” restrictions — legal limits that stop water companies or farmers abstracting once a river falls below a set level, precisely to protect the ecological minimum. More than 1,000 such restrictions were active in England by mid-August 2025, and 1,534 abstraction-licence restrictions (including specific Section 57 restrictions on 302 abstractors in East Anglia) were in force by early August 2026.
Groundwater and Chalk Streams
Groundwater behaves on a completely different clock from rivers. Rain that soaks into permeable rock — chiefly chalk and limestone in England — can take weeks to months to reach the water table, and aquifers then release that water slowly back into rivers over the following months or years. That lag is why a dry winter matters disproportionately: winter is when most groundwater recharge happens (summer rain mostly evaporates or is taken up by growing plants before it can soak deep enough), so a run of dry winters, like 2025–26 in several English regions, can leave groundwater depleted even if an individual summer isn’t exceptional.
England is home to a genuinely global rarity: of roughly 210 chalk streams identified worldwide, around 160 are in England — the great majority of the entire global total, concentrated in Wessex, East Anglia and the Yorkshire Wolds. Chalk streams are fed largely by groundwater rather than surface run-off, which normally gives them unusually stable flow, clear water and a constant temperature near 10°C year-round — conditions prized by wild brown trout, grayling and a rich invertebrate community, and historically by watercress growers. That same groundwater dependence makes them acutely sensitive to over-abstraction: when water companies or agriculture draw heavily on the same aquifers that feed a chalk stream, especially after a run of dry winters, the stream’s flow can fall sharply or stop entirely in its upper reaches, even without the stream being singled out for abstraction directly.
Soil Moisture Deficit
Soil moisture is the water held in the ground within reach of plant roots, and it is usually the fastest-moving indicator in a drought — it can swing from normal to severely depleted within weeks under hot, dry conditions, well before rivers or groundwater show the same stress. A large soil moisture deficit means less water is available to crops and natural vegetation, more heat is reflected back near the surface rather than used evaporating soil moisture (intensifying heatwaves locally), and drier vegetation is more flammable, which is part of why 2025 and 2026 both saw significant wildfire activity layered onto their respective droughts. The Environment Agency’s July 2026 assessments describe soil moisture deficits across affected regions as comparable in severity to those seen in the 2022 and 1976 droughts, though a precise nationwide numeric comparison across those three years was not available in the sources reviewed for this article.
Where Are Water Restrictions in Place?
Temporary Use Bans (hosepipe bans) active in England, summer 2026. Start dates vary slightly by source — see the note below the table.
| Water company | Area | Reported start | Who’s affected |
|---|---|---|---|
| South East Water | Kent, then Sussex, Surrey, Hampshire, Berkshire | 3 Jul 2026 (Kent); 25 Jul 2026 (expanded) | ~850,000 initially in Kent |
| Cambridge Water | Cambridgeshire and parts of Bedfordshire | 9 Jul 2026 (enforceable 17 Jul) | ~350,000 households |
| Anglian Water | East of England, Grimsby to Southend-on-Sea (except Hartlepool) | 10 Jul 2026 (enforceable 11 Jul) | 5 million+ customers |
| Southern Water | Hampshire and Isle of Wight | 10 Jul 2026 | ~1 million customers |
| Thames Water | Greater London, Thames Valley, home counties | 23 Jul 2026 | ~10 million+ customers — largest single ban of 2026 |
| Affinity Water | Central region: Beds, Berks, Bucks, Herts, Surrey, parts Essex/London | Reported as 17 or 23 Jul 2026 (sources disagree) | ~3.9 million people |
| South West Water | Devon, Cornwall, Scilly, parts Dorset/Somerset | 8 Aug 2026 | ~1.8 million people |
| Essex & Suffolk Water | Full supply area (households only) | 3 Aug 2026 | Business customers exempt |
| Wessex Water | Dorset, Somerset, Bristol, most of Wiltshire, parts Gloucestershire/Hampshire | 18 Aug 2026 | First TUB in the region since 1976 |
| Bristol Water | Full supply area | 27 Aug 2026 | First TUB in the region since 1975 |
| Yorkshire Water | No 2026 ban as of mid-September | — | 5.5 million customers, unaffected so far |
⚠️ Conflicting Data: Why TUB Start Dates Vary
Individual water companies are the authoritative source for their own Temporary Use Ban start and end dates, and this article’s table is drawn from aggregated secondary reporting rather than eleven separate primary company statements. Where two reasonably reliable sources disagreed on an exact date (Affinity Water’s ban was reported as both 17 and 23 July 2026), this page states both rather than picking one arbitrarily. Always check the relevant water company’s own website for the current, legally operative restriction before making a decision that depends on the exact date.
What Does a Hosepipe Ban Actually Mean?
✅ Still Allowed
- Drinking water, showers, baths and toilets
- Washing machines and dishwashers
- Watering a garden using a watering can or bucket
- Filling a paddling pool or birdbath by hand/watering can
- Business and commercial uses not specifically restricted (varies by company)
❌ Restricted
- Using a hosepipe or sprinkler to water a garden
- Washing a car, boat or caravan with a hosepipe
- Filling a domestic swimming pool or hot tub with a hosepipe
- Filling or maintaining a pond with a hosepipe
- Using a hosepipe to clean patios, decking or windows
A Temporary Use Ban is imposed by an individual water company under the Flood and Water Management Act 2010, not by national government, which is why the exact rules, exemptions and start dates differ company by company rather than following one nationwide standard. Companies typically exempt customers who rely on a hosepipe for medical reasons, and commercial operations like market gardens, licensed campsites and standpipe-fed businesses often have separate arrangements. Breaching a ban is a criminal offence carrying a fine of up to £1,000 on summary conviction, though in practice water companies rely mainly on public reporting and warnings rather than large-scale enforcement action. Companies impose bans because a Temporary Use Ban is the fastest lever available to reduce demand without touching drinking-water supply itself — garden watering and car washing are among the most easily deferred uses of water, unlike drinking, cooking, sanitation or hospital and industrial use.
Water Companies: Who’s Affected, and How
Not every company faces the same pressure — drought geography varies sharply.
Thames Water
Imposed 2026’s largest single ban (London, Thames Valley, home counties, ~10 million+ customers, from 23 July). Also leads the proposed White Horse Reservoir near Abingdon and operates the Beckton desalination plant, discussed below.
Southern Water
Ban across Hampshire and the Isle of Wight from 10 July 2026; jointly developing the Havant Thicket reservoir with Portsmouth Water, due 2031, to cut abstraction from the Rivers Test and Itchen.
South East Water
First company to impose a 2026 ban, starting in Kent on 3 July before expanding to Sussex, Surrey, Hampshire and Berkshire on 25 July.
Anglian Water
Ban across most of its East of England territory from 10–11 July 2026, affecting 5 million-plus customers in one of England’s driest, most agriculturally intensive regions.
Affinity Water
Ban across its Central supply region (Bedfordshire, Berkshire, Buckinghamshire, Hertfordshire, Surrey, parts of Essex and London), affecting an estimated 3.9 million people.
South West Water
Ban across Devon, Cornwall, the Isles of Scilly and parts of Dorset and Somerset from 8 August 2026, one of the later 2026 restrictions to take effect.
Severn Trent Water
Its Dove Group reservoirs were classed “exceptionally low” by August 2026; the company is also co-developing the Mendip/Minworth-area supply schemes referenced in national water-resource planning, though no 2026 Temporary Use Ban was identified in this research pass.
Yorkshire Water
Reservoirs fell to critically low levels (41.9%) during the 2025 drought, but had not imposed a 2026 ban as of early August — illustrating how drought geography shifted from the north in 2025 to the south and east in 2026.
Why Water Leaks Matter During a Drought
England’s water network loses a meaningful share of treated water before it ever reaches a customer’s tap, through ageing pipes, joints and fittings across a network built up over more than a century. Historic industry-wide estimates have put this “non-revenue water” figure at roughly one-fifth of total supply, though that specific figure dates to reporting from around 2010–11 and current company-by-company leakage rates — which do vary significantly by region and have generally improved since then under regulatory pressure — are best checked directly via Ofwat and the independent Discover Water/Consumer Council for Water trackers rather than a single repeated headline statistic.
Leakage matters more, not less, during a drought, for a simple reason: every litre lost between a treatment works and a customer is a litre that was fully treated, pumped and accounted for in supply planning, then wasted before doing anyone any good — unlike, say, evaporation from a reservoir, which at least happens before the water is processed. Ofwat has pushed water companies toward binding leakage-reduction targets in successive price-review periods, and government and regulatory pressure to publish real-time, verifiable leakage figures has increased since the sector-wide 2026 drought made the issue politically visible again; this page does not repeat a single unverified national leakage percentage as if it were current, for that reason.
Agriculture: Farming Through a Third Drought in Five Years
Farmers are typically among the first to feel a drought and among the last to fully recover from one. Irrigation-dependent crops — potatoes, field vegetables, soft fruit and some cereals in their establishment phase — are directly exposed when abstraction licences are restricted under “hands-off-flow” conditions during low river flows, which can force farmers to stop irrigating at exactly the point crops need water most. Livestock farmers face a related but distinct problem: dried-out pasture reduces summer grazing, pushing many onto winter feed stocks earlier than planned, which raises costs and can affect animal condition heading into autumn.
2026’s reporting describes farmers warning of potential food shortages and lower crop yields as the drought widened through July and August, a marked contrast with 2022, when good growing conditions in parts of Kent, Herefordshire, Lancashire and Norfolk actually produced a bumper berry crop — 10–15% above the usual yield — even as the same summer’s drought damaged other crops elsewhere. That contrast is a useful corrective to any single “drought is bad for all farming” narrative: impact varies enormously by crop, region, soil type and whether a farm has its own irrigation reservoir, not just by how dry the summer was nationally.
Could England’s Drought Push Up Food Prices?
Documented current impact: reduced yields and irrigation restrictions have been reported for some 2026 crops, alongside farmer warnings about potential shortages, though this article did not locate a verified, England-specific, crop-by-crop yield dataset for 2026 in the sources reviewed, and any such figures should be sourced directly from DEFRA or the NFU before being treated as final.
Potential future risk, clearly labelled as such: the UK imports a substantial share of its fruit, vegetables and animal feed, meaning domestic drought is only one input into UK food prices alongside global commodity markets, exchange rates, energy costs and the harvests of other countries the UK imports from — a poor English potato or fruit harvest pushes prices up at the margin, but is unlikely on its own to be the dominant driver of overall UK food inflation in a given year. Livestock and dairy prices are typically more sensitive to a bad UK summer than most imported produce, because feed and grazing costs rise directly with domestic drought conditions.
Wildfires: Drought’s Visible Consequence
Low soil moisture and dry vegetation do not cause wildfires on their own — nearly all wildfires need an ignition source, whether a discarded cigarette, a barbecue, machinery sparks or arson — but they determine how fast and how far a fire spreads once started, and how hard it is to put out. 2025 was the UK’s worst wildfire year since comparable records began in 2012: 47,879 hectares burned across 181 separate fires larger than 30 hectares, beating the previous 2019 record by more than 19,000 hectares, with a single week in early April (2–8 April) accounting for over 18,000 hectares. 2026 has been somewhat less severe by area — around 23,359 hectares burned in 72 fires over 30 hectares as of 10 August — but has still produced serious, named incidents directly during the drought:
- Dunwich Heath, Suffolk (29 July 2026): declared a major incident, with around 90 firefighters deployed and nearby properties and a holiday park evacuated.
- Hornchurch, east London (30 July 2026): declared a major wildfire.
- Colchester, Essex (31 July 2026): fire affected military land.
- Tintwistle, Peak District (24 June 2026): burned over 600 hectares; escalated to a major incident declaration on 13 July.
- Marsden Moor, West Yorkshire (7 April 2026): around 300 hectares affected.
Record-breaking heat across May, June and July 2026 was the main contributing factor cited alongside the dry conditions. None of this article’s sources claim drought directly ignited any specific fire — that claim would need an investigation into each fire’s individual cause — only that dry vegetation and low soil moisture made the fires that did start spread further and burn hotter than they would in a normal summer.
Wildlife Under Pressure
Low flows hit river wildlife on multiple fronts simultaneously. Warmer, shallower water holds less dissolved oxygen, which stresses or kills fish directly — the Environment Agency recorded 15 confirmed fish-death incidents in England during 2026 to date, alongside 19 confirmed algal bloom incidents, which themselves can deplete oxygen further and release toxins as they die back. Chalk streams, discussed above, are especially exposed: because they depend on groundwater rather than surface run-off, a stream that has run low after a dry winter can stay low through an entire summer regardless of short-term rain, directly affecting wild brown trout and grayling populations and the invertebrate communities that depend on stable, cool, well-oxygenated water.
Wetlands and floodplain habitats lose seasonal flooding cycles that many wading birds and amphibians rely on for breeding; hedgerows and woodland edges dry out, reducing food availability for insects and the birds that eat them; and 2026’s 134 recorded environmental incidents (67 low-flow/abstraction related, 19 algal, 15 fish deaths) represent only the confirmed, reported cases — the true ecological toll of a drought this widespread is harder to fully quantify in real time.
Is Climate Change Making England’s Water Problem Worse?
The honest answer separates three different things that get blurred together in headlines: a single weather event, a longer climate trend, and a scientific attribution claim linking the two. The weather event is 2026’s specific dry summer, driven by a persistent weather pattern that suppressed rainfall over England for months. The climate trend, which is well established in Met Office and peer-reviewed climate science, is that UK summers are becoming, on average, hotter and drier in the south, while winters trend milder and wetter — a shift that increases evaporation in summer even where total annual rainfall doesn’t fall much, and concentrates more of the year’s rain into fewer, heavier winter events rather than steady year-round rainfall. Attribution — the specific scientific claim that climate change made this particular event more likely or more severe by some quantifiable amount — requires a dedicated attribution study for that specific event; this article did not locate a published, event-specific attribution study for the 2026 drought at the time of writing, so it does not claim one exists.
What can be said without overreaching: a warmer atmosphere increases evaporative demand everywhere, which mechanically worsens the effect of any given rainfall deficit compared to the same deficit occurring in a cooler climate. That is a physical relationship, not a statistical attribution claim about one summer. Combined with the multiple-cause picture set out earlier in this article — an underlying drying trend, a growing population, and a water network with limited spare capacity — climate change is best understood as a factor that raises the baseline risk and severity of English droughts over time, not as the sole or immediate cause of any single dry summer, including 2026’s.
Population Growth and Water Demand
England’s water problem is not purely a supply problem — demand has been rising too. Population growth, particularly concentrated in the already water-stressed South East and around London, adds directly to daily household demand; new housing development in some of England’s driest regions continues even as those same regions carry Environment Agency “seriously water stressed” designations; and average urban per-person water use, historically cited around 150 litres a day, means that population growth translates almost linearly into extra demand unless offset by efficiency gains, metering, or behaviour change. This is the core answer to a question that puzzles many people outside England: the country is not short of total rainfall by global standards, but a lot of people and a lot of demand are concentrated in exactly the parts of the country — the South East, East Anglia, London — that receive the least rainfall and have the fewest large natural water stores.
Can England Run Out of Water?
No, not in a literal, total sense. England is not going to run dry the way a desert nation with negligible rainfall could. The real risk is narrower and more specific: whether treated, safe drinking water can reliably reach every household and business, in the right place, at the right time, without ever-more-frequent emergency restrictions — and whether rivers, wetlands and chalk streams can keep enough flow to stay ecologically alive while that happens. That distinction matters because “England could run out of water” and “England’s water system has too little spare capacity for a growing population under a changing climate” are different claims, and only the second is well supported by the evidence in this article.
The factors that determine which future England gets are largely known, even if the exact numbers are debated: how much new storage and transfer infrastructure gets built and how fast, how much leakage is cut, how much demand is reduced through metering and efficiency, how population and housing growth are managed in water-stressed regions, and how quickly it can adapt as the climate trend described above continues. None of these are fixed; all of them are policy and investment choices, discussed section by section below.
Future Water Shortage: What Do the Projections Actually Say?
Labelled clearly: this section describes projections and scenarios, not confirmed current conditions.
Projection, not fact: one widely cited estimate, reported as of March 2019, put the point at which England’s water demand could exceed available supply at around 2045 without further intervention. The Environment Agency’s National Framework for water resources sets a broader national ambition of resilient water supplies by 2050, built on a combination of new reservoirs, water transfers between regions, leakage reduction, demand management and, in some areas, water recycling and desalination. This article was not able to independently re-verify the precise current supply-demand gap figure (often cited in the range of several billion litres a day nationally) against a primary government document in this research pass, and readers relying on that specific number for planning purposes should check the latest published National Framework update directly rather than any single cited figure, including this one.
What is not in serious dispute: without continued investment in the interventions above, a growing population and a changing climate would widen the gap between demand and reliable supply over time. The scenario is a call to sustained action, not a prophecy of a fixed future.
New Reservoirs: Why They Take Decades, Not Years
Havant Thicket Reservoir
Portsmouth Water and Southern Water’s joint project — the first new reservoir built in Britain in over 30 years. Capacity 8.7 billion litres, supplying 21 million litres a day, on 160 hectares. Approved June 2021; completion pushed from 2029 to 2031; cost around £340 million. Will let Southern Water cut abstraction from the ecologically sensitive Rivers Test and Itchen by roughly 166 million litres a year.
White Horse Reservoir (formerly SESRO)
Led by Thames Water with Southern Water and Affinity Water, near Abingdon. Would hold 150 billion litres — England’s second-largest reservoir after Kielder Water — serving around 15 million people in the South East. Development consent expected 2026, construction from 2029, opening not before 2040. Cost estimates have risen from £2.2 billion to around £5.7 billion. A judicial review brought by opponents was dismissed in July 2025; Thames Water began contractor selection in January 2026.
Both projects illustrate the same point directly: even a reservoir already under construction (Havant Thicket) will not be supplying water until 2031 at the earliest, and White Horse Reservoir — still awaiting development consent as of 2026 — will not open until around 2040. Neither can do anything to relieve the drought happening in 2026 itself. Reservoirs take this long because they require land acquisition, environmental impact assessment, public consultation, planning consent (often contested, as White Horse Reservoir’s dismissed judicial review shows), and multi-year construction of large earthworks and water-treatment infrastructure — not because of bureaucratic delay alone. Opposition groups, including the Group Against Reservoir Development (GARD) campaigning against White Horse Reservoir, argue that leakage reduction and water recycling could deliver comparable benefit faster and with less environmental disruption — a genuine, ongoing policy debate rather than a settled question.
Water Recycling: Treated Wastewater, Reused
Water recycling means treating wastewater to a high standard and returning it to the supply system, either indirectly (released into a river upstream of an abstraction point, then treated again as normal) or directly (piped straight back into the drinking-water network after advanced treatment). Indirect reuse already happens incidentally on many UK rivers, where one water company’s treated discharge sits upstream of another’s abstraction point; deliberate, engineered water recycling schemes remain more limited in England than in some water-stressed countries, and direct potable reuse in particular faces public acceptance hurdles as well as regulatory ones, since it requires demonstrating an extremely high, continuously verified standard of treatment before water is is fit to drink again. Opponents of new reservoir construction, including GARD, have specifically pointed to water recycling as an alternative or complementary investment that could be delivered faster than a decades-long reservoir project — a case this article reports as their argument, not as a settled technical conclusion.
Desalination: What It Can and Can’t Do
Thames Water’s desalination plant at Beckton in east London is the clearest real-world case study of desalination’s limits in an English context, not a simple national solution. Completed in June 2010 at a cost of around £250 million (total cost had reached £518 million by 2025) and designed to produce up to 150 million litres a day (later revised down to 100 megalitres), the plant uses reverse osmosis and consumes an estimated 14 megawatts of power when running. By September 2025, it had been operated only five times since opening — producing, in total, roughly seven days’ worth of London’s typical water supply across 15 years. Cost per litre reached approximately 7 pence by 2025, around 28 times the price of standard treated water. Former London Mayor Ken Livingstone opposed the plant when it was proposed in 2007, calling it “a misguided and a retrograde step in UK environmental policy” and arguing Thames Water should prioritise cutting leakage instead; MPs have since called it a “white elephant,” and industry sources described it as “effectively mothballed” by 2022.
The lesson generalises: desalination is energy-intensive, expensive per litre compared with conventional treated water, and in England’s case has been used almost exclusively as an emergency-only, drought-contingency asset rather than a routine supply source — useful to have as an option of last resort, not a scalable substitute for reservoirs, leakage reduction or demand management.
Water Transfers Between Regions
England’s water companies are regional monopolies with largely separate networks, so moving water from a wetter region to a drier one is neither automatic nor simple — it requires new pipelines, pumping infrastructure, or the use of existing canal and river systems adapted for bulk transfer, each raising its own cost and environmental questions (moving water between river catchments risks introducing invasive species or altering the chemistry of the receiving river). The Environment Agency’s National Framework for water resources explicitly includes regional transfers as one tool among several for closing future supply gaps, alongside new reservoirs, recycling, leakage reduction and demand management, rather than any single one of these being sufficient alone. Practical transfer schemes tend to be smaller and more localised than the SESRO/White Horse Reservoir-scale proposals — using existing canal networks or short new pipeline links between adjoining water company areas — because large new dedicated transfer pipelines carry similar decades-long planning and construction timelines to new reservoirs.
1976: The Drought England Still Measures Itself Against
The summer of 1976 remains the reference point for every English drought since. Rainfall from October 1975 to August 1976 fell to under half the average; Kew recorded just 235mm, 43% of its long-term average, and parts of Devon and Dorset went 45 consecutive days without rain across July and August. Heathrow logged 16 consecutive days above 30°C between 23 June and 8 July, and Cheltenham recorded 35.9°C on 3 July — a high reading, though still short of the UK’s all-time record of 36.7°C set in 1911. What made 1976 exceptional was its persistence rather than any single day’s peak: the Met Office still rates it the UK’s hottest summer on record by average maximum temperature, and its sunniest. Crop failures caused an estimated £500 million in damage, with a further £50 million in insurance claims from subsidence and fire; some effects lasted decades, with around 15% of England’s mature beech trees dying and survivors showing reduced growth rates for years afterward.
Parliament passed the Drought Act 1976 to allow emergency water rationing, and public standpipes appeared in some affected areas as supplies were rationed. In one of the more ironic footnotes in English drought history, Denis Howell was appointed “Minister for Drought” in the last week of August 1976 — just before severe thunderstorms finally broke the dry spell. September and October 1976 turned exceptionally wet, formally ending the drought within weeks of his appointment.
Every Drought Since: 1989 to 2025
1989–1992: A prolonged dry spell, concentrated in the South East, drove reservoir levels down and prompted early public conservation campaigns and initial discussion of inter-regional water transfers — ancestor debates to today’s White Horse Reservoir and transfer proposals. Documentation available for this specific period is thinner than for later droughts; readers wanting primary-source detail should consult the Environment Agency’s historical drought archive directly.
1995–1998: A different pattern from 1976’s single hot summer — three consecutive years where warm, dry summers were followed by dry, cool winters, so winter rainfall never fully offset summer depletion. Water tables and reservoir levels fell steadily across the period and were only fully replenished after exceptionally wet years from 1999 to 2002, illustrating how a multi-year hydrological drought can be more damaging in aggregate than any single very dry summer.
2003: Most remembered for a European-wide heatwave, England’s own February–October rainfall was the lowest since 1921, the third-lowest since national records began in 1900. The UK recorded 38.5°C at Faversham, Kent — the first confirmed 100°F (38°C) reading in UK history at the time. Crucially, 2003’s overall drought impact was comparatively moderate, because the preceding winter (2002–03) had been relatively wet, leaving reservoirs in better shape heading into the dry summer than in 1976. The drought ended in October 2003 when low pressure finally brought sustained rain.
2004–2006: Similar dry conditions persisted through the mid-2000s, with London and the South East particularly affected by two further dry winters, until exceptionally wet years in 2007 and 2008 fully replenished supplies.
2010–2012: England recorded its driest 18-month period in a century, with around 20 million people affected by hosepipe-type restrictions at the drought’s peak. The ending was as abrupt as the drought itself: the wettest April-to-September period ever recorded arrived in summer 2012, ending water restrictions within months — a frequently cited example of how quickly conditions can flip from severe drought to serious flood risk in England’s variable climate.
2018: An intense summer heatwave and dry spell, with the Met Office rating summer 2018 jointly the hottest on record alongside 1976, 2003 and 2006 (a ranking later exceeded by 2025). Faversham again featured, recording 35.3°C on 26 July. The Saddleworth Moor fire (25 June) and neighbouring Winter Hill fire (28 June) burned over 36 square kilometres combined across nearly a month — England’s largest wildfire in living memory at that point — and spring barley yields fell 10% against the 2012–17 average. Unlike 2022, 2025 and 2026, 2018 is more often remembered as an extreme heatwave than as a widely declared national drought, though the practical impacts on farming and wildfire risk were severe.
2022: The Modern Benchmark, Until 2026
On 19 July 2022, Coningsby in Lincolnshire recorded 40.3°C — the first time the UK had ever exceeded 40°C, and still the UK’s official all-time temperature record. It surpassed the previous record of 38.7°C set at Cambridge in 2019, which had itself surpassed 2003’s 38.5°C at Faversham — a reminder that “the hottest UK temperature on record” has changed hands three times in under twenty years. England’s July 2022 rainfall came in at 35% of average nationally, the driest July since 1935, while parts of south-east and central-southern England recorded their driest July since area records began in 1836 — the same 1836 series 2026 would go on to break outright.
Reservoir and river stress mounted through the summer: by 13 July, falling levels at Thruscross Reservoir exposed the ruins of West End, a village flooded when the reservoir was built in 1966. Thirteen Environment Agency-monitored rivers hit their lowest levels ever recorded, and soil moisture deficits were described as comparable to 1976’s. The Environment Agency formally declared drought across eight areas on 12 August 2022 — Devon and Cornwall, Solent and South Downs, Kent and South London, Herts and North London, East Anglia, Thames, Lincolnshire and Northamptonshire, and the East Midlands — adding Yorkshire on 16 August after Yorkshire Water director Neil Dewis said: “The hot, dry weather means that Yorkshire’s rivers are running low and our reservoirs are around 20% lower than we would expect for this time of year.” Hosepipe bans followed in sequence: Southern Water (5 August), South East Water (12 August), Welsh Water (19 August), Thames Water (24 August, 15 million customers), and Yorkshire Water (26 August). Nationally, London Fire Brigade alone attended 340 grassland and wildland fires in the first week of August 2022, against 42 in the same week of 2021 — a 700% increase — contributing to roughly 25,000 wildfires recorded across the UK that year. Not every effect was negative: favourable growing conditions produced a bumper berry harvest, 10–15% above usual, in Kent, Herefordshire, Lancashire and Norfolk. Water Minister Steve Double said at the time that “all water companies have reassured us that essential supplies are still safe.”
2025: The Drought That Set Up 2026
2025’s drought is easy to overlook now, overshadowed by 2026, but it is the direct hydrological prelude to this year’s crisis. It hit a different part of the country — Cumbria and Lancashire, Greater Manchester, Merseyside and Cheshire, Yorkshire, the East Midlands and the West Midlands were the areas formally in drought by mid-August 2025, rather than the south-and-east geography that dominated 2026’s opening months. Spring 2025 was England’s sixth-driest on record (series from 1836) and June 2025 its second-hottest (series from 1884); by early July, some rivers had fallen to levels last seen in 1976. The 2025 UK wildfire season was already the worst on record for the 2012-present monitoring period by April, ultimately burning 47,879 hectares in 181 fires over 30 hectares — both records, driven partly by England’s sunniest March since 1910.
The link to 2026 is straightforward but important: reservoirs and groundwater in the hardest-hit 2025 regions did not necessarily return to normal over the following winter before 2026’s own dry spell began, meaning 2026 did not start from a full, freshly recharged system the way a “normal” year would. This is precisely why water companies, the Environment Agency and government ministers have all separately described 2026 as the third drought in five years, rather than treating each year in isolation.
1976 vs 2026
1976 vs 2026
Whether 2026 is objectively “worse” than 1976 depends entirely on which measure is used. By England-wide July rainfall against the full instrumental record, 2026 now holds the driest-July title outright. 1976’s own extreme dryness is measured on different terms — the Met Office rates it the UK’s hottest summer on record by average maximum temperature and its driest by the length of the October 1975–August 1976 dry spell, not a single driest-month figure — so the two years are each “worst” by different yardsticks rather than directly comparable on one number. What is genuinely new in 2026 is not any single statistic beating 1976, but the pattern: three official droughts in five years, a frequency with no clear precedent in the roughly 190-year rainfall record referenced throughout this article.
2022 vs 2026
2022 vs 2026
2026’s rainfall deficit is the more extreme of the two by the England-wide July figure, but 2022 still holds the UK’s all-time temperature record at 40.3°C, well above any single 2026 reading identified in this research. The more consequential difference may be structural rather than meteorological: 2022 arrived after several comparatively unremarkable years, giving the water system a fuller starting reserve, while 2026 arrived directly on the heels of 2025’s drought — a stress test 2022 didn’t have to face.
England’s Major Droughts, Compared
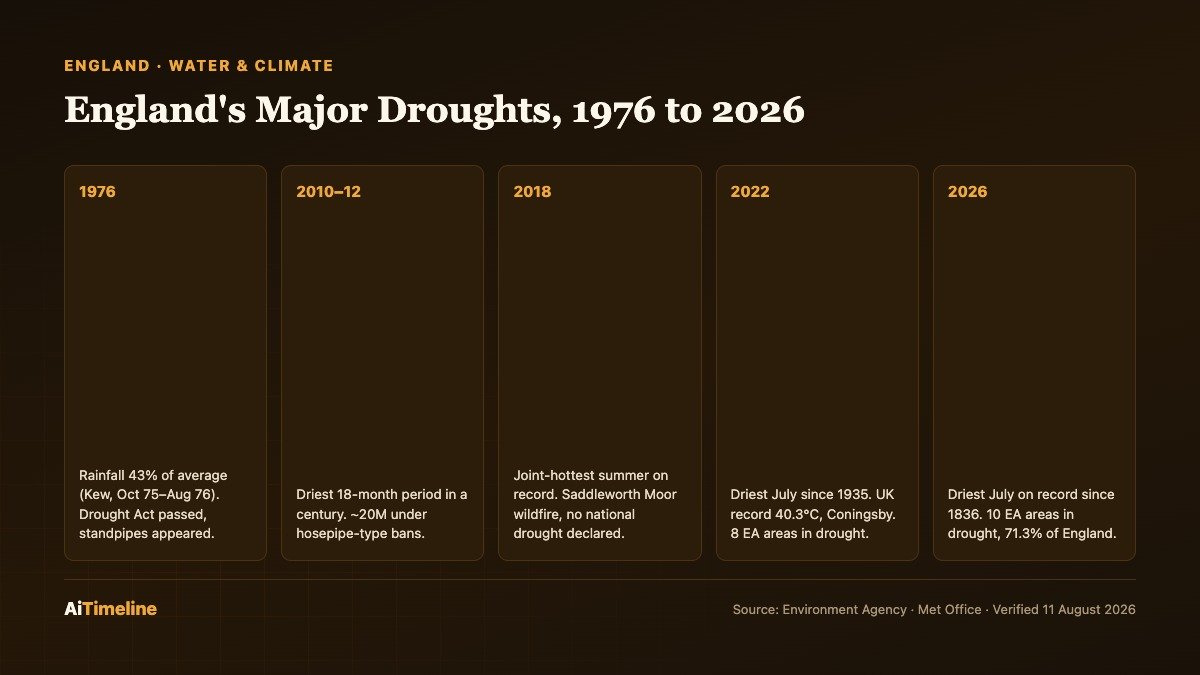
Figures are drawn from different measurement systems across nearly 50 years — treat cross-row comparisons as broadly indicative, not exact like-for-like.
| Drought | Key rainfall/temp fact | Restrictions | Ended by |
|---|---|---|---|
| 1976 | 43% of average rainfall (Kew, Oct 75–Aug 76); 35.9°C Cheltenham | Standpipes, Drought Act 1976, Minister for Drought | Severe thunderstorms + wet Sep–Oct 1976 |
| 1989–1992 | Prolonged South East dry spell (documentation limited) | Reservoir conservation campaigns | Gradual recovery, early-mid 1990s |
| 1995–1998 | 3 consecutive dry summers + dry winters | Regional restrictions, South East | Exceptionally wet years 1999–2002 |
| 2003 | Lowest Feb–Oct rainfall since 1921; 38.5°C Faversham | Regional restrictions; moderate impact | Low pressure system, Oct 2003 |
| 2004–2006 | Two further dry winters, South East/London focus | Restrictions, reservoir/transfer debate | Record 2007–08 rainfall |
| 2010–2012 | Driest 18-month period in a century | Bans affecting ~20 million people | Wettest Apr–Sep ever recorded, 2012 |
| 2018 | Joint-hottest summer on record (with 1976/2003/2006); 35.3°C Faversham | Localised restrictions; no widespread national drought declaration identified | Autumn 2018 rainfall |
| 2022 | Driest July since 1935 (England); UK record 40.3°C Coningsby | 8 areas declared in drought; bans, ~15M+ Thames Water customers | Autumn/winter 2022 rainfall |
| 2025 | 6th-driest spring, 2nd-hottest June on record; north/Midlands focus | 5 areas in drought; reservoirs to 65.6% | Partial winter 2025–26 recovery |
| 2026 | Driest England July on record since 1836; national June record 38°C | 10 areas in drought, 4 prolonged dry weather; 8 companies’ bans, 25M+ customers | Ongoing as of 11 Aug 2026 |
Regional England Analysis
Drought status by Environment Agency area, as of the 31 July–6 August 2026 report.
East Anglia
One of the first areas declared in drought (29 July 2026). Intensive arable and horticultural agriculture makes this one of England’s most abstraction-sensitive regions; 302 East Anglian abstractors were subject to Section 57 restrictions by early August.
Hertfordshire & London
Covers Thames Water’s largest customer base. London’s dependence on the Thames and a small number of major reservoirs makes this one of the most closely watched areas nationally; discussed further in the London section below.
Thames Valley
Directly upstream of London; also the site of the proposed White Horse Reservoir near Abingdon, intended to serve this wider region from around 2040.
Hampshire & Isle of Wight
Home to the ecologically important chalk Rivers Test and Itchen; the Havant Thicket reservoir project (due 2031) is specifically designed to reduce abstraction pressure here.
Devon & Cornwall
South West Water’s core territory; one of the later 2026 areas to receive a Temporary Use Ban (8 August), despite drought status since late July.
West Midlands
Severn Trent Water territory; the Dove Group reservoirs here were classed exceptionally low by August 2026.
Wessex
Covers Dorset, Somerset and south Gloucestershire; Wessex Water’s territory, bordering the South West Water and Bristol Water (Blagdon reservoir, exceptionally low) areas.
Kent, Cumbria, Manchester/Merseyside, East/West Midlands fringe, Lincolnshire & the South Downs
These areas sat one notch below formal drought status as of the early August 2026 report but were flagged as at risk of moving into drought if dry conditions continued — several did over the following weeks as the 71.3% national figure was reached.
London Water Security
Does London have enough water? For now, yes — but with less margin than many residents assume. London’s supply depends heavily on the River Thames and a relatively small number of major reservoirs west of the city, supplemented by groundwater from the London Basin’s chalk aquifer. The Hertfordshire and London area was among the first seven declared in drought on 29 July 2026, and Thames Water’s Temporary Use Ban, covering more than 10 million customers from 23 July 2026, was the largest single restriction imposed anywhere in England this year.
Why is London vulnerable? It combines the country’s highest population density with a location in one of England’s driest regions, and it depends on infrastructure — the Thames, a limited reservoir chain, and the London Basin aquifer — that was largely built for a smaller 20th-century population. Continued population growth and housing development add demand faster than new supply infrastructure can realistically be built, which is exactly why the White Horse Reservoir near Abingdon (serving the wider Thames Valley and South East, not London alone) and the Beckton desalination plant both exist as London-region contingency projects, despite their very different track records of usefulness described above.
South East England: Britain’s Most Water-Stressed Region
The South East combines the country’s highest population density outside London, some of its lowest average rainfall, its largest concentration of chalk streams, and significant agricultural water demand — a combination the Environment Agency has long classified as “seriously water stressed” independent of any particular year’s weather. Kent, Sussex, Hampshire and Surrey all carried Temporary Use Bans by late July 2026, and the region hosts both of the two most significant new-reservoir projects discussed above (Havant Thicket and White Horse Reservoir), precisely because existing supply margins here are thinnest.
East of England: Farming Meets Low Rainfall
East Anglia is both one of England’s driest regions in a normal year and one of its most agriculturally intensive, growing a large share of the country’s field vegetables, sugar beet and cereals under irrigation. That combination makes it acutely exposed during drought: Anglian Water’s ban, covering more than 5 million customers from 10–11 July 2026, arrived alongside 302 separate Section 57 abstraction restrictions affecting East Anglian farmers by early August — among the highest concentrations of agricultural abstraction restriction reported anywhere in England this year.
Human Stories: What This Means for Real People
Documented statements only — no invented interviews or composite characters.
Farmers have been among the most directly affected, with 2026 media reporting describing warnings from the farming sector of potential food shortages tied to lower yields as the drought widened through July and August. Irrigation restrictions under “hands-off-flow” rules mean some growers have had to stop watering water-hungry crops precisely when they need it most, a recurring feature of every English drought discussed in this article, from 1976 through 2026.
Water company engineers and directors have spoken publicly through each of the last three droughts. In 2022, Yorkshire Water director Neil Dewis described reservoirs “around 20% lower than we would expect for this time of year.” In 2026, Environment Agency director Helen Wakeham said plainly: “The hot and dry weather means we are currently using water faster than nature can replenish it.” An Environment Agency statement reported by Bloomberg on 10 August 2026 added that the dry weather “is taking a real toll on farming and there will be long-lasting impacts on our environment.”
Firefighters faced a markedly busier summer in both 2022 and 2026: London Fire Brigade’s 700% year-on-year jump in grassland fire callouts during the first week of August 2022 is one of the clearest documented links between drought conditions and frontline emergency service demand, echoed by the ninety firefighters deployed to the major incident at Dunwich Heath, Suffolk, on 29 July 2026.
Households and gardeners across eight water company areas have faced hosepipe bans through summer 2026, with fines of up to £1,000 for breaches, alongside the more mundane daily reality of parks and lawns turning yellow-brown across much of the country and, per reporting on the 2026 restrictions, disruption to narrowboat holidays on canal routes affected by lock closures.
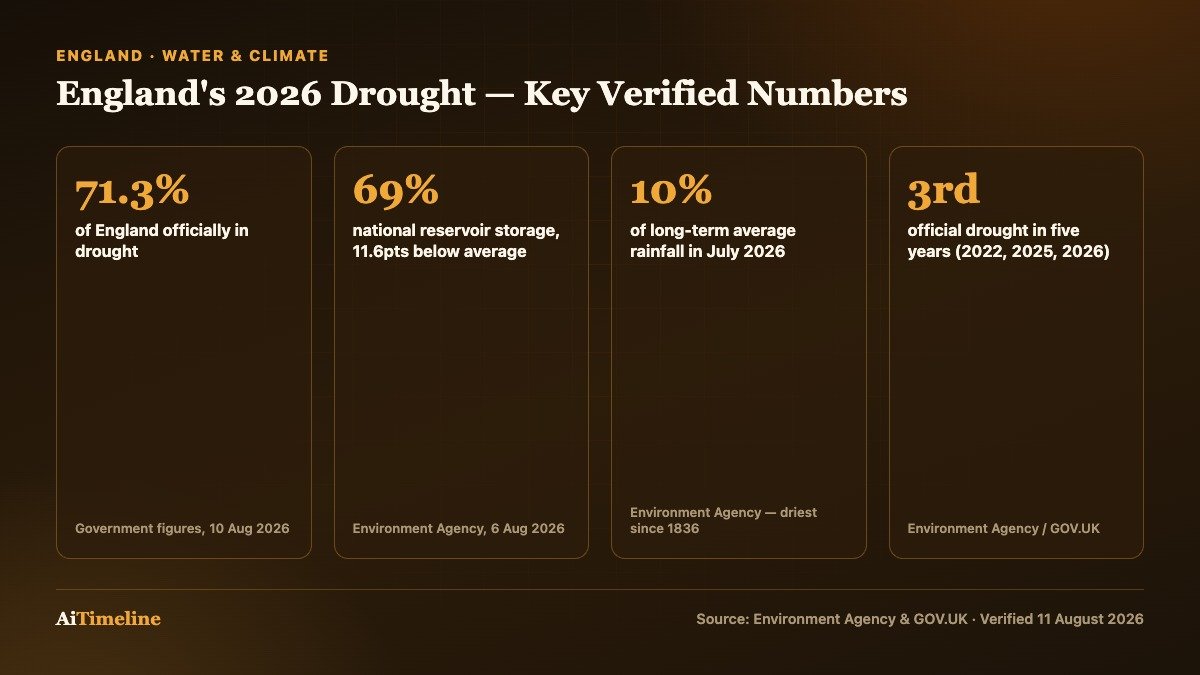
England’s 2026 drought in numbers, as verified against Environment Agency and GOV.UK reporting. Source: AiTimeline, from Environment Agency data.
Drought Science, Explained Simply
Drought
An extended period of below-average rainfall that reduces river flow, groundwater, reservoir storage and soil moisture below normal for the time of year. It is a weather-driven, temporary condition.
Water Scarcity
A structural mismatch between demand and reliably available supply in a given place, independent of any one dry spell — the reason parts of south-east England feel drought more acutely than wetter regions do.
Water Stress
The Environment Agency’s formal classification for areas where water demand is high relative to available resource even in a normal year; much of the South East carries this designation.
Soil Moisture Deficit
The shortfall between the water held in root-zone soil and what would be normal for the season — usually the fastest-moving indicator in a developing drought.
River Flow
The volume of water passing a monitoring point over time, classified by the Environment Agency from “normal” through “below normal,” “notably low” and “exceptionally low.”
Groundwater
Water stored underground in permeable rock (aquifers), recharged mainly by winter rainfall soaking through the soil, and released slowly back into rivers over months or years.
Aquifer
A body of permeable rock — chiefly chalk and limestone in England — capable of storing and transmitting groundwater, and supplying both rivers (via chalk streams) and direct abstraction.
Reservoir Storage
The volume of water held in a reservoir, usually expressed as a percentage of total capacity, compared against the long-term average for that date.
Rainfall Deficit
The shortfall between actual rainfall over a period and the long-term average for that period and location, usually expressed as a percentage.
Evaporation
The loss of water from soil, open water and plant surfaces to the atmosphere, which increases sharply with temperature and is a major driver of how a rainfall deficit translates into a drought.
Abstraction
The licensed removal of water from a river, reservoir or aquifer for drinking supply, agriculture or industry, regulated by the Environment Agency and restricted during low flows.
Water Resilience
A water system’s ability to keep supplying customers and the environment reliably through droughts and demand growth, built through storage, transfers, leakage reduction and demand management together.
Is 2026 a “Flash Drought”?
Scientifically, a flash drought is one that develops unusually fast — typically over a few weeks rather than the months or years a classic hydrological drought takes to build — usually driven by a combination of extreme heat, high evaporative demand and a sharp rainfall deficit arriving together. The concept was formalised and popularised largely through research on fast-onset US droughts, and its application to UK conditions is more recent and less standardised.
Media coverage of England’s 2026 drought has used the term “flash drought” to describe the speed at which conditions worsened through June and July. That description is defensible on the evidence: England went from prolonged dry weather to formal drought status across half the country in a matter of weeks. However, the primary Environment Agency reports reviewed for this article used the Agency’s own established classification system — normal, prolonged dry weather, drought, and (in the most severe cases) severe drought — rather than the term “flash drought” itself. This article therefore reports “flash drought” as a description used in media and some official commentary about the pace of 2026’s onset, not as a formal Environment Agency drought-status category, and readers should not assume it triggers different legal or regulatory consequences than the Agency’s standard classifications.
How England Monitors Drought
The Environment Agency publishes drought status via a standing National Drought Group, which brings together the Agency, DEFRA, water companies, the National Farmers’ Union and other stakeholders, and issues regular — typically weekly during an active drought — summary reports combining several independent data streams: rainfall against the long-term average, river flow at monitored gauging stations, groundwater levels in key aquifers, reservoir storage reported by each water company, and soil moisture data. No single measure decides drought status alone; the classification below reflects a judgement across all of them together, which is why, for example, reservoirs can sit close to normal in one region while rivers are exceptionally low in the same report.
The Drought Status System, Explained
| Status | What it means | Example from this article |
|---|---|---|
| Normal | Rainfall, river flow, groundwater and reservoir storage all within the expected range for the time of year | 2 of the Environment Agency’s areas remained normal as of the 6 Aug 2026 report |
| Prolonged dry weather | A sustained rainfall shortfall serious enough to warrant closer monitoring and early water-company/farmer engagement, but not yet meeting the threshold for a full drought declaration | 12 areas held this status as of 6 Aug 2026 |
| Drought | Rainfall, river, groundwater and storage indicators have fallen far enough, for long enough, to trigger formal drought management actions, including possible Temporary Use Bans and abstraction restrictions | 7 areas formally in drought as of 6 Aug 2026 |
| Severe drought | The most serious classification, associated with the most stringent restrictions, including possible Drought Orders affecting non-household customers and environmental abstraction | Not reached nationally as of this article’s last-verified date; some individual sources refer to “severe” conditions descriptively without confirming the formal classification was applied |
What Happens If the Dry Weather Continues?
Scenarios, clearly labelled as such — not predictions.
Short term (weeks): further water companies would likely extend or widen Temporary Use Bans, more abstraction licences would face hands-off-flow restrictions, and both wildfire risk and river ecological stress (fish deaths, algal blooms) would probably continue rising, consistent with the pattern already recorded through July and August 2026.
Medium term (into autumn): some water companies could seek Drought Orders — a stronger legal tool than a Temporary Use Ban, potentially restricting non-household customers — if reservoirs and rivers don’t stabilise; agricultural losses would likely become clearer as harvest data is finalised; and government and regulatory pressure on leakage and company drought planning would probably intensify, echoing the political response seen after 2022.
Long term (into 2027 and beyond): a fourth consecutive drought-affected year, following 2022, 2025 and 2026, would further test the “third drought in five years” framing already used by officials, and would likely accelerate the political case for faster delivery of reservoir, recycling and leakage investment discussed above — though, as this article has shown, none of those interventions can move faster than their existing multi-year timelines regardless of political pressure.
What Would Actually End the 2026 Drought?
Recovery depends on more than any single storm. Reservoirs need enough rainfall in their specific catchments, over enough time, to exceed what is being drawn out for supply and environmental releases combined. Groundwater needs a wet autumn and winter specifically — summer rain mostly evaporates or is taken up by plants before it can recharge an aquifer, so a wet August does comparatively little for groundwater compared to the same rainfall falling in December. River flows can respond faster than either, sometimes recovering within days of sustained rain, but a river returning to normal doesn’t mean the reservoirs or aquifers feeding it have too. The Environment Agency put a number on this for the first time on 16 September 2026: England needs 120% of typical rainfall over the seven months to April 2027 for every affected area to be considered out of drought — rainfall accumulated across that whole period, not every individual month running 20% wetter than average. Even so, under the Agency’s most likely scenario Devon and Cornwall and East Anglia would still be in drought at that point, and it puts roughly a 1-in-4 chance on around half of England remaining in drought by spring 2027. That regional unevenness is why this article does not treat 120% as a single uniform target — genuine recovery is better understood as “a sustained wet autumn and winter across the affected catchments,” with some catchments needing substantially more than others.
Drought Myths vs Science
❌ Myth
- “England is always rainy, so a real drought can’t happen here”
- “One big storm ends a drought”
- “Climate change means it will basically stop raining”
- “Reservoirs alone solve water shortages”
- “All of England has the same water problem”
- “A hosepipe ban means drinking water is about to run out”
- “Groundwater recovers as fast as rivers do”
✅ What the Evidence Shows
- England has recorded at least ten distinct, serious droughts since 1976, three of them in the last five years alone
- Recovery needs sustained autumn/winter rain across the right catchments, not a single storm — and even 2012’s record wet summer only ended that particular drought because it followed 18 already-dry months
- Climate science points to hotter, drier summers and wetter winters on average — a change in pattern, not an end to rainfall
- New reservoirs take 10–20 years; leakage cuts, demand management and recycling all have to work alongside them
- 2026’s drought geography differs sharply by region — Yorkshire had no 2026 ban while Thames Water’s covered 10 million-plus customers
- Hosepipe bans target discretionary outdoor use specifically; drinking water, sanitation and washing machines remain unaffected under a standard TUB
- Groundwater lags rivers by weeks to months and can stay depleted long after rivers look normal again
Explore More Timelines
People Also Ask
Frequently Asked Questions
Answer-first, grouped by topic. Figures match the tables above; current-event answers carry their “as of” date.
Explore More on AiTimeline
Official Sources & Methodology
Grouped by type. Every statistic on this page is traceable to at least one entry below.
| Source | Type | Used for |
|---|---|---|
| Environment Agency (GOV.UK weekly/summary drought reports) | Primary / official | 2026 and 2025 drought status, rainfall, reservoir, river, groundwater and restriction data |
| GOV.UK news releases (National Drought Group) | Primary / official government | Drought declaration dates, official quotes from Environment Agency and government figures |
| Met Office | Primary / official meteorological authority | Temperature records, seasonal climate statements, quotes on rainfall patterns |
| USGS-equivalent UK water-sector sources (Ofwat, Discover Water, Consumer Council for Water) | Primary / regulatory | Leakage context, general water-sector regulatory framing |
| Wikipedia (cross-referenced against Met Office, Environment Agency and news-wire citations) | Secondary aggregation, cross-checked | Historical drought infobox data (1976–2025), reservoir/desalination/wildfire background facts |
| Newswire and international press (Bloomberg, Euronews, and other named outlets cited in-line) | News wire / press corroboration | Live 2026 statistics, government and water-company statements, human-impact reporting |
| Water company public statements (Yorkshire Water and others, as quoted) | Primary / corporate | Company-specific reservoir and restriction commentary |
📋 How We Track England’s Drought
Live figures: every current-event statistic on this page is drawn from Environment Agency weekly/summary reports, GOV.UK news releases, Met Office statements, or named news organisations, with the reporting date stated alongside the figure. Where this article could not independently verify a specific number against a primary source (for example, an exact national leakage percentage, or a precise future supply-demand gap figure), it says so explicitly rather than presenting an unverified figure as confirmed.
Historical figures: pre-2022 drought data is cross-checked against Wikipedia’s own citations to Met Office, Environment Agency and news-wire sources, and this page states a range rather than a single number wherever credible sources disagree (for example, Affinity Water’s 2026 Temporary Use Ban start date).
Updating this page: where a figure changes after publication (for example, if England’s drought percentage rises, falls, or a new area is declared in drought), AiTimeline’s editorial process updates the figure and its “as of” date consistently across the page rather than leaving stale numbers in some sections and current ones in others.
Data Freshness & Correction Policy
✅ This Page Does
- Carry a visible “last updated”/”as of” date on every current-event statistic, since the 2026 drought is still developing
- Separate confirmed current conditions from projections and scenarios, labelling each clearly
- Flag every place primary sources disagreed, rather than silently picking one number
❌ This Page Does Not
- Present a single provisional 2026 figure as a permanently fixed final number
- State a precise future supply-demand gap or leakage percentage this research could not verify against a primary source
- Claim a specific attribution study proves climate change caused the 2026 drought, absent one being located
If a statistic on this page is later found to be incorrect or superseded by updated official figures — for instance, a revised Environment Agency weekly drought percentage, a water company extending or lifting a Temporary Use Ban, or a corrected rainfall ranking — AiTimeline’s correction policy is to update the figure, note the correction date in this section, and, where the change is material to a headline statistic, preserve the previous figure alongside the new one with a brief reason rather than silently overwriting it.
Sources & further reading
Every dated entry above was checked against these references. Last reviewed 20 September 2026.
- Environment Agency: Dry weather and drought in England, 31 July to 6 August 2026
- GOV.UK: Drought declared in half of England (29 July 2026)
- Environment Agency: Dry weather and drought in England, 8 to 14 August 2025
- GOV.UK: Environment Agency chairs National Drought Group as parts of country move into drought (2022)
- Wikipedia: Drought in the United Kingdom
- Wikipedia: Havant Thicket Reservoir
- Wikipedia: South East Strategic Reservoir Option (White Horse Reservoir)
- Wikipedia: Thames Gateway Water Treatment Works (Beckton desalination plant)