EU Carbon Market History: From the EU ETS to CBAM and ETS2
EU carbon market history: how the EU ETS, CBAM and ETS2 differ, the 2007 price collapse, and 2026 CBAM certificate prices in this fact-checked timeline.
Latest Story
Europe did something unusual with pollution: it gave carbon a price and let a market decide what that price should be. The experiment did not work perfectly at first — the first carbon market was flooded with permits, prices collapsed toward zero within two years, and critics questioned whether trading emissions could change industrial behaviour at all. Europe did not abandon the experiment. It rebuilt it — three times over, across two decades, until the carbon price became a real cost of making steel, cement, electricity, aluminium and fertiliser, and then, in 2026, began reaching past Europe’s own borders to the imports competing with that industry. The question this timeline keeps returning to is a simple one: what happens when the price of pollution becomes part of the cost of making things — and, soon, part of the cost of heating a home or filling a car?
Every figure above traces to a published European Commission notice, EUR-Lex regulatory text, or an official EU institutional source, cited inline in the relevant section below. The 2026 EU ETS auction price itself moved in a roughly €60–95 per tonne range over 2025–26 on secondary market reporting (EEX, Reuters) — treated here as an approximate, hedged range rather than a single verified figure, since no single official “the 2026 EU carbon price” statistic exists; the CBAM quarterly certificate price, which is itself an official average of EU ETS auction prices, is the most precise 2026 anchor available.
🧠 AI Overview Summary
The EU carbon market is not one system. The EU ETS is a cap-and-trade market launched in 2005 that prices emissions from EU power plants and factories. CBAM (Carbon Border Adjustment Mechanism) is a separate mechanism, in definitive effect since 1 January 2026, that charges a comparable carbon cost on selected imports — cement, steel, aluminium, fertiliser, electricity and hydrogen — to stop production simply moving outside the EU to avoid that cost. ETS2 is a third, newly built system covering buildings and road-transport fuels, now delayed to become fully operational in January 2028 rather than 2027. Together they trace one 20-year experiment: Europe put a price on carbon in 2005, watched that price collapse to near zero by 2007 from a flood of free permits, rebuilt the market’s scarcity through reform and a Market Stability Reserve, and by 2026 began extending the same carbon price to imports and, from 2028, to households.
EU Carbon Market: Key Questions
Ten things this record actually shows
- The EU ETS, CBAM and ETS2 are three separate systems. EU ETS (2005) prices EU industrial and power emissions; CBAM (definitive since 2026) prices selected imports; ETS2 (2028) prices building and road-transport fuels. Confusing them is the most common error in coverage of this topic.
- The 2007 collapse is the market’s founding lesson. Over-allocated, unbankable Phase 1 permits fell toward zero in value — proof that a carbon market cannot create scarcity if regulators issue more permits than the market needs.
- Europe rebuilt the market at least three times. Phase 2’s tighter cap, Phase 3’s single EU-wide cap and auctioning default, and the 2019 Market Stability Reserve each targeted the same underlying flaw: chronic oversupply.
- CBAM’s definitive regime began 1 January 2026 — but the first certificates covering 2026 imports are not purchased until February 2027, a one-year lag that trips up most casual explainers.
- The Q1 2026 CBAM certificate price was €75.36 per tonne of embedded CO2-equivalent, an official European Commission figure tied to the EU ETS auction average, not a fixed tariff.
- ETS2 was delayed from 2027 to 2028 in a November 2025 decision bundled with the EU’s 2040 climate target — a genuine, recent policy change that most existing coverage has not caught up to.
- Free EU ETS allowances for CBAM sectors are being phased out on a schedule, not cut off abruptly: roughly 97.5% retained in 2026, falling toward zero by 2034, timed to CBAM’s own ramp-up.
- The Social Climate Fund exists because carbon pricing has a distributional cost. Extending pricing to heating and driving fuel raises bills for lower-income households first — the Fund is Europe’s acknowledgment of that, not a contradiction of the policy.
- Carbon leakage, not just emissions, is what CBAM is built to prevent. A carbon price that only applies inside the EU risks pushing carbon-intensive production outside it, without cutting a tonne of global emissions.
- The market’s story keeps reaching new actors. It began as a policy for European power plants; it now shapes decisions by steelmakers in India, aluminium exporters in Turkey and, from 2028, households paying for petrol and gas across the EU.
Europe’s Carbon Experiment
The signature question at each stage of this timeline is not “what happened” but “did the mechanism work” — and what Europe did next when it didn’t.
| Stage | The question being tested | Resolved by |
|---|---|---|
| 1. Can carbon be traded? | Can a market, not a regulator, set the price of a tonne of CO2? | 2005 launch of the EU ETS |
| 2. What happens with too many permits? | Does over-allocation break the price signal entirely? | 2007 collapse toward €0 |
| 3. Can the market be repaired? | Can a redesigned cap restore scarcity after a failure this public? | 2013 Phase 3 overhaul |
| 4. Can scarcity be maintained? | Can supply be adjusted dynamically instead of fixed for years at a time? | 2019 Market Stability Reserve |
| 5. Can pricing drive climate neutrality? | Can a market instrument anchor a legally binding 2050 target? | 2019–21 European Green Deal & Climate Law |
| 6. Can industry be protected from leakage? | Can Europe raise its carbon price without simply exporting its emissions? | 2023–26 CBAM |
| 7. Can pricing reach households? | Can carbon pricing extend to heating and driving without an unmanaged social cost? | 2028 ETS2 + Social Climate Fund |
| 8. Can Europe’s price move the global economy? | Does a regional carbon price start shaping decisions made outside the EU? | 2026 onward — CBAM’s effect on India, China, Turkey and others |
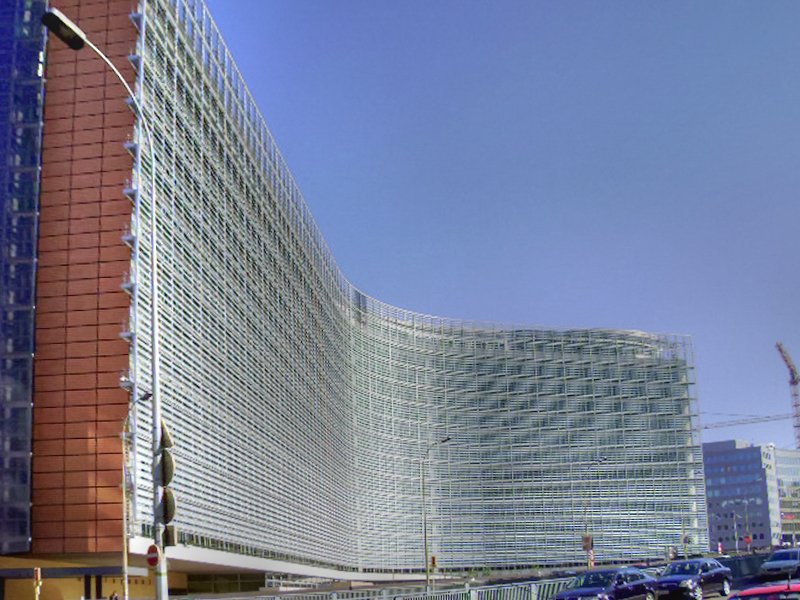
The Berlaymont building in Brussels — headquarters of the European Commission, which drafts and enforces EU ETS, CBAM and ETS2 rules.
EU ETS vs CBAM vs ETS2: The System Map
Search results and even some official-adjacent explainers blur these together. They are not interchangeable.
| System | What it prices | Who is directly affected | Start | Purpose |
|---|---|---|---|---|
| EU ETS | Emissions from covered power plants, factories, aviation & shipping | EU-based operators and airlines/shipping lines | 1 January 2005 | Internal carbon pricing via cap-and-trade |
| CBAM | Embedded carbon in selected imports | Importers of cement, steel, aluminium, fertiliser, electricity, hydrogen | Definitive regime, 1 January 2026 | Prevent carbon leakage at the EU’s external border |
| ETS2 | Fuel used in buildings, road transport & small industry | Fuel suppliers/distributors (not consumers directly) | Fully operational January 2028 | Extend carbon pricing beyond heavy industry and power |
⚠ The one-sentence version
EU ETS prices what Europe makes. CBAM prices what Europe imports. ETS2 will price what Europe’s households burn. One shared design philosophy — a cap, a tradable allowance, a market-discovered price — applied to three different populations of emitters, at three different points in time.
The Full Timeline: 1992–2028
Seventeen milestones, newest first, tracing the policy roots, the market’s construction, its 2007 failure, its repeated rebuilding, and its 2026–28 extension to imports and households.
Commission Proposes Post-2030 ETS Reform; Carbon Price Hits a 9-Month High
What happened: On 17 July 2026 the European Commission tabled its proposal for the EU ETS’s post-2030 design (a “Phase 5” running 2031–2040), setting a slower annual cap-reduction rate — 3.7% for 2031–35 and 1.7% for 2036–40, down from the current 4.3% — extending free allocation for heavy industry beyond 2030 and phasing it out only by around 2037, and proposing a roughly €100 billion Industrial Decarbonisation Bank funded partly through ETS allowances. The Council and Parliament are targeting political agreement by Q1 2027; none of this is enacted law yet, and it would extend the CBAM-linked free-allocation phase-out described above, which remains legally set to reach zero by 2034 unless this proposal passes. Separately, EU Allowance prices climbed to their highest level since January 2026 in mid-September, with a December 2026 EUA contract briefly touching €88.53 per tonne on 14 September 2026, as a natural-gas price rally made coal-fired power more competitive than gas, pushing utilities to buy more allowances to cover the resulting emissions.
Why it matters: The reform proposal shows the Commission trying to hold industry support and 2040-target ambition together at once; the price move is a reminder that EU carbon prices remain highly sensitive to energy markets, not just to ETS policy design.
ETS2 Becomes Fully Operational; First CBAM Certificates Purchased
What happened: Importers begin purchasing CBAM certificates in February 2027 covering their actual 2026 imports — the moment CBAM’s definitive regime becomes a real cash cost, a full year after the regime’s legal start date. Separately, ETS2 — delayed from January 2027 — becomes fully operational for compliance purposes from January 2028, though limited voluntary early auctioning may begin in 2027.
Why it matters: Two different “2027” dates get conflated constantly in coverage of this topic: CBAM’s certificate-purchase start and ETS2’s original (now superseded) start date. They are unrelated events in unrelated systems.
CBAM’s Definitive Regime Begins; the MSR Withdraws 190 Million Allowances
What happened: CBAM’s transitional, reporting-only phase ends and its definitive regime begins on 1 January 2026: free allocation for CBAM-covered EU sectors starts phasing out (roughly 97.5% retained in 2026), and the European Commission publishes the first-ever quarterly CBAM certificate price — €75.36 per tonne CO2-equivalent for Q1, followed by €75.28 for Q2. On 29 May 2026 the Commission separately confirms that 190,494,202 EU ETS allowances will be withdrawn into the Market Stability Reserve between September 2026 and August 2027, based on a 2025 total-allowances-in-circulation figure of just over one billion.
Why it matters: These are two of the most concrete, checkable 2026 data points in the entire EU carbon story — official prices and an official withdrawal volume, not estimates.
Fit for 55 Becomes Law: CBAM Launches, ETS2 Is Legislated, Maritime Joins
What happened: The European Parliament and Council adopt CBAM as Regulation (EU) 2023/956 and the revised ETS Directive (EU) 2023/959, which both tightens the existing EU ETS cap and legally creates ETS2. CBAM’s transitional, reporting-only phase runs from 1 October 2023 to 31 December 2025. The Social Climate Fund is established in parallel (Regulation (EU) 2023/955). Maritime shipping enters the EU ETS from 1 January 2024, phased in over three years. In October 2025 a “CBAM Omnibus” simplification regulation adds a 50-tonne de minimis exemption for small importers, without expanding CBAM’s sector scope. In November 2025, as part of agreeing the EU’s 2040 climate target, member states push ETS2’s start back one year, to 2028.
Why it matters: This is the period where “Fit for 55” stops being a legislative proposal and becomes three operating (or soon-to-operate) carbon-pricing systems — and where the ETS2 timeline that most 2024-era articles still cite gets quietly revised.
Fit for 55 Proposed; Phase 4 Begins; the European Climate Law Binds 2050
What happened: The European Commission proposes the Fit for 55 legislative package, aiming for a legally binding 55% net emissions cut by 2030 versus 1990 — the blueprint that eventually produces CBAM and ETS2. Weeks earlier, the European Climate Law enters into force, making the EU’s 2050 climate-neutrality target and 2030 target legally binding across all member states. The EU ETS’s fourth trading phase (2021–2030) begins, with a tighter annual cap-reduction rate than Phase 3.
Why it matters: 2021 is the pivot from “carbon pricing as one climate tool among several” to “carbon pricing as the backbone of a legally binding decarbonisation pathway.”
The Market Stability Reserve Goes Live; the European Green Deal Is Announced
What happened: The Market Stability Reserve begins operating on 1 January 2019, automatically withdrawing allowances from the market when the total number in circulation exceeds a set threshold. Prices, which had spent most of the 2010s below €10 per tonne, rise into the €20s within the year. In December, the newly installed European Commission announces the European Green Deal, a growth strategy built around reaching net-zero emissions by 2050.
Why it matters: The MSR is the single mechanism most responsible for turning the EU ETS from a chronically oversupplied, low-signal market into a functioning price driver — the direct fix for the flaw exposed in 2007.
The Market Stability Reserve Is Legislated
What happened: After years of persistent oversupply — more than 2 billion surplus allowances at the surplus’s peak — the EU agrees the legal basis for a Market Stability Reserve: a rules-based mechanism that automatically adjusts the number of allowances auctioned each year, based on the total quantity in circulation.
Why it matters: This is Europe formally admitting that a fixed cap set years in advance cannot absorb demand shocks (like the 2008 financial crisis) on its own — the market needed an automatic stabiliser, not just a smaller cap.
Phase 3: A Single EU-Wide Cap Replaces 30 National Ones
What happened: The EU ETS’s third phase replaces the old system of 27–30 separate national allocation plans with one EU-wide cap, falling by a fixed linear factor each year. Auctioning becomes the default allocation method for power generators, rather than free allocation. The NER300 fund begins channelling ETS auction revenue into low-carbon demonstration projects.
Why it matters: Phase 1 and 2’s core weakness — national governments setting their own allocations, with an incentive to be generous to domestic industry — is structurally removed. This is the market’s first serious rebuild.
Aviation Is Brought Into the EU ETS
What happened: Flights within the European Economic Area are brought under the EU ETS cap, requiring airlines to surrender allowances for their emissions on covered routes — the first major sector added to the market beyond its original power-and-industry base.
Why it matters: This established the template later reused for maritime shipping in 2024: expanding an existing cap-and-trade system to a new transport sector, rather than building a separate scheme from scratch.
Phase 2 Begins — and a Financial Crisis Crushes Demand
What happened: Phase 2 aligns the EU ETS with the Kyoto Protocol’s first commitment period and tightens the overall cap. Within months, the global financial crisis sharply cuts industrial output across Europe. Lower production means lower emissions, which means companies need fewer allowances than expected — producing a second, structural surplus even under a tighter cap.
Why it matters: The lesson here is not simply “the financial crisis weakened carbon prices.” It is that recession lowers industrial production, which lowers real emissions, which leaves companies holding allowances they no longer need — a demand-side surplus stacking on top of Phase 1’s supply-side one.
The Phase 1 Carbon Price Collapses Toward Zero
What happened: National governments had allocated Phase 1 allowances based on estimated, not independently verified, emissions data. When the first year’s actual, verified emissions came in below the allowances issued, the market realised there was a large surplus — and because Phase 1 allowances could not be carried into Phase 2, holding onto worthless-at-expiry permits made no economic sense. The price, which had traded above €20 per tonne in 2006, fell toward zero by the end of Phase 1.
Why it matters: This is the single most important lesson in the market’s history: a carbon market cannot create scarcity if policymakers issue more permits than the market needs, and a pilot phase’s design flaws become brutally visible the moment real data replaces estimates.
The EU ETS Launches — the World’s First Major Carbon Market
What happened: The EU Emissions Trading System begins operating on 1 January 2005, covering power generators and energy-intensive industry across the (then) 25 member states. Almost all Phase 1 allowances are allocated free of charge via national allocation plans. A non-compliance penalty of €40 per tonne is set for operators who fail to surrender enough allowances to cover their verified emissions.
Why it matters: This is the first cap-and-trade market for greenhouse gases operating at this scale anywhere in the world — establishing the monitoring, reporting, verification and trading infrastructure every later phase, and CBAM’s own price reference, still relies on.
The EU ETS Directive Is Adopted; Implementation Begins
What happened: The European Parliament and Council adopt Directive 2003/87/EC, establishing the legal framework for the EU ETS. Through 2004, member states build the registries, monitoring rules and national allocation plans needed to open the market on schedule.
Why it matters: Europe chose emissions trading, not a uniform carbon tax, partly because a cap-and-trade system lets the market discover the cheapest way to cut emissions across very different industries and countries, rather than a regulator setting one price by decree.
The European Commission’s Green Paper on Emissions Trading
What happened: The European Commission publishes a Green Paper setting out the case for an EU-wide greenhouse gas emissions trading scheme, opening formal debate among member states, industry and environmental groups over the market’s design.
Why it matters: This is where “should Europe price carbon, and how” moves from an idea discussed after Kyoto into an actual policy design process — the direct ancestor of the 2003 Directive.
The Kyoto Protocol Is Adopted
What happened: Under the UNFCCC, industrialised countries adopt the Kyoto Protocol, setting binding emissions-reduction targets and formally recognising emissions trading as a compliance mechanism between nations.
Why it matters: Kyoto gave the EU both a binding external commitment to meet and international legitimacy for using a trading mechanism — without it, the EU ETS’s 2005 launch would have lacked its original legal anchor.
The UNFCCC Is Adopted at the Rio Earth Summit
What happened: The United Nations Framework Convention on Climate Change is adopted, creating the treaty framework under which Kyoto, the Paris Agreement and, indirectly, the EU’s own carbon-pricing architecture would later be built.
Why it matters: Every mechanism in this timeline — the EU ETS, CBAM, ETS2 — sits inside a policy lineage that starts here, with the basic international recognition that greenhouse gas emissions needed a coordinated global response.
The 2007 Price Collapse: Carbon’s First Real Lesson
Ask most people how a carbon market fails, and they picture prices spiking out of control. The EU ETS’s first real crisis went the opposite way: the price of a tonne of carbon dioxide fell from over €20 in April 2006 to a few cents by the end of Phase 1 in 2007. That is not a footnote in this market’s history — it is the event every later reform responds to.
Why the price fell to zero
Phase 1’s allowances were allocated through national allocation plans — each of the (then) 25 member states deciding, largely on its own, how many free permits its power plants and factories would receive. Those numbers were built on estimated emissions, submitted by industry and negotiated between governments and Brussels under real political pressure to protect domestic industry from cost increases. When the first year of independently verified emissions data came in during spring 2006, it showed emissions well below the allowances that had been issued. The market realised, almost overnight, that there were simply more permits in circulation than companies needed.
That alone might only have softened the price. What turned it into a collapse toward zero was a second design choice: Phase 1 allowances could not be “banked” — carried forward — into Phase 2. A permit that could not be used after 2007, and that nobody needed to buy in 2007 either, had no reason to hold any value as the deadline approached. Selling a worthless-at-expiry asset for whatever price the market would pay was the rational choice for every holder at once.
⚠ The signature insight
A carbon market cannot create scarcity if policymakers issue more permits than the market needs. Trading infrastructure, monitoring rules and a market price all existed by 2005 — none of it mattered once the cap itself stopped being binding.
The failure was survivable, and arguably necessary, because it happened during a deliberately short three-year pilot phase rather than a long-term compliance period. Every reform since — Phase 2’s tighter, Kyoto-aligned cap; Phase 3’s move to a single EU-wide cap set centrally rather than negotiated nationally; and the 2015–19 Market Stability Reserve — targets some version of the same root problem: keeping the number of allowances in circulation close enough to actual demand that the price signal stays meaningful.
The Market Stability Reserve: How Europe Keeps Carbon Scarce
By the early 2010s, the EU ETS was carrying a structural surplus of more than two billion allowances — a legacy of the 2008 financial crisis’s demand shock layered on top of Phase 1’s original over-allocation. A market that oversupplied cannot fix itself simply by lowering the cap for future years; the old surplus keeps depressing the price regardless.
The Market Stability Reserve (MSR), established under Decision (EU) 2015/1814 and operating since 1 January 2019, is Europe’s answer: a rules-based mechanism that automatically adjusts how many allowances are auctioned each year, based on the Total Number of Allowances in Circulation (TNAC), published by the Commission annually by 1 June.
In plain terms: the EU created a mechanism that can remove allowances from circulation when the market contains too much supply — and, under the reverse condition, can release allowances back if circulation runs too low. If TNAC exceeds an upper threshold, a percentage of the surplus is withdrawn from the following year’s auctions and placed in the reserve, invisible to the market, rather than sold. If TNAC falls below a lower threshold, allowances can instead be released back from the reserve into auctions.
The scale of this mechanism in 2026 is large: the Commission’s 29 May 2026 notice confirms 190,494,202 allowances will be withdrawn into the MSR between 1 September 2026 and 31 August 2027, based on a 2025 TNAC of just over 1.02 billion allowances. That is not a rounded estimate — it is the exact legal output of the formula applied to that year’s published TNAC.
The MSR does not set the carbon price directly. What it does is remove the mechanism by which a one-off surplus, like the one created in 2007 or after 2008, can permanently depress the price for a decade or more. It is the structural fix for the exact failure mode this market experienced twice in its first ten years.
CBAM: When Europe’s Carbon Price Reached the Border
Before CBAM, a carbon price mostly affected what Europe made. After CBAM, the carbon intensity of what Europe imports becomes economically relevant too.
The Carbon Border Adjustment Mechanism is designed to solve a problem the EU ETS could not solve on its own: carbon leakage. If EU steelmakers pay for their carbon emissions and foreign competitors do not, production — and the emissions that come with it — can simply relocate outside the EU, or European buyers can switch to cheaper, carbon-intensive imports. Either way, global emissions do not fall; they just move somewhere the EU’s price signal cannot reach.
CBAM addresses this by requiring importers of covered goods to buy CBAM certificates matching the embedded carbon in what they bring into the EU, priced against the same weekly EU ETS auction average that EU producers already pay. It is best described as a border adjustment matching an existing internal carbon price, not a stand-alone tariff invented at the border — though the political debate over whether it functions partly like a trade-protection measure is real and unresolved (see below).
CBAM Timeline
Fit for 55 proposes a carbon border mechanism
Political agreement between Parliament & Council
CBAM Regulation (EU) 2023/956 adopted
Transitional period begins — reporting only, no payment
Quarterly embedded-emissions reporting by importers
Final transitional year; CBAM Omnibus simplification adopted
Definitive regime begins; free ETS allocation starts phasing out
First certificate purchases, covering 2026 imports
⚠ The date people get wrong
CBAM’s definitive regime began on 1 January 2026 — but certificates covering 2026 imports are not purchased until February 2027. An importer’s 2026 obligation is real from day one; the cash payment for it arrives more than a year later, once the year’s actual embedded emissions are finalised and reconciled.
What CBAM Covers, and What It Costs
CBAM’s definitive regime covers six sectors: cement, iron and steel, aluminium, fertilisers, electricity and hydrogen — chosen because they are both carbon-intensive and exposed to international trade. An October 2025 “CBAM Omnibus” regulation simplified compliance (notably, a 50-tonne per importer per year de minimis exemption removing thousands of negligible importers from reporting obligations) but did not expand this sector list; a review of extending CBAM to organic chemicals and polymers remains under consideration, not yet adopted.
The European Commission published the first-ever official CBAM certificate price on 7 April 2026: €75.36 per tonne of CO2-equivalent for Q1 2026, calculated as the weighted average of EU ETS auction clearing prices for that quarter. Q2 2026’s price, published 6 July 2026, came in almost identical at €75.28. Because the certificate price tracks the EU ETS auction average directly, it moves with the same policy and market forces — the MSR’s withdrawals, industrial demand, energy prices — that move the EU ETS itself.
Free EU ETS allowances for CBAM-covered sectors are being phased out on a published schedule that mirrors CBAM’s own ramp-up: roughly 97.5% of previous free allocation retained in 2026, falling to around half by 2030, and toward zero by 2034. This timing matters — it prevents EU producers from simultaneously receiving free allowances and border protection against imports, which would have amounted to double protection.
✅ What CBAM is designed to do
- Match the carbon cost EU producers already pay to comparable imports
- Discourage carbon leakage — production or emissions simply relocating outside the EU
- Encourage carbon accounting and lower-carbon production methods among exporters to the EU
⚠ The unresolved debate
- Trading partners including India argue it functions partly as a protectionist trade barrier
- Smaller exporters face real compliance and verification costs, even with the 2025 simplification
- Whether CBAM is fully compatible with WTO non-discrimination rules remains legally contested
ETS2: Europe’s Second Carbon Market
Buildings, road transport, and the carbon price moving closer to the household.
ETS2, legislated under Directive (EU) 2023/959, is a separate emissions trading system covering fuel used in buildings, road transport and small industrial combustion not already covered by the original EU ETS. Crucially, it regulates fuel suppliers and distributors — roughly 11,400 entities across the EU — not individual households or drivers directly. In practice, a supplier’s ETS2 cost is expected to be passed through into the retail price of heating fuel and petrol, in the same way excise duties already are.
The date that changed: ETS2 was originally scheduled to become operational in January 2027. In November 2025, as part of agreeing the EU’s 2040 climate target, member states pushed that back one year — ETS2 is now scheduled to be fully operational, with binding compliance obligations, from January 2028. Limited voluntary early auctioning may still begin in 2027, but the regulatory start most sources cited through 2024 and early 2025 is superseded.
Because ETS2 puts a carbon cost into products — heating fuel, petrol, diesel — that households buy directly and cannot easily substitute away from in the short term, the EU built a companion mechanism: the Social Climate Fund (Regulation (EU) 2023/955, in force since June 2023). It is designed to help vulnerable households, micro-enterprises and transport users absorb ETS2-driven cost increases, funding measures like building renovation, clean heating and cleaner transport access.
⚠ A figure worth stating carefully
Official EU sources cite two different Social Climate Fund figures depending on what they are counting: €65 billion is the EU’s own budgetary contribution for 2026–2032, while a commonly cited €86.7 billion figure appears to include the mandatory minimum 25% co-financing member states must add on top. Both numbers are legitimate depending on what is being measured — this article does not present a single figure without that caveat.
The logic behind the Fund answers a fair question: why would Europe need a social fund if carbon pricing is supposed to change behaviour through cost signals? The answer is that a household’s ability to respond to a higher fuel price — by insulating a home, switching to an electric vehicle, or using public transport — depends heavily on income and existing infrastructure. Without support, the same price signal that nudges a wealthier household toward a heat pump can simply squeeze a lower-income household’s budget with no realistic way to respond. The Fund is Europe’s acknowledgment of that gap, not a concession that carbon pricing doesn’t work.
Carbon Leakage and Free Allocation, Explained
Carbon leakage is the risk that a carbon price applied in one jurisdiction simply pushes emissions somewhere else, rather than reducing them. The textbook version: a European steel producer faces real carbon costs; a competitor outside the EU does not; production, investment and jobs migrate to the lower-cost, higher-emissions location, and EU consumers switch to the now-cheaper imported steel. Global emissions do not fall — they may even rise, if the relocated production is less efficient.
This is exactly why the EU gave carbon-intensive, trade-exposed sectors free EU ETS allowances for two decades, rather than making them pay for every tonne from day one — a widely misunderstood policy choice. Free allocation was never meant to be permanent; it was a bridge, protecting competitiveness while the market matured, always intended to shrink as either global climate ambition converged or as a border measure like CBAM took over the leakage-prevention job instead. That handover is exactly what is happening now: free allocation for CBAM sectors declines on a published schedule as CBAM’s own coverage strengthens, precisely so industry is not protected twice, or left unprotected in the gap between the two mechanisms.
It is worth distinguishing carbon leakage’s different real-world forms: outright relocation of a factory is the most visible, but leakage can also happen through import substitution (EU buyers simply switch to a carbon-intensive imported product instead of a EU-made one) or through investment decisions (a company builds its next plant outside the EU rather than physically moving an existing one). CBAM is designed to address all three channels by pricing the imported good itself, not just the EU producer’s process.
EU Allowance vs Carbon Credit: Not the Same Thing
A European Union Allowance (EUA) is a compliance instrument: the right to emit one tonne of CO2-equivalent, issued or auctioned under a fixed, shrinking EU-wide cap, and legally required for EU ETS compliance. A carbon credit, by contrast, typically represents a claimed emissions reduction or removal generated by a project — a forest, a renewable energy installation, a methane-capture scheme — usually traded in voluntary carbon markets with no overarching cap and highly variable verification standards. EUAs are not generally interchangeable with voluntary carbon credits for EU ETS compliance purposes; conflating the two is one of the most common errors in casual coverage of carbon markets.
Carbon Market vs Carbon Tax
| Feature | EU ETS (cap-and-trade) | A carbon tax |
|---|---|---|
| Price | Market-determined, floats with supply/demand | Set by the regulator, adjustable by policy |
| Quantity of emissions | Fixed by a shrinking cap — the constraint that matters | Not directly capped, only priced |
| Trading | Yes, allowances are bought and sold | No trading mechanism inherent to the instrument |
| Price volatility | Possible, especially around demand shocks | Low; tax rate is a known, stable input |
| Emissions certainty | High — the cap is the constraint | Lower — a fixed price doesn’t guarantee a fixed emissions outcome |
In practice, real systems often combine elements of both: the EU ETS sets a minimum reserve price at auction and the MSR effectively manages quantity to stabilise price, blurring the pure cap-and-trade model. CBAM, similarly, behaves like neither a pure tariff nor a pure tax — it borrows its price directly from a cap-and-trade market.
Global Impact: When Europe’s Carbon Price Reached World Trade
Before CBAM, the EU carbon price mostly affected EU production. After it, the carbon intensity of imported steel, aluminium, cement and fertiliser becomes economically relevant far outside Europe.
What CBAM Means for Indian Exporters
India is a significant exporter of steel and aluminium to the EU, sectors directly inside CBAM’s scope. Exporters now need robust embedded-emissions accounting, third-party verification and supplier-level carbon data to sell into the EU market without a growing CBAM certificate cost. India’s own Carbon Credit Trading Scheme and Bureau of Indian Standards emissions-measurement work are, in part, responses to this pressure. No credible source currently quantifies a specific rupee or export-volume loss figure for India from CBAM — treat any such number with scepticism.
China’s Own ETS Meets CBAM
China operates the world’s largest carbon market by covered emissions, though it currently covers only the power sector, uses emissions-intensity rather than an absolute cap, and trades at a far lower price than the EU ETS. Chinese steel and aluminium exporters to the EU face the same CBAM obligations as any other origin; the price gap between China’s ETS and the EU’s is itself a live input into how large the CBAM cost will be for Chinese-origin goods.
Turkey’s Domestic Carbon Market
Turkey, a major EU trading partner for steel and cement, has been developing its own national emissions trading system partly in response to CBAM — a domestic carbon price is the clearest way an exporting country can reduce the CBAM cost gap its producers otherwise face at the EU border.
A Stalled Linkage
The UK operates its own UK ETS, modelled closely on the EU system post-Brexit. A political agreement in principle to link the two markets was reached in May 2025, with formal negotiations beginning in January 2026 and a summit targeted for July 2026 — but that summit was postponed after disputes over free-permit allocation and emissions-cap alignment. As of September 2026, linkage remains unresolved, with officials citing full price alignment as unlikely before 2029 even if talks succeed — a live negotiation rather than a completed deal.
No National Carbon Market
The US has no EU-style national cap-and-trade system; carbon pricing exists only at the state level (California’s cap-and-trade, linked with Quebec, and the Northeast’s RGGI power-sector scheme). US trade policy has been publicly critical of CBAM, framing it as a barrier facing American exporters who have no domestic carbon price to point to as an equivalent.
The Sectors Most Exposed
These four industries sit at the centre of CBAM by design — carbon-intensive, energy-intensive, and heavily traded internationally. Producers in all of them, regardless of origin country, are the ones actually filling out CBAM declarations and paying CBAM certificate costs from 2026 onward.
| Market | Started | Coverage | Price-setting | 2026 status |
|---|---|---|---|---|
| EU ETS | 2005 | Power, industry, aviation, maritime | Auction/trading under a hard cap | Phase 4 (2021–30); CBAM now backs it at the border |
| UK ETS | 2021 | Similar to EU ETS | Auction/trading under a hard cap | Own system; EU linkage talks stalled |
| China ETS | 2021 | Power sector (expanding) | Intensity-based, not an absolute cap | World’s largest by covered volume; lower price than EU |
| California–Quebec (WCI) | 2014 (linked) | Broad economy-wide | Auction/trading under a hard cap | Operating, linked market |
| RGGI (US Northeast) | 2009 | Power sector only | Auction under a regional cap | Operating among participating states |
| Korea ETS | 2015 | Broad economy-wide | Auction/trading under a hard cap | Third-largest market by coverage |
| New Zealand ETS | 2008 | Broad, including forestry | Auction/trading under a hard cap | Unique for including forestry removals |
Follow the Carbon
One AiTimeline framework, asked at every stage: who pays, who is protected, and who ultimately bears the cost?
| Stage | Who pays | Who gets protected | Who pays at the border |
|---|---|---|---|
| 2005 | Power generators buying/using allowances | Industry, via near-total free allocation | No border mechanism exists yet |
| 2007 | Nobody — the price collapsed to near zero | Effectively everyone, unintentionally | N/A |
| 2013 | Power sector, now mostly via auctions | Trade-exposed industry, still free allocation | N/A |
| 2019 | All covered installations, at a rising MSR-supported price | Same, with more price certainty | N/A |
| 2023 | Covered installations; maritime lines join | Free allocation begins its scheduled decline | Reporting only — no payment yet |
| 2026 | Covered installations, now with less free allocation | EU producers, transitioning to CBAM-based protection | Importers of steel, cement, aluminium, fertiliser, electricity, hydrogen |
| 2027 | Same, plus first real CBAM cash payments | Same | Importers pay for 2026 imports, in cash, for the first time |
| 2028 | Fuel suppliers under ETS2, passed through to households | Vulnerable households, via the Social Climate Fund | Same CBAM mechanism, now alongside a domestic household carbon cost |
What Europe Learned From Its First Carbon Market
Ten design lessons
- Scarcity matters. A cap that isn’t genuinely binding is not a price signal at all — it’s paperwork.
- Accurate emissions data matters. Phase 1’s allocations were built on estimates; the gap between estimate and verified reality is what triggered the 2007 collapse.
- Allowance allocation matters. Decentralised, nationally negotiated allocation (Phase 1–2) is more prone to over-generosity than a single EU-wide cap (Phase 3 onward).
- Banking rules matter. Letting allowances carry forward between phases (from Phase 2 onward) smooths price shocks that non-bankable Phase 1 permits could not absorb.
- Market stability mechanisms matter. A fixed cap set years in advance cannot absorb an unforeseen shock like a financial crisis; the MSR gives the market an automatic stabiliser.
- Carbon pricing must interact with energy policy. Gas and coal prices, renewables buildout and electricity demand all move the carbon price as much as climate policy itself does.
- Industry competitiveness matters. Free allocation existed for two decades precisely because pricing carbon without addressing leakage risked exporting emissions, not cutting them.
- Border measures become important as domestic carbon prices rise. CBAM only became necessary once the EU ETS price rose high enough to create a real leakage risk worth addressing.
- Social policy matters once carbon pricing reaches consumers. ETS2’s Social Climate Fund exists because a heating-fuel or petrol price increase lands differently depending on income and infrastructure access.
- Long-term policy credibility changes investment decisions. A legally binding 2050 target (the European Climate Law) gives industry a planning horizon a market price alone cannot provide.
Did Europe’s Carbon Market Work?
Not a simple yes or no. On its own terms — creating a functioning, tradable price on a large share of Europe’s industrial and power-sector emissions, and sustaining it through a near-total collapse, a financial crisis and a pandemic — the EU ETS has clearly worked: it is the template every other major carbon market, from the UK to South Korea, has drawn on. Verified emissions from covered EU ETS installations have fallen substantially since 2005, though how much of that reduction is attributable to the ETS price signal specifically, versus renewables expansion, energy efficiency policy, fuel switching, and economic cycles including the 2008 crisis, COVID-19 and the 2022 energy crisis, is genuinely contested among researchers and should not be collapsed into a single “the ETS caused X% of the reduction” claim.
Where the record is more mixed: the 2007 collapse and the post-2008 surplus each cost the market close to a decade of weak price signals before repair mechanisms (Phase 3, the MSR) took full effect. Carbon leakage remained a real, unresolved risk for two decades before CBAM began to address it in 2026 — and CBAM itself remains contested, both legally and diplomatically, with major trading partners. The Social Climate Fund’s own headline figure is not even fully settled between official EU sources.
The next test is 2026–2028: whether CBAM survives its early diplomatic friction with India, China, the US and others without triggering a genuine trade dispute; whether ETS2 launches on its new 2028 timeline without the kind of political backlash that has already delayed it once; and whether a carbon price that now reaches EU factories, global steel and aluminium exporters, and, soon, European households, remains politically durable as its costs become more visible to more people at once.
Europe’s Carbon Market Is No Longer Just Climate Policy
Trace the arc of this timeline and a pattern is hard to miss: environmental policy became a financial market in 2005, that market became a lever of industrial policy through free allocation and the MSR, industrial policy became trade policy the moment CBAM reached the border in 2026, and trade policy is about to become social policy once ETS2 and the Social Climate Fund reach households in 2028. Few climate policies anywhere have been rebuilt this many times, this deliberately, in public view, with the failures left on the record rather than quietly buried. That is arguably the more interesting story than any single price chart: not that Europe priced carbon correctly on the first try, but that it kept adjusting the mechanism for two decades rather than abandoning the idea after a failure that would have ended a less durable policy outright.
Explore More Timelines
People Also Ask
Frequently Asked Questions
Related AiTimeline Coverage
⚠️ Editorial Note
This article separates official European Commission and EUR-Lex regulatory sources from independent reporting (Reuters, Bloomberg, ICAP Carbon Action, Politico Europe) and editorial analysis throughout. Historical dates and regulation numbers are cross-checked against European Commission and EUR-Lex primary sources; current 2026 figures (CBAM certificate prices, MSR withdrawal volume, ETS2 timing) are checked against official Commission notices published in 2026. Where an official figure is genuinely ambiguous, such as the Social Climate Fund total, this article states both cited figures rather than picking one. This is editorial, AI-assisted content compiled from public sources and is not financial, trade-compliance or legal advice; verify current CBAM and ETS2 obligations against official EU sources before making compliance decisions.
Sources & further reading
Every dated entry above was checked against these references. Last reviewed 20 September 2026.
- European Commission — Development of the EU ETS 2005–2020 (Phase 1–3, incl. the 2007 price collapse)
- European Commission — Start of Phase 4 of the EU ETS in 2021
- EUR-Lex — Decision (EU) 2015/1814 establishing the Market Stability Reserve
- European Commission — Market Stability Reserve explainer
- EUR-Lex — Regulation (EU) 2023/956 establishing CBAM
- European Commission — First CBAM certificate price now available (Q1 2026, €75.36/tCO2e)
- European Commission — ETS2: buildings, road transport and additional sectors
- European Commission — 190 million EU ETS allowances to be placed in the Market Stability Reserve, Sept 2026–Aug 2027