Dangerous Heat in the Western US and England: The Complete Guide
Dangerous heat grips the Western US and England in 2026. Explore heat domes, health risks and climate science, sourced to NOAA, Met Office, CDC and UKHSA.
Latest Story
Before sunrise in Bakersfield, California, a family moves through a routine that changes nothing about the weather but everything about how they survive it: filling water bottles the night before, checking the day’s excessive heat warning on a phone that never left the charger, planning outdoor errands for the hour after dawn before the asphalt starts radiating heat back into the air. At roughly the same clock hour but eight time zones later in a terraced house outside Birmingham, England, an elderly couple closes the curtains against a sun that, by mid-morning, will push their south-facing living room past what their bodies can safely tolerate, and checks the UK Health Security Agency’s heat-health alert for their region before deciding whether today is a day to visit the shops or stay indoors near a fan. Two households, two continents, two very different everyday routines — and one shared, deadly hazard.
This guide exists because dangerous heat is not a single day’s weather story. In August 2026 a heat dome settled over the Western United States, pushing forecast highs to 118°F in Phoenix, 115°F in Las Vegas and 126°F in Death Valley while an unusually severe, multi-episode heatwave and flash drought gripped England and Wales through the spring and summer — two events on opposite sides of the Atlantic, driven by related atmospheric patterns and united by the same basic physics of how a warming climate loads the dice toward more frequent, more intense heat. This guide separates official weather warnings from climate science, health guidance from historical record, and observed fact from independent analysis at every step, because getting that separation right is exactly what a genuinely useful heat-safety resource requires.
Latest Update — September 2026
What has changed since the August update
Both tracked situations moved further into record territory through September 2026 rather than resolving. In the Western and central US, a fresh heat dome pushed record and near-record highs across dozens of cities in the first half of September, running roughly 6-12°F above normal; the National Weather Service issued Extreme Heat Warnings and Heat Advisories from the Central Plains to the Southwest and California on September 8-11, with desert highs forecast up to 116°F and heat index values up to 113°F in southern Texas, as the ridge shifted toward the Southern Plains and lower Mississippi Valley and pushed Oklahoma City, Dallas and Nashville toward triple-digit heat. July 2026 had already finished as the hottest month in US instrumental history, with a national average temperature of 76.89°F, per NOAA data reported that month.
In England, the Environment Agency’s drought status update covering September 4-10 showed 10 areas in drought — up from the seven operational areas plus Wales declared on July 29 — with national reservoir storage at 56.9%, roughly 20% below normal for the time of year, as of early September. The agency has said England needs around 120% of average rainfall between September 2026 and March 2027 for every region to exit drought by spring 2027, and that Devon and Cornwall and East Anglia are at greatest risk of remaining in drought into April 2027 even with average rainfall. The Met Office’s September outlook does not project a further official heatwave, pointing instead to more changeable, autumnal conditions, though drought recovery is expected to take months regardless of near-term temperatures.
🌡 60-Second Answer
In summer 2026, a persistent heat dome brought dangerous, record-challenging heat to the Western United States — forecast highs of 118°F in Phoenix and 126°F in Death Valley — while England and Wales experienced a severe multi-episode heatwave sequence and a formally declared drought after one of the driest summers on record. Both events reflect the same mechanism: a stalled high-pressure ridge trapping hot air in place, a pattern scientific studies show is being made more frequent and more intense by human-caused climate change.
Who, What, Why, When, Where, How
What to Understand Before Reading Further
- Two regions, one mechanism: both the 2026 Western US heat dome and England’s heatwave-drought sequence trace back to stalled high-pressure ridges, a well-understood atmospheric pattern.
- Heat is the deadliest weather hazard in many countries, causing more annual deaths than hurricanes, floods or tornadoes combined in the United States, per National Weather Service records.
- Weather and climate are different timescales: a single heatwave is weather; the long-term trend toward more frequent, intense heat events is climate.
- Night-time temperatures matter as much as daytime highs because they determine how well the human body recovers before the next day’s heat.
- England declared a formal drought in July 2026 across seven operational areas and all of Wales, following one of the driest summers in decades.
- The Pacific Northwest saw a rare “extremely critical” fire-danger designation in 2026, alongside a Particularly Dangerous Situation red flag warning — both unusual, high-level alerts.
- Heat exhaustion and heat stroke are distinct medical conditions with different symptoms and different urgency — knowing the difference can save a life.
- Vulnerable groups face disproportionate risk: older adults, infants, outdoor workers, people with chronic illness, and those without reliable air conditioning.
- Scientific attribution studies, not casual observation, connect specific heatwaves to climate change — the 2021 Pacific Northwest heat dome was found at least 8 times more likely due to human-caused warming.
- This is a living reference, updated as NWS, NOAA, the Met Office, UKHSA and CDC issue new official warnings and guidance.
Executive Summary & One-Minute Summary
The essentials, for readers who need the shape of the story before the detail
Executive Summary (150 words): Dangerous heat gripped the Western United States and England through 2026, driven by the same fundamental atmospheric mechanism — a stalled high-pressure ridge, or heat dome — even as the two events unfolded on different timelines. England experienced a sequence of official heat-health alerts from UKHSA beginning in May, escalating to a red alert (only the second in the system’s history) in late June, alongside a flash drought that prompted a formal declaration across seven operational areas and Wales in late July. The Western US saw a record-challenging heat dome intensify from late July into August, pushing forecast highs to 126°F in Death Valley and triggering rare “extremely critical” wildfire-danger warnings in the Pacific Northwest. Both events sit within a documented long-term trend: peer-reviewed attribution science has found human-caused climate change makes heat events like the 2021 Pacific Northwest heat dome substantially more likely and more intense.
One-Minute Summary: Two very different places, one shared hazard. In England, months of low rainfall culminated in a formally declared drought and a rare red heat-health alert. In the American West, a classic heat-dome pattern — high pressure stalling under a wavering jet stream — pushed temperatures well above seasonal norms and elevated wildfire danger to levels rarely declared. Neither event is unprecedented in isolation; both fit a pattern of increasingly frequent, increasingly intense heat that scientific studies attribute in part to long-term climate warming, layered on top of ordinary short-term weather variability.
Introduction: Understanding Dangerous Heat
What a heatwave actually is, why it’s becoming more common, and why two very different places share the same risk
A heatwave has no single universal definition — the World Meteorological Organization and national agencies each set their own criteria, typically requiring a period of abnormally hot weather, usually several consecutive days, that is substantially warmer than what is normal for that specific place and time of year. That “relative to local normal” clause matters enormously: a run of 90°F days would barely register in Phoenix, Arizona, but the same temperatures in Seattle or southern England — places built and lived in around cooler averages, with far less air conditioning — can overwhelm health systems and infrastructure never designed for that heat. This is why the Western US and England, despite enormous differences in climate, culture and typical summer temperature, both appear in the same conversation about dangerous heat: danger is relative to what a place and its population are prepared for, not just to the absolute number on a thermometer.
Dangerous heat is increasing for reasons scientists can now describe with real precision, not just general concern. Global average temperatures have risen due to the accumulation of greenhouse gases in the atmosphere, primarily from fossil fuel combustion, and that warming raises the baseline on top of which every natural weather pattern operates — so when a heat-favorable weather pattern does occur, it now starts from a warmer baseline and tends to run hotter than an equivalent pattern would have decades ago. This is the essential distinction between weather and climate that runs through this entire guide: weather is the specific atmospheric condition on a specific day in a specific place — this week’s heat dome, this month’s UK drought — while climate is the long-term statistical pattern of weather over decades. A single heatwave is a weather event; the fact that heatwaves are becoming measurably more frequent, more intense and longer-lasting over the past several decades is a climate trend, documented in peer-reviewed literature and national climate assessments.
The Western United States and England are vulnerable to dangerous heat for related but distinct reasons. The American West’s aridity, extensive wildland-urban interface, heavy reliance on air conditioning and grid capacity, and history of severe multi-year droughts make it acutely exposed to compounding heat-and-fire risk. England’s vulnerability runs almost opposite: a historically temperate, rarely-extreme climate means homes, workplaces, transport infrastructure and public health systems were built around modest summer temperatures and widespread absence of air conditioning, so a heatwave that would be unremarkable in Arizona can strain hospitals, railways and vulnerable households in the Midlands or South East. Both patterns illustrate the same underlying point: heat danger depends on the gap between what a place is built for and what it is actually experiencing.
Extreme heat is, by most national accounting, one of the deadliest weather hazards that exists — in the United States, the National Weather Service’s own multi-year mortality data consistently shows heat causing more annual deaths than hurricanes, tornadoes, floods or winter storms, precisely because heat’s dangers are often invisible and cumulative rather than dramatic and immediate. Nobody sees a heatwave coming the way they see a hurricane on satellite imagery; there is no wind damage or floodwater to photograph. That invisibility is itself part of the hazard, which is exactly why official heat-health alert systems in both countries exist: to translate an easy-to-underestimate risk into an actionable, visible warning.
📜 Climate Insight
Heatwaves are influenced by both natural weather patterns and long-term climate warming operating together, not one or the other. A stalled high-pressure ridge is ordinary meteorology; the fact that such ridges are increasingly producing record-breaking, health-threatening heat reflects the warmer baseline climate change has established underneath that ordinary weather.
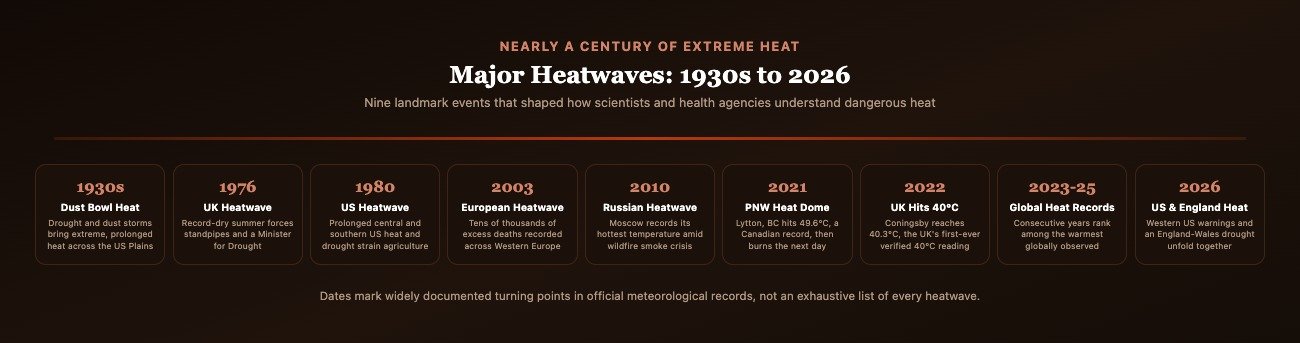
The Complete Heatwave Timeline: 1930s to 2026
Nine landmark events, each separating meteorological background, climate context, official response, public health impact and current relevance
The Dust Bowl Heat Waves
Meteorological background: Severe, prolonged heat struck the US Great Plains through the 1930s, peaking in 1934 and especially 1936, coinciding with a multi-year drought and widespread dust storms from over-farmed, exposed soil.
Climate context: Poor land-management practices removed protective grassland cover, and the resulting bare, dry soil amplified daytime heating — an early, dramatic example of how land conditions can intensify a heat event beyond what atmospheric patterns alone would produce.
Official response: The US government’s response, including the Soil Conservation Service (established 1935), focused on longer-term land management reform rather than short-term heat warnings, which did not yet exist in modern form.
Public health impact: Widely documented excess mortality across the affected Plains states, compounded by respiratory illness from dust exposure alongside heat stress.
Current relevance: Frequently cited by climate scientists as a reminder that extreme heat can arise from land-surface and drought feedbacks, not only from large-scale atmospheric patterns alone.
The 1976 UK Heatwave
Meteorological background: A prolonged summer heatwave and drought affected the UK from June through August 1976, remaining one of the hottest and driest summers in the country’s instrumental record.
Climate context: At the time, the event was understood primarily as extreme natural weather variability; modern climate science now situates it within a longer record showing such summers becoming more frequent as the climate has warmed since.
Official response: The UK government appointed a “Minister for Drought,” and standpipes were installed in some areas as reservoir levels fell and water restrictions were imposed.
Public health impact: Widely reported excess deaths, particularly among older adults, in a country with little air conditioning and housing stock built for a cooler climate.
Current relevance: Still used by the Met Office as a historical benchmark against which later UK heatwaves, including 2022’s record-breaking summer, are compared.
The 1980 US Heatwave and Drought
Meteorological background: A severe summer heatwave and drought affected the central and southern United States, with Texas and Oklahoma among the hardest-hit states.
Climate context: Understood at the time as a major but largely natural weather extreme; later climate assessments have used it as a comparison point for evaluating how subsequent heat events have shifted in frequency and severity.
Official response: Agricultural relief measures were introduced as crop losses mounted; heat-warning systems of the era were far less developed than today’s NWS alert framework.
Public health impact: Substantial heat-related mortality was recorded, with agricultural and economic losses compounding the public health toll through livestock and crop failures.
Current relevance: Referenced in NOAA’s historical climate records as one of the costliest US heat-drought events of the twentieth century.
The 2003 European Heatwave
Meteorological background: An exceptional heatwave struck Western Europe in August 2003, with France recording its hottest temperatures in decades.
Climate context: Later scientific attribution studies found that human-caused climate change had significantly increased the likelihood of a heatwave of this severity, making it one of the earliest widely cited examples of formal heat attribution science.
Official response: France’s public-health response was widely criticized as too slow; the event prompted major reforms, including France’s national heatwave response plan and improved elderly-care protocols still in use today.
Public health impact: France’s national health institute recorded 14,802 heat-related deaths; researchers estimate more than 70,000 excess deaths occurred across Europe during the event, according to academic analyses of that summer’s mortality data.
Current relevance: Remains the reference event for European heat-health policy and is frequently cited in comparisons with subsequent heatwaves, including 2022’s UK record and 2026’s England drought.
The 2010 Russian Heatwave
Meteorological background: A severe and prolonged heatwave affected western Russia through summer 2010, with Moscow recording its hottest temperature on record at 39°C and the national record reaching 44°C at Yashkul, Kalmykia, on July 11.
Climate context: Scientific analyses afterward linked the event’s severity to a combination of a stalled atmospheric blocking pattern and a warmer baseline climate, a combination that has recurred in subsequent major heatwaves.
Official response: Extensive peat and wildland fires broke out near Moscow, blanketing the city in smog; the Russian government faced criticism over its emergency response and air-quality communication.
Public health impact: Moscow’s daily death rate nearly doubled at the peak of the event; the reinsurer Munich Re estimated roughly 56,000 total deaths nationally from the combined effects of heat and wildfire smoke.
Current relevance: Frequently cited alongside the 2003 European and 2021 Pacific Northwest events as a landmark case linking a stalled high-pressure pattern to compounding heat and wildfire-smoke health risks.
The Pacific Northwest Heat Dome
Meteorological background: A historic heat dome struck the Pacific Northwest from June 25 to July 1, 2021. Lytton, British Columbia, recorded 49.6°C on June 29 — an all-time Canadian temperature record — and was largely destroyed by wildfire the very next day.
Climate context: World Weather Attribution’s rapid analysis found human-caused climate change made the event at least 8 times more likely (with a plausible range of 2 to 50 times), and made it roughly 34% larger in magnitude and 59% longer in duration than it would have been without that warming.
Official response: British Columbia’s Coroners Service confirmed 619 heat-related deaths in the province during the event window; combined US and Canadian tolls are estimated at several hundred to over a thousand depending on methodology, a range this guide does not collapse into a single disputed figure.
Public health impact: The event overwhelmed emergency medical services across Washington, Oregon and British Columbia and remains one of the deadliest weather events in modern Pacific Northwest history.
Current relevance: The single most-cited scientific attribution case connecting a specific heat dome to measurable climate-change influence, and the direct scientific reference point for discussing the 2026 Western US heat dome’s climate context.
The UK’s First Verified 40°C Day
Meteorological background: On July 19, 2022, Coningsby, Lincolnshire, reached 40.3°C — confirmed by the Met Office through full WMO-standard quality control, including physical station inspection. It was the first time 40°C had ever been officially recorded in the UK, breaking the prior record of 38.7°C set at Cambridge Botanic Garden in July 2019 by 1.6°C.
Climate context: The Met Office and independent climate scientists have both stated that such extreme UK temperatures are becoming measurably more likely as the climate warms, consistent with the broader European and global heat trend.
Official response: The UK issued its first-ever red extreme heat warning for parts of England ahead of the event; seven of 46 monitored weather stations reached or exceeded 40°C that day.
Public health impact: Widely reported strain on the NHS, transport disruption including rail speed restrictions and buckled infrastructure, and elevated mortality risk prompting the UK’s highest-level heat alert.
Current relevance: Set the precedent and system baseline for the red heat-health alerts issued again during England’s 2026 heatwave sequence.
Consecutive Years of Global Heat Records
Meteorological background: Multiple major heatwaves affected Southern Europe, North America, Asia and beyond across 2023, 2024 and 2025, with several years ranking among the warmest globally observed since instrumental records began.
Climate context: The World Meteorological Organization and national agencies have documented a consistent multi-year trend of rising global average temperatures over this period, consistent with long-term greenhouse-gas-driven warming.
Official response: Multiple countries expanded heat action plans, heat-health alert systems and adaptation funding during this period in direct response to the recurring pattern of extreme summers.
Public health impact: Widespread heat-related hospitalizations and deaths were reported across affected regions each year, reinforcing heat’s position as a leading weather-related cause of death.
Current relevance: Establishes the immediate multi-year backdrop against which the 2026 Western US and England heat events should be read — not as isolated anomalies, but as continuation of a documented recent trend.
The Western US Heat Dome and England’s Heatwave-Drought Sequence
Meteorological background: England experienced its first amber UKHSA heat-health alert of the year from May 22-27, followed by a red alert — only the second ever issued under the system — from June 24-25. A flash drought developed from record-low rainfall, and the Environment Agency formally declared drought on July 29 across seven operational areas (East Anglia, Hertfordshire and North London, Thames Valley, Hampshire and Isle of Wight, Devon and Cornwall, West Midlands, and Wessex) plus all of Wales. Separately, a heat dome intensified over the Western US from late July into early August, with forecast highs of 118°F in Phoenix, 115°F in Las Vegas and 126°F in Death Valley, and roughly 55 million people under US heat alerts at the event’s peak.
Climate context: Météo France confirmed June 23, 2026 as the hottest day recorded in France since national records began in 1947, situating the wider 2026 European heat sequence within an ongoing warming trend documented by national meteorological agencies.
Official response: The National Drought Group reconvened monthly through the English summer; in the US, the National Weather Service issued a rare “Particularly Dangerous Situation” red flag warning across central and eastern Washington, and fire officials declared a rare Level 3 of 3 “extremely critical” fire-danger rating for parts of Washington and Oregon.
Public health impact: Maricopa County, Arizona confirmed 40 heat-related deaths in 2026 through county records; a Washington Post analysis published July 26 separately counted at least 70 deaths across that month’s Western heat domes, a media tally distinct from the county’s official figure.
Current relevance: This is the most recent confirmed development as of this guide’s last update; both the English drought and the Western US heat dome remain active, developing situations tracked through official NWS, Met Office and UKHSA channels.
Ten Terms This Guide Runs On
Plain-English definitions of the concepts that recur through every section
Why Heatwaves Form
The atmospheric mechanics behind a stalled hot spell
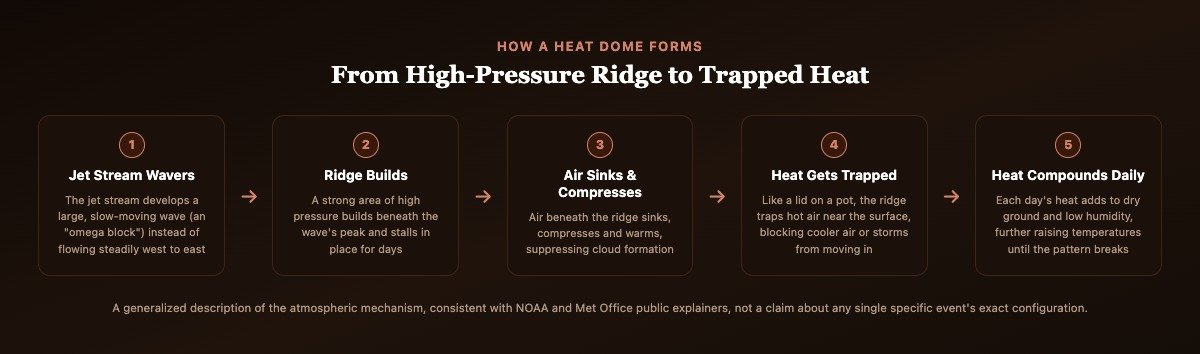
Most severe, multi-day heatwaves — including both the 2026 Western US event and the atmospheric pattern behind England’s summer — trace back to the same basic mechanism: the jet stream, the fast-moving river of air that normally steers weather systems from west to east, develops a large, slow-moving wave instead of flowing in its usual relatively straight path. Meteorologists call a particularly pronounced version of this an “omega block,” named for its resemblance to the Greek letter. Beneath the peak of that wave, a strong area of high pressure builds and, crucially, stalls in place for days rather than moving through as weather systems normally do.
Underneath a stalled high-pressure ridge, air sinks. As it sinks, it compresses and warms — the same physical principle that makes a bicycle pump warm as you compress air into a tire — while also suppressing the cloud formation that would otherwise provide some relief. The result is a self-reinforcing cycle: clear skies let in more solar radiation, dry ground (especially after weeks without rain) heats up faster than moist ground would, and each successive day’s heat compounds on the last until the blocking pattern finally breaks down and normal weather flow resumes.
Western US Climate: Built for Heat, Strained by Extremes
Why the American West is both adapted to and acutely vulnerable to dangerous heat
The Western United States has one of the most heat-adapted built environments on Earth — widespread air conditioning, building codes suited to extreme temperatures, and a population accustomed to triple-digit summers in much of the desert Southwest. That adaptation, however, has limits. Grid capacity can be strained when a heat dome pushes demand well above forecast, as utilities size their systems around expected peak loads rather than record-challenging events. Water systems across California, Nevada and Arizona already operate under long-term drought stress from a multi-decade megadrought affecting the Colorado River basin, meaning an acute heatwave arrives on top of chronic water scarcity rather than in a system with ample reserve capacity. And the region’s extensive wildland-urban interface — homes and communities built adjacent to fire-prone wildland vegetation — means heat-driven wildfire risk threatens populated areas directly, not just remote backcountry.
England’s Changing Summer Climate
A temperate climate encountering increasingly untemperate summers
England’s summer climate has historically been mild by global standards, with average July highs typically in the low-to-mid 20s Celsius and relatively rare stretches above 30°C. That history shapes nearly everything about the country’s vulnerability to heat: residential buildings are overwhelmingly designed to retain heat through the country’s long, damp winters rather than reject it during rare hot spells, and only a small minority of UK homes have air conditioning. When a heatwave like 2022’s record-breaking summer or the 2026 sequence arrives, that housing stock becomes a liability rather than a shelter, trapping heat inside overnight in a way that homes designed for hot climates are built to avoid. The 2026 season compounded this with an unusually dry spring and summer, producing the flash drought and formal drought declaration described in the timeline above — a combination of heat and water scarcity that is becoming a recognized, recurring pattern for English summers rather than an isolated anomaly.
Wildfire Risk
How heat, drought and dry vegetation combine into fire danger
Wildfire risk rises sharply when heat, low humidity, wind and dry vegetation combine — precisely the conditions a prolonged heat dome or drought produces. In 2026, fire officials issued a rare Level 3 of 3 “extremely critical” fire-danger rating for parts of Washington and Oregon, and the National Weather Service issued a “Particularly Dangerous Situation” red flag warning across central and eastern Washington — a designation reserved for only the most extreme fire-weather conditions and used sparingly by the agency. Smoke from resulting wildfires does not remain a local hazard: it can travel hundreds of miles, degrading air quality across multiple states and into Canada, adding a respiratory health burden on top of the direct heat-health risk.
🔥 Infrastructure Insight
Power grids, transport systems and healthcare services all face additional stress during prolonged heatwaves — from air-conditioning demand pushing electricity systems toward their limits, to rail lines buckling under extreme heat, to hospitals managing simultaneous heat-illness caseloads alongside their usual patient load.
Agriculture and Water Shortages
How heat and drought reach the food and water supply
Extended heat and drought reduce crop yields directly — through heat stress on plants during critical growth stages — and indirectly, by increasing irrigation demand at precisely the moment water supplies are most constrained. England’s July 2026 drought declaration arrived after Wales recorded its driest July in roughly 190 years, straining agricultural water allocations across the affected operational areas. In the Western United States, the region’s underlying multi-decade drought stress on the Colorado River system means each additional dry, hot season adds further pressure to an already strained agricultural water supply serving both irrigation and, ultimately, food prices for consumers far beyond the region itself.
🌾 Agriculture Insight
Extended heat and drought can reduce crop yields and increase irrigation demand simultaneously — a compounding effect, since the same conditions that stress crops directly also increase the water needed to keep them alive.
Electricity Demand and Grid Strain
Why extreme heat is also an energy-system stress test
Air conditioning demand rises sharply during a heatwave, and grid operators must plan for that peak demand well in advance — California’s grid operator publishes seasonal assessments each spring specifically to project the coming summer’s likely peak load under both typical and more extreme “1-in-2” and “1-in-10” scenarios. A heat dome that pushes temperatures well beyond seasonal norms, especially one arriving earlier or later in the season than the highest-demand period utilities planned around, can strain grid capacity in ways that are difficult to fully anticipate, underscoring why utilities, regulators and emergency managers treat extreme heat as an infrastructure risk, not only a public health one.
Transportation and Infrastructure
How extreme heat physically damages the systems people rely on
Extreme heat has direct physical effects on infrastructure that go beyond discomfort. Rail lines can buckle or require speed restrictions when track temperatures rise well above air temperature in direct sun, as documented during the UK’s 2022 record heat. Road surfaces can soften and rut under sustained extreme heat. Aircraft performance can be affected at very high temperatures, occasionally forcing operational restrictions at airports. None of these effects requires a record-breaking single-day temperature — sustained multi-day heat, especially heat that doesn’t cool sufficiently overnight, causes cumulative infrastructure stress that a single hot afternoon would not.
Insurance and Economic Consequences
The financial dimension of a physical hazard
Extreme heat carries measurable economic costs beyond direct health impacts: reduced agricultural output, lost labor productivity (particularly for outdoor workers whose safe working hours shrink during extreme heat), elevated healthcare utilization, and, increasingly, insurance-sector attention to heat and wildfire risk in property markets across the Western US. Insurers in fire-prone regions of California have progressively tightened availability and pricing of property coverage in high-wildfire-risk areas in recent years, a trend directly connected to the same heat-and-drought conditions this guide describes, and one likely to continue as long as the underlying risk pattern persists.
Public Health Guide: Recognizing and Preventing Heat Illness
Official CDC and UKHSA guidance on heat exhaustion, heat stroke, and who faces the highest risk
Heat exhaustion develops after days of heat exposure combined with inadequate fluid replacement, per CDC guidance. Warning signs include heavy sweating, cold, pale and clammy skin, a fast but weak pulse, nausea or vomiting, muscle cramps, tiredness or weakness, dizziness, headache, and fainting. It is serious and requires action — move to a cool place, loosen clothing, apply cool wet cloths, sip water — but is generally not immediately life-threatening if addressed promptly.
Heat stroke is the most serious heat-related illness and a medical emergency. Per CDC guidance, body temperature can rise to 103°F (39.4°C) or higher within 10 to 15 minutes; skin becomes hot, red, dry or damp to the touch; the pulse becomes fast and strong; and the person may experience headache, dizziness, nausea, confusion, or loss of consciousness. The critical distinguishing sign is that the body’s sweating mechanism often fails or becomes markedly reduced. Call emergency services immediately, move the person to a cooler location, and actively cool them with whatever methods are available — cool water, ice packs, a cool bath — while waiting for help.
Who Faces the Highest Risk
Older adults are at elevated risk because the body’s ability to detect and respond to temperature changes can diminish with age, and chronic conditions or medications common among older adults can further impair heat regulation. Infants and young children have less-developed temperature regulation and depend on caregivers to recognize danger and act. Outdoor workers — in agriculture, construction and similar fields — face direct, prolonged heat exposure often during the hottest parts of the day, making workplace heat-safety protocols and scheduled breaks essential. People with chronic illness, particularly cardiovascular and respiratory conditions, and those on certain medications, face compounded risk. People without reliable air conditioning — a much larger share of the population in England than in the American Southwest — lose the single most effective way to reduce heat exposure at home. Pets are also vulnerable and cannot communicate distress the way humans can; never leave animals in parked vehicles, ensure constant access to water and shade, and watch for excessive panting or lethargy as warning signs.
Safe Hydration and Cooling
Official guidance emphasizes drinking water regularly throughout the day rather than waiting until thirsty, avoiding alcohol and excessive caffeine during extreme heat since both can contribute to dehydration, and using cooling centres — air-conditioned public spaces such as libraries, community centers or designated emergency facilities — when home cooling is unavailable or insufficient. Local governments in both the US and UK typically publish cooling-centre locations during active heat alerts; checking your local authority’s website or calling a local information line during a heat warning is the most reliable way to find one.
Emergency Warning Systems
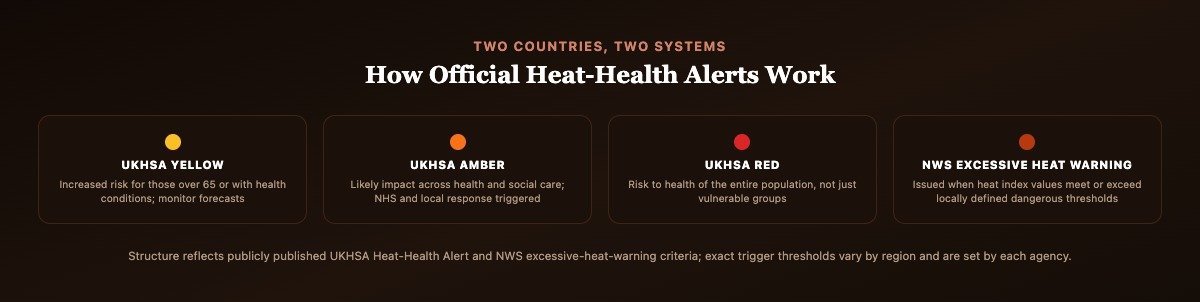
The United States relies primarily on the National Weather Service’s heat products — Heat Advisories and Excessive Heat Warnings — issued when the heat index is forecast to meet or exceed locally defined dangerous thresholds, which vary by region since a “dangerous” heat index in Seattle differs from one in Phoenix. England relies on the UK Health Security Agency’s Heat-Health Alert System, run jointly with the Met Office, using a four-level color scale — green (no alert), yellow, amber and red — with each level triggering specific guidance for health and social care services as well as the public.
✅ During a Heatwave, You Can
- Stay hydrated with water throughout the day, even before feeling thirsty
- Check on older neighbors, relatives and anyone living alone
- Use a cooling centre if home air conditioning is unavailable or insufficient
- Reschedule strenuous outdoor activity to early morning or evening hours
- Recognize heat exhaustion’s warning signs and act on them early
❌ During a Heatwave, Avoid
- Leaving children, older adults or pets in parked vehicles, even briefly
- Relying on alcohol or excessive caffeine, which can worsen dehydration
- Ignoring heat stroke warning signs, which require immediate emergency care
- Strenuous outdoor exercise during peak afternoon heat without acclimatization
- Assuming a “mild” heatwave by regional standards poses no personal risk
Comparisons: The Frameworks Behind the Headlines
Four head-to-head comparisons that explain recurring terms in heat coverage
Heatwave vs Heat Dome
Heat Exhaustion vs Heat Stroke
| Factor | Western US | England |
|---|---|---|
| Typical summer highs | 90-110°F+ in much of the Southwest | Low-to-mid 20s Celsius (upper 60s-70s°F) |
| Air conditioning prevalence | Widespread, standard in most homes | Minority of homes have AC |
| Primary compounding hazard | Wildfire and grid strain | Drought and low reservoir levels |
| 2026 official alert issued | NWS Excessive Heat Warnings | UKHSA amber and red heat-health alerts |
| Aspect | Weather | Climate |
|---|---|---|
| Timescale | Hours to days | Decades |
| Example | This week’s heat dome | The trend toward more frequent heat domes |
| Predictability | Forecast days ahead | Projected via long-term climate models and trends |
| Governing agency example | NWS, Met Office daily forecasts | IPCC, NOAA, WMO climate assessments |
| Event | Year | Region | Notable Record |
|---|---|---|---|
| Dust Bowl Heat | 1934-36 | US Great Plains | Multi-year drought and extreme heat |
| UK Heatwave | 1976 | England & Wales | Standpipes, Minister for Drought appointed |
| European Heatwave | 2003 | Western Europe | 70,000+ estimated excess deaths |
| Russian Heatwave | 2010 | Western Russia | 44°C national record, Yashkul |
| PNW Heat Dome | 2021 | US & Canada Pacific NW | 49.6°C, Lytton, BC (Canadian record) |
| UK Record Heat | 2022 | England | 40.3°C, Coningsby (first-ever UK 40°C) |
| Location | Record | Date | Source |
|---|---|---|---|
| Coningsby, UK | 40.3°C | Jul 19, 2022 | Met Office |
| Lytton, BC | 49.6°C | Jun 29, 2021 | Environment Canada |
| Yashkul, Russia | 44°C | Jul 11, 2010 | Russian meteorological service |
| Death Valley, US | 126°F forecast | Aug 2026 | National Weather Service |
| France (national) | Hottest day since 1947 records began | Jun 23, 2026 | Météo France |
| Event | Health Impact | Attributed To |
|---|---|---|
| 2003 Europe | 14,802 deaths (France) | French national health institute |
| 2010 Russia | ~56,000 estimated deaths nationally | Munich Re (insurer estimate) |
| 2021 PNW | 619 heat-related deaths in BC | BC Coroners Service |
| 2026 Western US | 40 confirmed deaths (Maricopa County) | Maricopa County official records |
| System | Level | Meaning |
|---|---|---|
| UKHSA | Yellow | Increased risk for those over 65 or with health conditions |
| UKHSA | Amber | Likely impact across health and social care services |
| UKHSA | Red | Risk to health of the entire population |
| NWS | Heat Advisory | Heat index approaching regional dangerous threshold |
| NWS | Excessive Heat Warning | Heat index meets or exceeds regional dangerous threshold, commonly ~105-115°F depending on region |
| Indicator | Recent Trend | Source |
|---|---|---|
| Global average temperature | 2023-2025 rank among warmest years observed | WMO |
| 2021 PNW heat dome likelihood | At least 8x more likely due to climate change | World Weather Attribution |
| 2021 PNW heat dome magnitude | ~34% larger, ~59% longer than without warming | World Weather Attribution |
| England 2026 rainfall | Well below expected levels, driest stretches in decades regionally | Environment Agency, Met Office |
| Category | Action |
|---|---|
| Before a heatwave | Know your local cooling-centre locations and check window/door insulation and fans or AC function |
| During a heatwave | Monitor official alerts daily, stay hydrated, check on vulnerable neighbors |
| For vulnerable household members | Confirm medication storage requirements and plan cooler-location visits for those most at risk |
| For pets | Ensure shade, water access, and never leave animals in vehicles |
| If symptoms appear | Recognize heat exhaustion vs heat stroke signs and act according to severity |
| Year | Event | Climate Significance |
|---|---|---|
| 1930s | Dust Bowl heat | Land-surface feedback amplifying natural drought heat |
| 1976 | UK heatwave | Historic benchmark for UK temperate-climate heat extremes |
| 2003 | European heatwave | First widely cited formal heat-attribution science case |
| 2010 | Russian heatwave | Blocking pattern plus warmer baseline compounding severity |
| 2021 | PNW heat dome | Clearest single-event climate-attribution figure to date |
| 2022 | UK 40°C record | First-ever verified 40°C reading in UK history |
| 2026 | Western US & England heat | Continuation of documented multi-year global heat trend |
Key Institutions to Know
The agencies whose data and warnings this guide draws on
World Meteorological Organization (WMO)
UN agency coordinating global weather, climate and water data, and the reference body for international climate reporting standards.
UK Met Office
The UK’s national weather service, responsible for official temperature records, forecasts and severe-weather warnings.
NOAA
The US National Oceanic and Atmospheric Administration, overseeing national weather, climate and ocean data and long-term climate records.
National Weather Service (NWS)
NOAA’s forecasting arm, issuing US heat advisories, excessive heat warnings and red flag fire-danger warnings.
CDC
The US Centers for Disease Control and Prevention, source of official heat-illness symptom guidance and prevention advice used throughout this guide.
UK Health Security Agency (UKHSA)
Runs England’s Heat-Health Alert System jointly with the Met Office and issues official public health guidance during heat events.
NASA
Contributes satellite-based global temperature monitoring and climate research used in assessing long-term warming trends.
IPCC
The Intergovernmental Panel on Climate Change, producing the primary scientific assessments of global climate trends and projections cited by national agencies worldwide.
Interesting Facts
- Night-time temperatures are increasingly important because they determine how well the human body can recover from daytime heat — a hot night that never cools below roughly 80°F prevents the recovery a cooler night would allow.
- The 2021 Pacific Northwest heat dome’s peak temperature, 49.6°C in Lytton, BC, was hotter than any temperature ever recorded in Las Vegas, a city built around desert heat.
- The UK’s first-ever verified 40°C reading came just three years after its previous record — a compressed timeline that surprised even Met Office scientists.
- Wales’s driest July in roughly 190 years occurred in the same summer England issued only its second-ever red heat-health alert.
- A “Particularly Dangerous Situation” red flag warning, as issued in Washington state in 2026, is a designation US fire-weather forecasters reserve for only the most extreme conditions and use rarely even in active fire seasons.
👀 Future Watch
What to track next, from official sources only: UK Met Office and UKHSA updates on any further heat-health alerts as England’s drought situation develops; NWS and NOAA seasonal outlooks for the remainder of the Western US fire season; Environment Agency updates from the National Drought Group’s monthly meetings; and any new IPCC or WMO assessments of global heat trends. This guide does not speculate about specific future temperature records or predict individual future events beyond what these agencies officially publish.
Explore More Timelines
People Also Ask
Frequently Asked Questions
100 expert questions, organized by topic
Why Preparing for Extreme Heat Matters More Than Ever
Return to the two households this guide opened with: the family in Bakersfield timing their errands around the day’s excessive heat warning, and the couple outside Birmingham checking a UKHSA alert before deciding whether to leave the house. Neither household controls the weather. What they do control — and what this guide has tried to make usable — is whether they understand the risk clearly enough to act on it: recognizing that a heat dome is a specific, describable atmospheric pattern rather than an unexplainable ordeal, knowing the difference between heat exhaustion and heat stroke well enough to act on the right one quickly, and trusting official alerts over guesswork about how hot is “too hot” for their specific home, health and circumstances.
Dangerous heat is both a short-term weather hazard and a long-term resilience challenge, and treating it as only one or the other leaves gaps. Understanding the meteorology — why a heat dome forms, why it stalls, why nights matter as much as days — turns a frightening, opaque event into something a household can plan around. Following official heat-health guidance from agencies like the CDC and UKHSA turns general awareness into specific, life-saving action. And supporting climate adaptation — better building codes, expanded cooling-centre networks, resilient power grids, and continued scientific monitoring through the WMO, NOAA, the Met Office and the IPCC — is what turns individual preparedness into collective resilience across the much longer timescale climate change operates on.
The 2026 heat events in the Western United States and England will not be the last of their kind, and this guide does not claim to know exactly when or where the next one will strike. What official science and history both make clear is that heat events resembling these two are becoming a more regular feature of summers in both regions, not a one-time anomaly. For verified updates beyond this guide’s last revision, the most reliable path runs through official National Weather Service, Met Office, UKHSA, CDC and IPCC channels — read for what they actually confirm, not for how dramatic a headline makes them sound.
Sources & further reading
Every dated entry above was checked against these references. Last reviewed 19 September 2026.
- CNN: Western US Heat Dome Brings Dangerously Hot Temperatures to Tens of Millions
- GOV.UK: UKHSA Issues Red Heat-Health Alerts Across England
- Met Office: Record Breaking Temperatures for the UK
- World Weather Attribution: Western North American Extreme Heat Virtually Impossible Without Human-Caused Climate Change
- CDC: Warning Signs and Symptoms of Heat-Related Illness