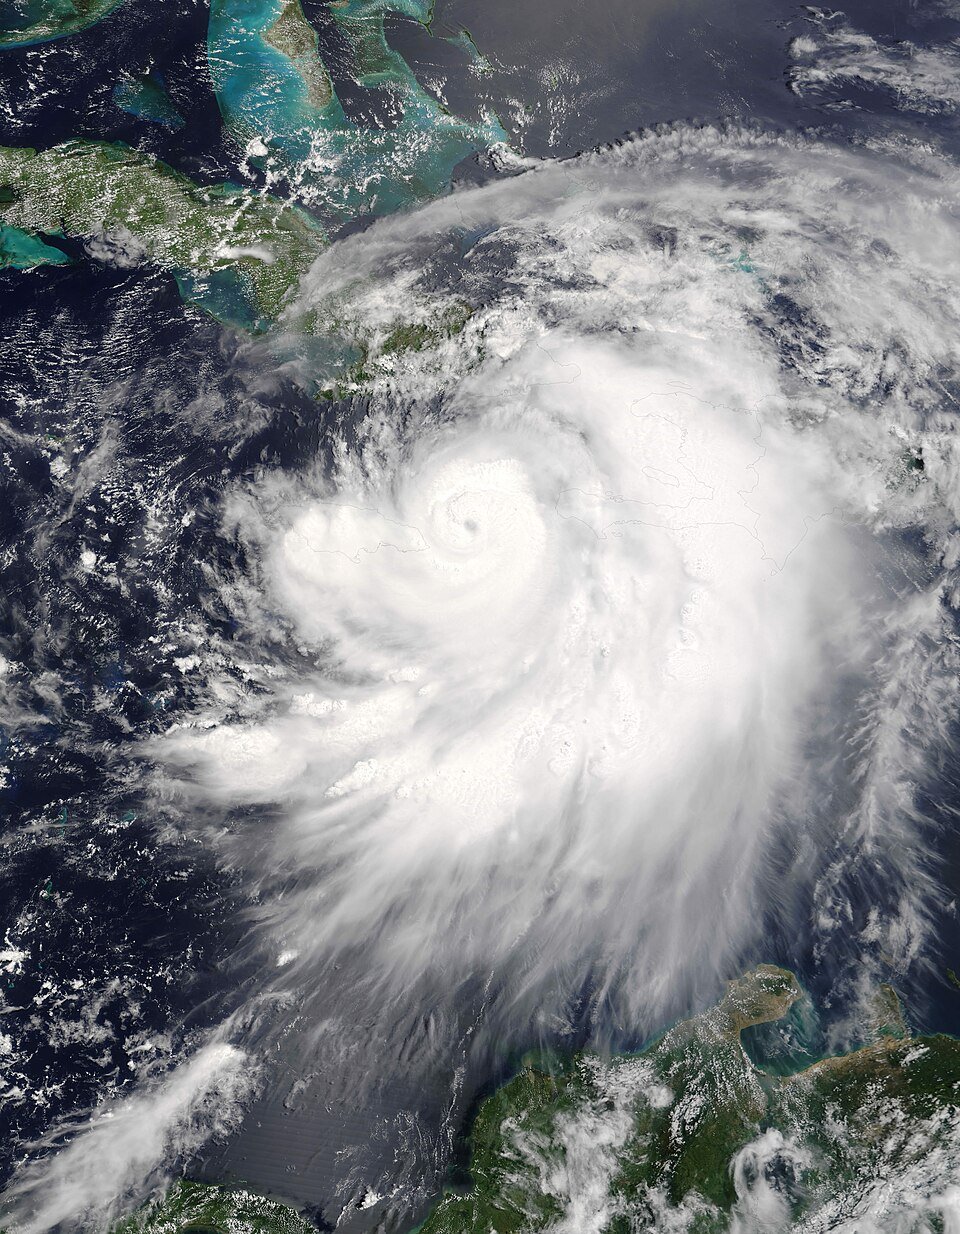
Climate Change, Hurricanes, Typhoons & Cyclones Timeline: How a Warming Planet Is Reshaping Storms
Climate change, hurricanes, typhoons and cyclones timeline: how a warming planet is reshaping tropical storms, with science and projections labelled.
Latest Story
Hurricanes, typhoons and cyclones are the same powerful storms by different names — and a warming planet is changing how they behave. This Climate Change, Hurricanes, Typhoons & Cyclones Timeline traces the science and the storms, from 19th-century observations to today’s record ocean temperatures. The clearest evidence points to more intense, wetter storms with higher surge, even as scientists remain careful about total storm frequency. Read newest first, with consensus and uncertainty clearly separated.
🌍 Climate Change & Storms Explained in 60 Seconds
Tropical cyclones draw energy from warm ocean water. As greenhouse gases warm the planet, oceans absorb most of the extra heat, giving storms more fuel and the atmosphere more moisture (about 7% more water vapour per 1°C of warming). The result, scientists find, is heavier rainfall, a higher share of the most intense storms and worse storm surge from rising seas. Whether the total number of storms is rising is still uncertain — the strongest evidence is about intensity, not count.
Key Questions Answered
What the Science Says
- Hurricanes, typhoons and cyclones are one phenomenon — tropical cyclones — named by region.
- Warmer oceans give storms more energy; a warmer atmosphere holds more moisture and rain.
- Rainfall from tropical cyclones is increasing — a well-supported finding.
- The proportion of the most intense (Category 4–5) storms is rising.
- Rising seas are making storm surge more damaging, even without stronger winds.
- Rapid intensification — storms strengthening fast — appears to be becoming more common.
- Whether the total number of storms is increasing globally remains uncertain.
- 2023 and 2024 set record ocean heat, fuelling intense storms.
- Satellites (since 1960) and agencies like NOAA, NASA and the WMO underpin modern monitoring.
- Better forecasting and early warnings have sharply reduced deaths from many storms.
Hurricanes vs Typhoons vs Cyclones
Same storm, different name by ocean basin.
| Name | Region | Ocean Basin | Season (peak) |
|---|---|---|---|
| Hurricane | North America, Caribbean | North Atlantic, NE Pacific | Jun–Nov |
| Typhoon | East & Southeast Asia | Northwest Pacific | May–Oct |
| Cyclone | India, Bangladesh, Australia | Indian Ocean, South Pacific | Apr–Dec (varies) |
Top 10 Most Important Storms in History
Storms that shaped science, policy and disaster response. Listed by significance.
Costliest US storm
Record intensity
Rain bomb
Historic toll
Delta disaster
Wind record
Modern warning win
Code reform
Infrastructure
Size record
Climate & Storms Timeline (Reverse Chronological)
From today’s record ocean heat back to the first storm observations of the 1800s.
26
Rapid Intensification & Extreme Rainfall Research
Scientific significance: New research continued to strengthen the link between warming oceans and rapid intensification, and between higher temperatures and heavier cyclone rainfall.
Climate impact: Studies reinforced that the proportion of the most intense storms is rising, and that storm rainfall is increasing in line with the warmer, moister atmosphere.
Human impact: Cities invested in adaptation — better drainage, early-warning systems and resilient infrastructure — as the focus shifted from prediction to protection.
Record Ocean Temperatures & Major Storms
Scientific significance: 2023 and 2024 set record global ocean heat, providing exceptional fuel for tropical cyclones and supporting rapid intensification.
Climate impact: Attribution studies increasingly quantified how much warming boosted specific storms’ rainfall and intensity.
Human impact: Major Atlantic and Pacific storms tested coastal defences, while record sea-surface temperatures raised concern for future seasons.
23
Hyperactive Seasons & Attribution Breakthroughs
Scientific significance: The 2020 Atlantic season set a record for named storms, and rapid-attribution science matured enough to estimate climate’s role within days of an event.
Climate impact: Studies repeatedly found warming had increased storm rainfall and the odds of extreme intensity, while frequency remained harder to attribute.
Human impact: Cyclone Amphan (2020) showed both the rising threat and the power of mass evacuation to save lives in the Bay of Bengal.
Harvey, Irma & Maria — A Brutal Season
Scientific significance: Hurricane Harvey dropped about 60 inches of rain on Texas, and landmark attribution studies estimated climate change increased its rainfall by roughly 15–38%.
Climate impact: Irma sustained Category 5 winds for a record period, while Maria devastated Puerto Rico, exposing infrastructure fragility.
Human impact: Maria’s death toll, later estimated near 3,000, highlighted how recovery failures can be deadlier than the storm itself.
Hurricane Katrina — A Turning Point
Scientific significance: Katrina demonstrated catastrophic storm-surge risk for low-lying cities and intensified scientific and public debate about hurricanes and climate.
Climate impact: It underscored how surge, sea level and intensity combine to threaten coasts, even if any single storm cannot be blamed solely on warming.
Human impact: About 1,800 people died and a major US city was nearly destroyed after levees failed, reshaping disaster policy.
Hurricane Andrew — Building Codes Transformed
Scientific significance: Andrew’s Category 5 landfall showed how extreme winds destroy poorly built structures, driving major engineering reforms.
Climate impact: It highlighted the importance of preparing infrastructure for the strongest storms, regardless of frequency trends.
Human impact: Florida overhauled its building codes and the insurance industry was reshaped after roughly $27 billion in damage.
The IPCC Is Established
Scientific significance: The Intergovernmental Panel on Climate Change (IPCC) was created in 1988 by the WMO and UN Environment Programme to assess climate science, including extreme weather.
Climate impact: IPCC assessments became the authoritative synthesis of what is known — and uncertain — about climate change and tropical cyclones.
Human impact: Its reports shaped global policy, adaptation planning and public understanding of storm risk.
80s
The Satellite Era Expands
Scientific significance: Weather satellites made it possible to detect and track every tropical cyclone worldwide, transforming forecasting and the historical record.
Climate impact: Consistent satellite data later allowed scientists to study trends in storm intensity with far greater confidence.
Human impact: Earlier detection and warnings began to cut death tolls, especially for vulnerable coastal regions.
Modern Hurricane Forecasting Begins
Scientific significance: The first weather satellite, TIROS-1, launched in 1960, and early computer models began to make storm-track forecasting scientific rather than guesswork.
Climate impact: The foundations of systematic storm observation were laid, enabling later climate trend analysis.
Human impact: Coastal communities gained earlier warnings, the first step toward today’s life-saving forecasts.
50
Major Historical Cyclones
Scientific significance: The 1900 Galveston hurricane killed an estimated 8,000 people, the deadliest US natural disaster, exposing how little warning then existed.
Climate impact: Records from this era are incomplete, which is one reason long-term frequency trends are hard to establish.
Human impact: Catastrophic tolls drove the creation of dedicated weather services and warning networks.
Early Storm Observations
Scientific significance: In the 19th century, scientists like William Redfield began to understand cyclones as rotating systems, founding tropical-storm meteorology.
Climate impact: These early, region-limited observations form the oldest end of the storm record, before global or satellite data existed.
Human impact: Ship and coastal logs slowly built the knowledge that would one day enable forecasting and warnings.
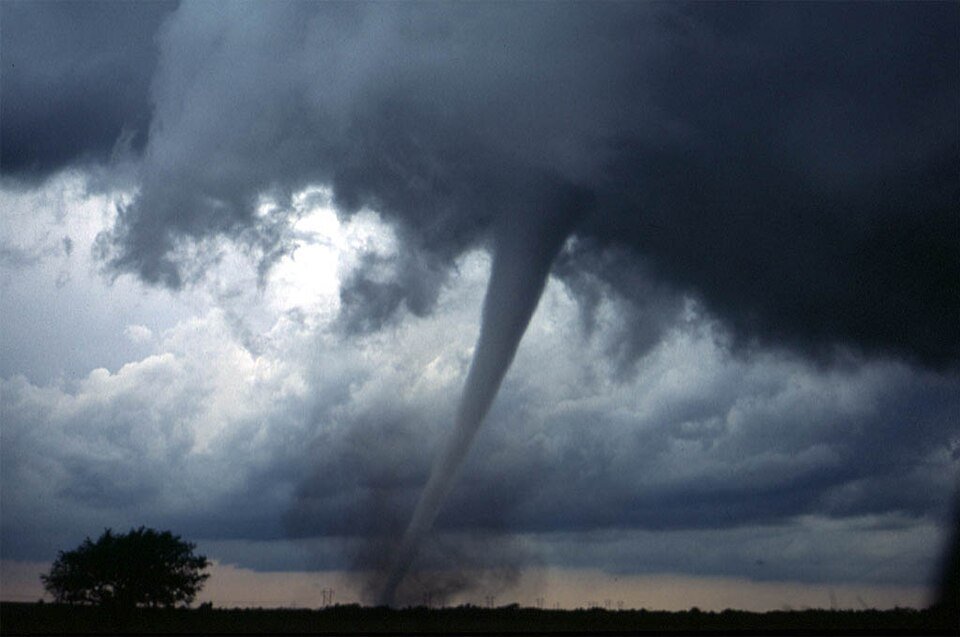
Climate Science: What We Know vs What We Don’t
Separating established consensus from emerging research, uncertainty and projection.
✅ Established Consensus
- Warmer oceans generally support more intense storms.
- Tropical-cyclone rainfall is increasing.
- Sea-level rise is worsening storm surge.
- The atmosphere holds ~7% more moisture per 1°C of warming.
🔬 Emerging Research
- Rapid intensification appears to be becoming more common.
- Storms may be intensifying closer to coastlines.
- Some basins may see poleward shifts in peak intensity.
- Attribution science can now quantify warming’s role per storm.
❓ Key Uncertainties
- Whether total global storm numbers are rising.
- Regional frequency trends vary and are hard to confirm.
- Short, inconsistent historical records limit conclusions.
- Natural variability (e.g. El Niño) complicates trends.
🔮 Future Projections
- A higher proportion of Category 4–5 storms is projected.
- Heavier rainfall and worse flooding are expected.
- Higher seas will keep increasing surge damage.
- Total storm frequency may stay flat or even decrease.
The Science, Simply Explained
Ocean Warming
Oceans absorb more than 90% of the extra heat trapped by greenhouse gases. Warmer surface water gives tropical cyclones more energy, the fundamental fuel for stronger storms.
Sea-Level Rise
As oceans warm and ice melts, sea levels rise. Higher baseline seas mean storm surge starts from a higher point, pushing water further inland and causing more flooding.
Storm Surge
Storm surge is the wall of seawater a cyclone pushes ashore. It is often the deadliest part of a storm, and rising seas make each surge more destructive than the same storm would have been decades ago.
Atmospheric Moisture
A warmer atmosphere holds roughly 7% more water vapour per 1°C of warming (the Clausius–Clapeyron relationship). That extra moisture falls as heavier rain, increasing flood risk.
Rapid Intensification
Rapid intensification is when a storm’s winds increase by at least 35 mph in 24 hours. Warm, deep ocean heat makes it more likely, and it is dangerous because it gives communities little time to prepare.
Wind Shear
Wind shear — a change in wind speed or direction with height — can tear storms apart. How climate change alters shear in different basins is one reason frequency trends are uncertain.
Cyclone Formation
Tropical cyclones form over warm ocean water (usually above 26°C) with moist air and low wind shear. The Earth’s rotation sets them spinning, and warm water sustains them.
The Organisations Behind Storm & Climate Science
World Meteorological Organization (WMO)
The UN body that coordinates global weather and climate observation, names tropical cyclones in many basins and sets international standards for storm monitoring and warnings.
NOAA
The US National Oceanic and Atmospheric Administration runs the National Hurricane Center, tracks Atlantic and Pacific storms, and provides forecasts, warnings and long-term ocean and climate data.
NASA
NASA operates satellites that observe storms, sea-surface temperature, sea level and atmospheric moisture, supplying critical data for both forecasting and climate research.
IPCC
The Intergovernmental Panel on Climate Change assesses the peer-reviewed evidence on climate and extreme weather, producing the authoritative reports that summarise consensus and uncertainty.
Case Studies
Case Study 1 — Hurricane Katrina (2005)
Background: A Category 5 storm that struck the US Gulf Coast. Climate factors: warm Gulf waters and storm surge against a low-lying, below-sea-level city. Human consequences: ~1,800 deaths and New Orleans flooded after levee failures. Lesson: infrastructure and surge defences matter as much as the storm itself.
Case Study 2 — Hurricane Harvey (2017)
Background: Stalled over Houston, dumping ~60 inches of rain. Climate factors: a warmer, wetter atmosphere; attribution studies estimated a 15–38% rainfall increase from warming. Human consequences: catastrophic urban flooding and ~$125B in damage. Lesson: rainfall, not just wind, is a defining climate-era hazard.
Case Study 3 — Typhoon Haiyan (2013)
Background: One of the strongest landfalls ever, striking the Philippines. Climate factors: very warm western Pacific waters and extreme storm surge. Human consequences: ~6,300 deaths, with Tacloban devastated. Lesson: surge-prone coasts need evacuation and resilient shelters.
Case Study 4 — Cyclone Nargis (2008)
Background: Struck Myanmar’s Irrawaddy delta. Climate factors: surge funnelled into a densely populated, low-lying delta. Human consequences: ~138,000 deaths, worsened by limited warnings. Lesson: early-warning systems and open communication save lives.
Case Study 5 — Cyclone Amphan (2020)
Background: A powerful Bay of Bengal cyclone hitting India and Bangladesh. Climate factors: record-warm bay waters drove rapid intensification. Human consequences: ~$13B in damage but far fewer deaths than past cyclones. Lesson: mass evacuation and modern warnings dramatically cut casualties.
Data Tables
| Deadliest Tropical Cyclones | Year | Region | Est. Deaths |
|---|---|---|---|
| Bhola Cyclone | 1970 | Bangladesh | ~300,000–500,000 |
| Coringa Cyclone | 1839 | India | ~300,000 |
| Haiphong Typhoon | 1881 | Vietnam | ~300,000 |
| Cyclone Nargis | 2008 | Myanmar | ~138,000 |
| Galveston Hurricane | 1900 | USA | ~8,000 |
| Costliest Hurricanes | Year | Est. Damage |
|---|---|---|
| Hurricane Katrina | 2005 | ~$125–186 billion |
| Hurricane Harvey | 2017 | ~$125 billion |
| Hurricane Ian | 2022 | ~$112 billion |
| Hurricane Maria | 2017 | ~$90 billion |
| Hurricane Sandy | 2012 | ~$70 billion |
| Strongest Recorded | Year | Record |
|---|---|---|
| Typhoon Tip | 1979 | Lowest pressure: 870 hPa; largest |
| Hurricane Patricia | 2015 | Highest winds: ~215 mph |
| Typhoon Haiyan | 2013 | Among strongest landfalls (~195 mph) |
| Hurricane Allen | 1980 | ~190 mph Atlantic winds |
| Major Climate Finding | Confidence |
|---|---|
| Tropical-cyclone rainfall is increasing | High |
| Higher proportion of Cat 4–5 storms | Medium–High |
| Sea-level rise worsens storm surge | High |
| Rapid intensification becoming more common | Medium |
| Total global storm frequency increasing | Low / uncertain |
| Ocean Temperature | Effect on Storms |
|---|---|
| Below ~26°C | Tropical cyclones rarely form or sustain |
| ~26–28°C | Storms can form; moderate intensity potential |
| Above ~28°C | Higher potential intensity, more rapid intensification |
| Record warm (2023–24) | Exceptional fuel for the strongest storms |
Records, Breakthroughs & Success Stories
Notable Facts in Storm Science
- Most destructive: Hurricane Katrina (2005) remains among the costliest storms ever, at over $125 billion.
- Fastest spin-up: Hurricane Patricia (2015) intensified explosively to ~215 mph winds, the strongest in the Western Hemisphere.
- Record season: the 2020 Atlantic season produced so many storms that forecasters ran out of names.
- Forecasting leap: hurricane track forecasts are several times more accurate today than in the 1990s.
- Adaptation win: Bangladesh and India cut cyclone deaths dramatically through shelters and mass evacuation — Amphan (2020) killed far fewer than Bhola (1970).
- Surge danger: storm surge, not wind, causes most tropical-cyclone deaths historically.
Explore More Timelines
Frequently Asked Questions
People Also Ask
Explore More Timelines
⚠️ Editorial & Scientific Note
This article is based on the scientific consensus summarised by bodies such as the IPCC, NOAA, NASA and the WMO. It distinguishes established findings from emerging research and uncertainties. Storm statistics are approximate and drawn from official records; estimates vary between sources. This is educational information, not emergency guidance — always follow official warnings during a storm.
Sources & further reading
Every dated entry above was checked against these references. Last reviewed 15 September 2026.