Earth Day: Pledges Met and Lapsed – An AiTimeline Review
Which Earth Day pledges worked? A 1970-2026 scorecard: Montreal Protocol, Kyoto, Paris, India's climate targets, net zero, plastics and the emissions gap.
Latest Story
Every Earth Day brings a new promise: plant more trees, cut emissions, ban plastic, reach net zero. Fifty-six years after the first one, a better question than “did the world promise to save the planet?” is which Earth Day pledges actually changed the numbers. This review scores 14 of them, from the Clean Air Act and the Montreal Protocol to Paris and India’s own climate targets, against the latest official data.
💡 Short Answer
Earth Day’s clearest wins are the ones with a specific target and enforcement: US air pollution is down 79% since 1970, and the Montreal Protocol has put the ozone layer on track to recover by about 2040-2066. India met its 50% clean-power capacity goal five years early. But the Paris temperature goals are off track, with pledges pointing to 2.3-2.5°C, and pledges on forests, methane and plastics have lapsed.
Earth Day Pledges: Key Questions
56 Years of Earth Day in Ten Points
- Protest to law: the EPA and the Clean Air Act both came within months of the first Earth Day in 1970.
- Air: US emissions of six common pollutants are down 79% since 1970, while GDP grew 338%.
- Ozone: the Montreal Protocol is the clearest global win; recovery is expected by about 2040-2066.
- Kyoto: the countries bound by it complied, but it covered too little of the world to bend global emissions.
- Paris: pledges point to 2.3-2.5°C and current policies to 2.8°C; the US left in January 2026.
- Record emissions: 57.7 billion tonnes of CO₂e in 2024, up 2.3%.
- India’s early win: 50% non-fossil power capacity in June 2025, five years early.
- Capacity is not generation: non-fossil sources made 29.2% of India’s electricity in 2025-26.
- New targets: India’s 2035 plan raises the bar to 60% clean capacity and a 47% intensity cut.
- Lapsed: Aichi biodiversity targets, the plastics treaty deadline, and (so far) forests and methane.
Did the planet get the promise? Filter 14 pledges by status.
Each card shows the promise, its deadline, the number used to judge it and the latest measured result. The status is our reading of that evidence. Paris is judged on the collective path, not any one country.
Showing all 14 pledges.
Montreal Protocol: save the ozone layer
- Deadline
- 1987; phase-outs by 1996-2030
- Metric
- Ozone levels vs 1980
- Latest
- Recovery by about 2040 (2066 over Antarctica); 2025 hole 5th-smallest since 1992
- Still open
- Keep compliance; watch illegal CFC production
US Clean Air Act 1970: cut air pollution
- Deadline
- Standards and deadlines from 1970
- Metric
- Emissions of six common pollutants
- Latest
- Down 79% from 1970 to 2024 while GDP grew 338%
- Still open
- Ozone and fine particles still exceed limits in some areas
India: 50% non-fossil power capacity
- Deadline
- 2030
- Metric
- Share of installed capacity
- Latest
- Crossed in June 2025; 54.18% by June 2026
- Still open
- Generation share only 29.2%; storage and grid
India: cut emissions intensity 45% from 2005
- Deadline
- 2030 (new: 47% by 2035)
- Metric
- Emissions per unit of GDP
- Latest
- 36% by 2020, the latest official figure
- Still open
- Total emissions still rising
India: 2.5-3 billion tonne carbon sink
- Deadline
- 2030 (new: 3.5-4 bn by 2035)
- Metric
- Extra CO2 stored in forests and trees
- Latest
- 2.29 billion tonnes by 2021
- Still open
- Permanence, survival and measurement
India: 500 GW non-fossil capacity
- Deadline
- 2030
- Metric
- Installed GW
- Latest
- 300.50 GW on 31 July 2026
- Still open
- About 200 GW more in four years
Kyoto Protocol: 5% below 1990
- Deadline
- 2008-2012
- Metric
- Emissions of countries with targets
- Latest
- Participants complied; US never ratified, Canada left
- Still open
- Global emissions kept rising
Biodiversity: protect 30% of land and sea
- Deadline
- 2030
- Metric
- Area protected
- Latest
- 17.6% of land, 8.4% of ocean (2024)
- Still open
- Aichi 2020 targets all missed
Paris: well below 2 C, aim for 1.5 C
- Deadline
- This century
- Metric
- Projected warming
- Latest
- 2.3-2.5 C if pledges delivered; 2.8 C on current policies
- Still open
- US left in January 2026
Glasgow: end deforestation
- Deadline
- 2030
- Metric
- Forest lost per year
- Latest
- 8.1 million ha in 2024, 63% above the path
- Still open
- Fires and farming frontiers
Global Methane Pledge: cut 30%
- Deadline
- 2030 vs 2020
- Metric
- Methane emissions
- Latest
- Plans deliver about 8%; emissions still rising
- Still open
- Farming, oil and gas, waste
A global plastics treaty
- Deadline
- Agreed to by end-2024
- Metric
- A signed treaty
- Latest
- No deal in 2024 or 2025; talks restarted in 2026
- Still open
- Production limits vs waste focus
India: net zero
- Deadline
- 2070
- Metric
- Net emissions
- Latest
- Interim targets for 2030 and 2035 set
- Still open
- Coal’s share of generation
Net zero pledges worldwide
- Deadline
- Mostly 2050-2070
- Metric
- Net emissions
- Latest
- Judged only through interim milestones
- Still open
- Credibility of 2030 steps
What Worked: Clean Air and the Ozone Layer
Two promises that changed the numbers, and why.
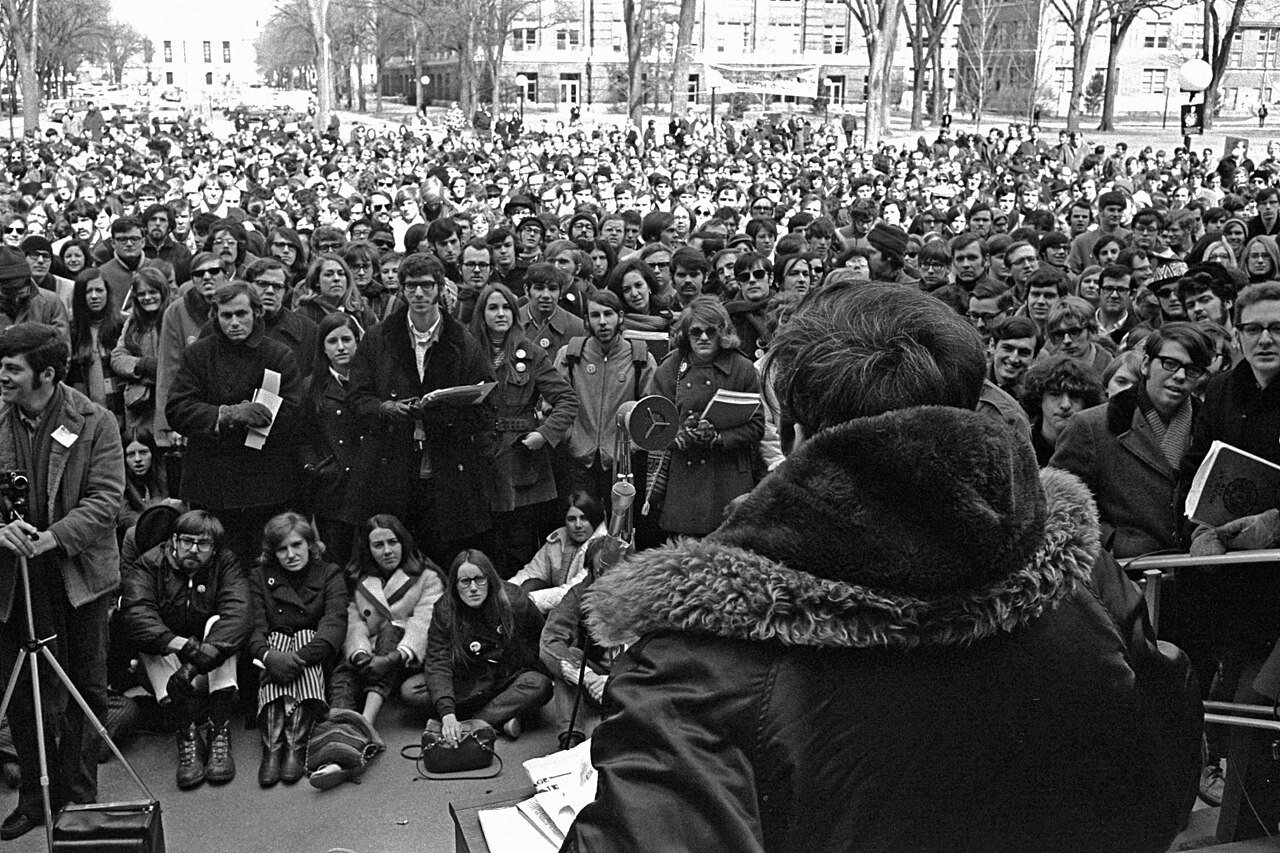
The first Earth Day, on 22 April 1970, was a protest. What made it matter was what came next. The US Environmental Protection Agency opened on 2 December 1970, and on 31 December President Nixon signed the Clean Air Act of 1970, which set national air quality standards and deadlines for meeting them. The Clean Water Act followed in 1972.
Fifty-four years later, the EPA’s own trend data shows combined emissions of the six common air pollutants (particles, sulphur dioxide, nitrogen oxides, volatile organic compounds, carbon monoxide and lead) down 79% between 1970 and 2024, while the US economy grew 338%. That is the answer to the claim that pollution rules must wreck growth. It was not automatic: it took law, standards, monitoring, enforcement, new technology and investment, in that order.
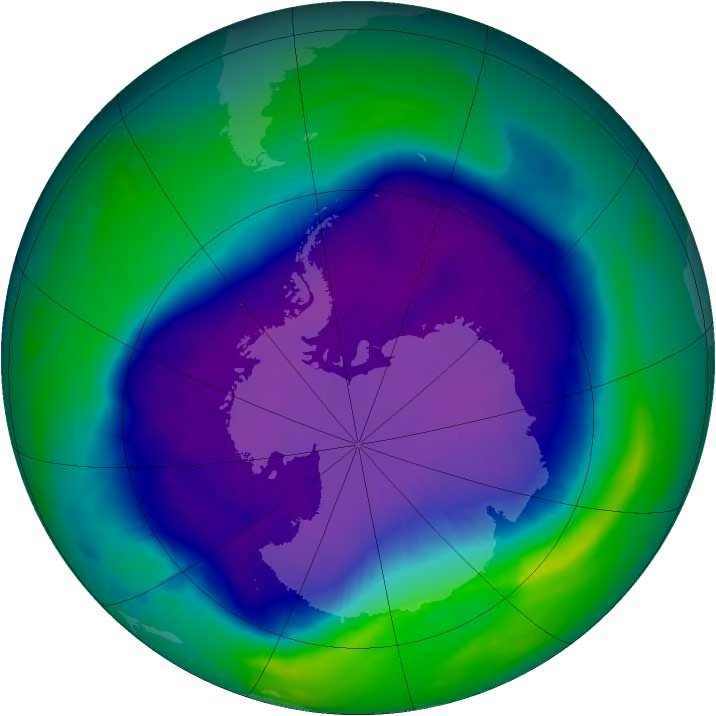
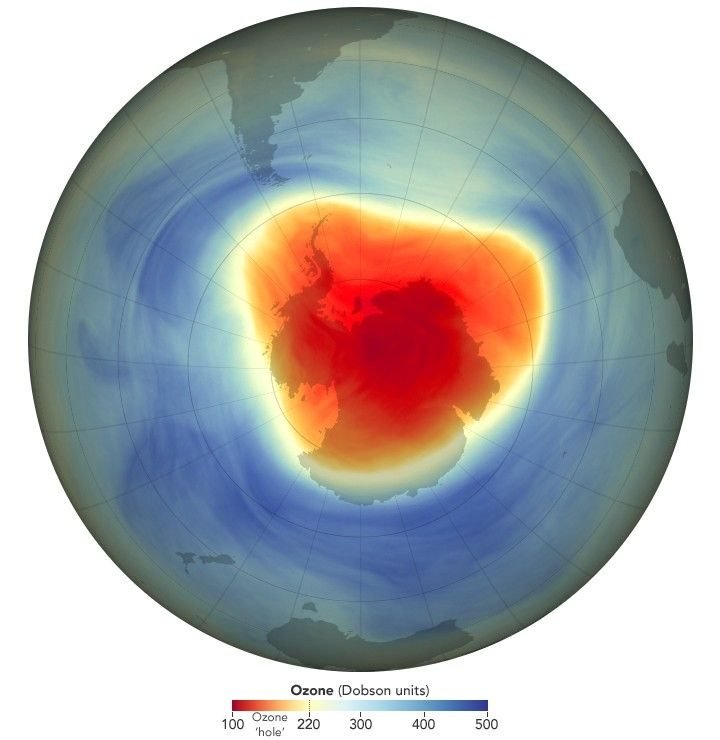
The ozone story is even cleaner. British scientists reported the Antarctic ozone hole in 1985. Two years later, on 16 September 1987, countries adopted the Montreal Protocol. It named the chemicals (CFCs, halons and others), set dates to cut them, created a fund to pay poorer countries to switch, and was tightened again and again as the science improved. In 2009 it became the first UN treaty ratified by every country.
The 2023 scientific assessment backed by UNEP, WMO, NASA, NOAA and the EU projects the ozone layer returning to 1980 values by about 2040 for most of the world, 2045 over the Arctic and 2066 over Antarctica. The 2025 Antarctic hole was the fifth-smallest since 1992. The 2026 hole opened larger than average, but Copernicus put that down to a cold stratosphere, with other measures close to normal. Because CFCs are also greenhouse gases, the phase-out avoided an estimated 135 billion tonnes of CO₂-equivalent between 1990 and 2010. The 2016 Kigali Amendment now phases down HFCs, the replacements that turned out to warm the climate.
What Fell Short: From Kyoto to the Paris Gap
Climate change is tied to electricity, transport, farming, cement, steel and growth itself.
Climate was always going to be harder than ozone. At the 1992 Rio Earth Summit, countries signed the UN climate convention, but carbon dioxide comes from almost every part of the economy, not from a short list of chemicals with ready replacements.
The Kyoto Protocol of 1997 was the first attempt at binding targets: industrialised countries would cut emissions to an average of 5% below 1990 levels in 2008-2012. On its own terms it largely worked, since the 36 countries that took part fully complied, some by buying reductions abroad. But the United States signed and never ratified, Canada announced its withdrawal in 2011, and China, India and other growing economies had no binding cuts. Global emissions kept rising.
The Paris Agreement of December 2015 turned the model around. Every country writes its own pledge, a Nationally Determined Contribution, and is expected to strengthen it every five years. The collective goal is to hold warming well below 2°C and pursue 1.5°C.
A decade later, UNEP’s Emissions Gap Report 2025, titled “Off Target”, measures how far apart the promises and the path are. If every NDC is fully delivered, warming this century is projected at 2.3-2.5°C. On current policies it is about 2.8°C. Global emissions rose 2.3% in 2024 to a record 57.7 billion tonnes. To stay on a 1.5°C path, emissions in 2035 would need to be about 55% below 2019 levels; for 2°C, about 35% lower. By 30 September 2025, only 60 parties, covering 63% of emissions, had filed their 2035 targets.
2024 was the first calendar year more than 1.5°C warmer than pre-industrial times, at about 1.55°C; the WMO puts 2023-2025 at 1.48°C on average. A single hot year is not a breach of the Paris goal, which is about long-term warming, but it shows how little margin is left. Then the world’s second-largest emitter left: the US exit from Paris took effect on 27 January 2026, and in February the EPA rescinded the 2009 “endangerment finding” that underpins US vehicle climate rules. Both are being fought in court and in politics. The verdict here is on the collective path, not on any one country.
The Glasgow Pledges at Halfway
Forests and methane: two 2030 promises from COP26.
At COP26 in November 2021, leaders promised to halt deforestation by 2030 and, through the Global Methane Pledge, to cut methane 30% from 2020 levels. The 2025 Forest Declaration Assessment found 8.1 million hectares of forest lost in 2024, when the path to zero allowed about 5 million. For methane, a UNEP report at COP30 found current national plans would deliver only about 8%, with emissions still rising. India did not sign the methane pledge.
India’s Climate Targets: Met, Moving and Raised
India is one of the few large economies to have met NDC targets early. The new 2035 plan raises all three.
| Target | First NDC (2015) | Updated NDC (2022) | New NDC (2026) | Latest official |
|---|---|---|---|---|
| Emissions intensity of GDP (vs 2005) | 33-35% by 2030 | 45% by 2030 | 47% by 2035 | 36% by 2020 |
| Non-fossil share of power capacity | 40% by 2030 | About 50% by 2030 | 60% by 2035 | 54.18% (Jun 2026) |
| Additional carbon sink (vs 2005) | 2.5-3 bn t by 2030 | 2.5-3 bn t by 2030 | 3.5-4 bn t by 2035 | 2.29 bn t by 2021 |
| Long-term goal | — | Net zero by 2070 (announced 2021) | Net zero by 2070 | — |
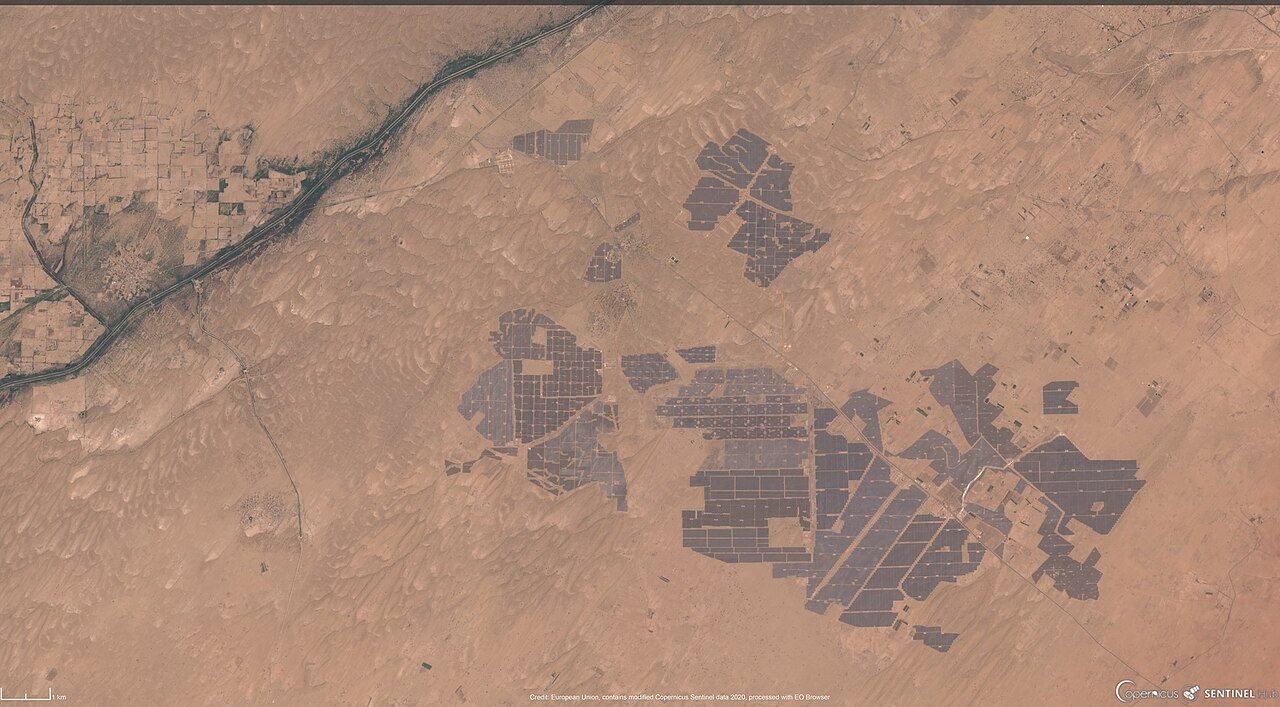
Clean power capacity: met early. India’s 2015 pledge of 40% non-fossil capacity was reached in 2021. The updated goal of about 50% by 2030 was crossed in June 2025, with 242.78 GW of 484.82 GW. By 30 June 2026 the share was 54.18%, and by 31 July MNRE counted 300.50 GW of non-fossil capacity, about 60% of the separate 500 GW goal for 2030. India added a record 55.3 GW in 2025-26.
But capacity is not generation. A solar park produces only when the sun shines. In 2025-26, non-fossil sources generated 29.2% of India’s electricity (538.97 of 1,845.92 billion units), and coal most of the rest. Closing that gap takes storage, transmission and a grid that can handle variable power, not just more panels.
Emissions intensity: in progress. The first target, a 33-35% cut by 2030, was met in 2019. The government’s latest official figure is a 36% cut between 2005 and 2020, against the updated 45% goal for 2030. This is an intensity target: emissions per unit of GDP. India’s economy can grow and its total emissions can rise while intensity falls, and that is what has happened.
Carbon sink: in progress. India aims to store an extra 2.5-3 billion tonnes of CO₂-equivalent in forests and trees by 2030, compared with 2005. The government says 2.29 billion tonnes had been added by 2021. Forest carbon is hard to count: it depends on tree survival, age, soil and whether the land stays forest.
Net zero by 2070: too early to judge. Announced in Glasgow in 2021, it can only be tested through interim steps. The first of those is the 2035 NDC, approved by the Cabinet on 25 March 2026 and filed with the UN in April: 60% clean capacity, a 47% intensity cut and a 3.5-4 billion tonne sink.
Pick a promise, then drag the slider to the present.
Drag right.
The Full Timeline: From the First Earth Day to 2026
Newest first. Entries tagged 2026 are this year’s developments.
Ozone hole opens large, plastics talks restart2026
Copernicus reports the 2026 Antarctic ozone hole at about 25 million sq km on 12 September, some 5 million above average, because of an unusually cold stratosphere. It calls this weather-driven variability, not a reversal. The new chair of the plastics treaty talks prepares an “aid to negotiations” to restart work after two failed sessions.
India passes 300 GW of non-fossil capacity2026
MNRE reports 300.50 GW of non-fossil capacity: 164.59 GW solar, 58.14 GW wind, 57.24 GW hydro, 11.75 GW bio-power and 8.78 GW nuclear. On 30 June, Central Electricity Authority data put the non-fossil share of capacity at 54.18%.
India files its 2035 climate plan2026
India’s NDC for 2031-35 raises three targets: 60% non-fossil power capacity, a 47% cut in emissions intensity from 2005, and a 3.5-4 billion tonne carbon sink, all by 2035. India had been one of the last G20 members to file. Earth Day on 22 April runs under the theme “Our Power, Our Planet”.
The US repeals its legal basis for climate rules2026
The EPA rescinds the 2009 endangerment finding and all greenhouse gas standards for cars and trucks. It is the biggest rollback of a US climate commitment since the first Earth Day made the EPA possible.
US exit from Paris takes effect2026
A year after President Trump gave notice, the United States leaves the Paris Agreement. Weeks earlier he also announced withdrawal from the UN climate convention and the IPCC. UNEP had estimated the US exit alone would add about 0.1 degrees C to projected warming.
Emissions Gap Report: ‘Off Target’
UNEP projects 2.3-2.5 degrees C if all pledges are delivered and 2.8 degrees C under current policies. Emissions rose 2.3% in 2024 to 57.7 billion tonnes. At COP30, countries agree to triple adaptation finance by 2035, but a fossil-fuel roadmap is kept out of the text.
India reaches 50% clean capacity early
Non-fossil sources pass half of India’s installed electricity capacity, five years before the 2030 deadline. But in 2025-26 they generated 29.2% of the power actually used.
Plastics treaty talks fail again
After a failed session in Busan in late 2024, a second attempt in Geneva ends without a treaty, split between countries wanting limits on plastic production and petrochemical producers who want a focus on waste.
First year above 1.5 degrees C
2024 becomes the first calendar year more than 1.5 degrees C above pre-industrial levels. It does not by itself breach the Paris goal, which is measured over decades, but it shows how little room is left.
Biodiversity gets a new deadline
With the 2020 Aichi targets missed, countries at the UN biodiversity summit (COP15) agree to protect 30% of land and ocean by 2030. By 2024, 17.6% of land and 8.4% of ocean are protected. India’s single-use plastic ban on 19 items took effect on 1 July 2022.
Glasgow: net zero, forests and methane
India announces net zero by 2070 and 500 GW of non-fossil capacity by 2030. Leaders pledge to end deforestation by 2030, and more than 100 countries join the Global Methane Pledge to cut methane 30% by 2030. India does not sign the methane pledge.
The Paris Agreement
Almost every country agrees to hold warming well below 2 degrees C and try for 1.5 degrees C, each through its own pledge. India’s first NDC promises a 33-35% cut in emissions intensity and 40% non-fossil capacity by 2030. It reaches both early, in 2019 and 2021.
Montreal becomes universal
The ozone treaty becomes the first in UN history with universal ratification. In 2016 the Kigali Amendment extends it to HFCs, the climate-warming gases that replaced CFCs.
Kyoto’s first commitment period
The 36 countries that take part fully all comply, some by buying reductions abroad. But the US never ratified, Canada announces its withdrawal in December 2011, and fast-growing economies have no binding cuts. Global emissions keep climbing.
The Kyoto Protocol is adopted
The first treaty with legally binding greenhouse gas targets for industrialised countries and the European Community.
The Rio Earth Summit
The UN climate convention (UNFCCC) and the Convention on Biological Diversity open for signature. Climate change is now tied to energy, farming, industry and growth, not a single group of chemicals.
1990
Earth Day goes global
Twenty years on, Earth Day becomes a worldwide event. The problems it now faces, from acid rain to CFCs to carbon dioxide, cross borders.
The Montreal Protocol
Two years after British scientists published the discovery of the Antarctic ozone hole, countries agree to phase out CFCs and other ozone-depleting chemicals. The treaty is strengthened repeatedly as the science improves.
From protest to law
Within months of the first Earth Day, the US creates the Environmental Protection Agency and passes the Clean Air Act of 1970, with national air quality standards and deadlines. The Clean Water Act follows in October 1972.
1970
The first Earth Day
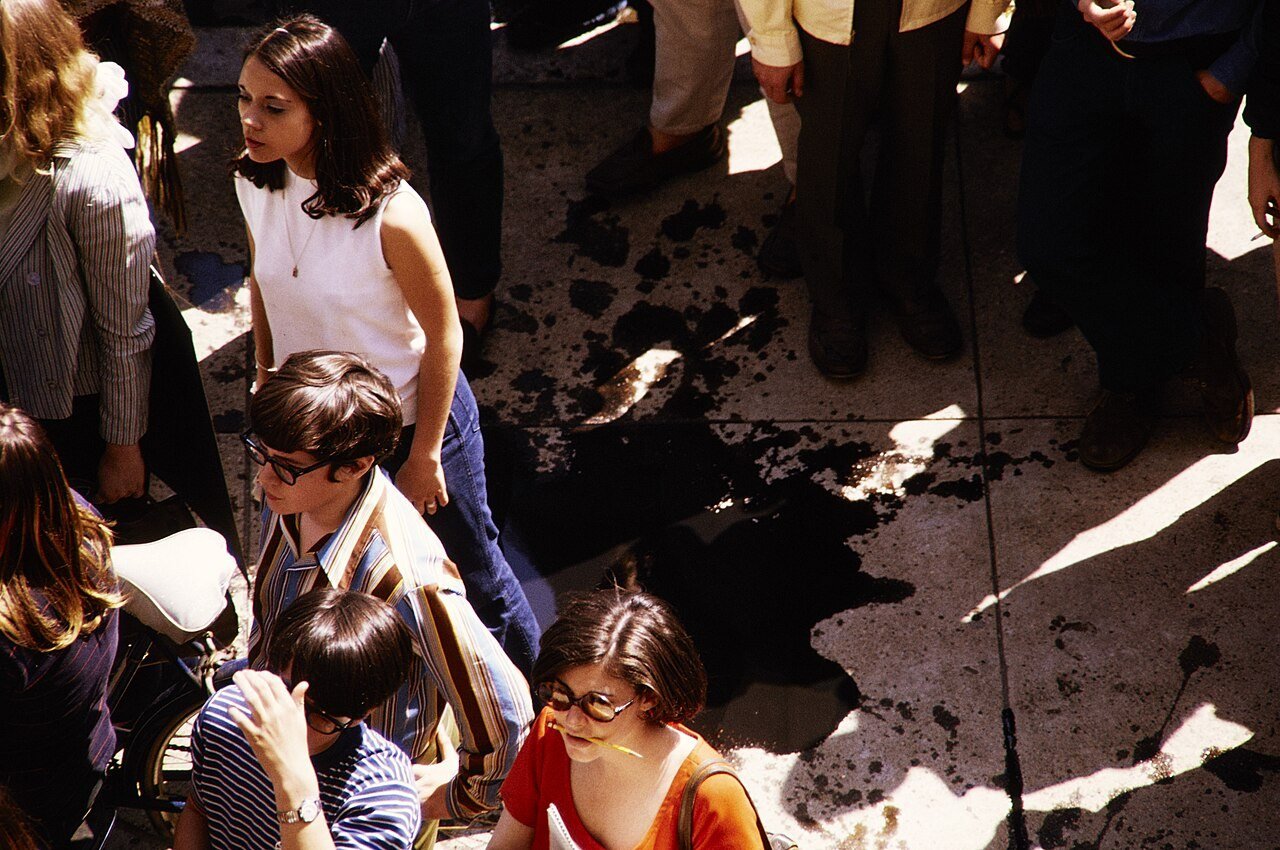
Organised by Senator Gaylord Nelson with national coordinator Denis Hayes, the first Earth Day brings together students, unions and conservationists over smog, oil spills, pesticides and polluted rivers.
The Earth Day Promise Ledger
13 promises, their ambition and the latest measured result.
| Promise | Ambition | What happened | Status |
|---|---|---|---|
| Clean air (US, 1970) | Cut dangerous air pollution | Six common pollutants down 79% since 1970 | Met / progress |
| Montreal Protocol (1987) | Phase out ozone-depleting chemicals | Ozone recovery on track for 2040-2066 | On track |
| Kyoto Protocol (1997) | Industrial countries 5% below 1990 | Participants complied; global emissions rose | Mixed |
| Aichi targets (2010) | 20 biodiversity targets by 2020 | None fully met | Lapsed |
| Paris Agreement (2015) | Well below 2 C, pursue 1.5 C | 2.3-2.5 C with pledges, 2.8 C on policies | Off track |
| Glasgow forests (2021) | End deforestation by 2030 | 8.1 m ha lost in 2024 | Off track |
| Global Methane Pledge (2021) | 30% cut by 2030 | About 8% on current plans | Off track |
| Plastics treaty (2022) | Treaty by end-2024 | No agreement yet | Lapsed |
| 30×30 (2022) | Protect 30% of land and sea by 2030 | 17.6% land, 8.4% ocean | In progress |
| India 50% non-fossil capacity | By 2030 | Reached June 2025 | Met early |
| India emissions intensity | 45% below 2005 by 2030 | 36% by 2020 | In progress |
| India carbon sink | 2.5-3 bn t by 2030 | 2.29 bn t by 2021 | In progress |
| Net zero (India 2070) | Net zero emissions | Interim targets only | Too early |
Plastics, Oceans and Biodiversity: The Moving Deadlines
Biodiversity. In 2010 countries agreed 20 “Aichi” targets for 2020. The UN’s Global Biodiversity Outlook 5 found that none was fully met. In December 2022 they were replaced by the Kunming-Montreal framework, whose best-known goal is to protect 30% of land and sea by 2030. The 2024 Protected Planet Report found 17.6% of land and 8.4% of ocean protected, so land coverage must nearly double and ocean coverage more than triple in six years. And protected on paper is not the same as healthy: less than 5% of protected land has been checked for how well it is managed.
Plastics. In March 2022 the UN Environment Assembly agreed to negotiate a global plastics treaty by the end of 2024. Talks in Busan (2024) and Geneva (August 2025) ended without a deal, and the chair resigned in October 2025. A new chair was elected in February 2026. Many countries have national rules instead: India banned 19 single-use plastic items from 1 July 2022.
Oceans. “Protect the oceans” is easy to promise and hard to measure: protected area, fish stocks, warming, acidification, coral and plastic all move separately. A bigger protected-area number does not by itself mean a healthier sea.
Why Some Pledges Work and Others Lapse
A specific problem
CFCs, lead in petrol, sulphur from power plants. You can list the substances and count them.
A number and a date
Montreal set phase-out schedules; India’s capacity target had a baseline, a share and a year.
An alternative
Industry had CFC substitutes. Where there is no cheap substitute, pledges stall.
Enforcement and money
The Clean Air Act had penalties; Montreal had trade rules and a fund for poorer countries.
No shared measure
Forest carbon, protected areas and “carbon neutral” claims are counted differently by different countries and companies.
Distant deadlines and politics
A 2050 or 2070 target outlasts governments. The US has now left the Paris Agreement twice, in 2020 and 2026.
Three Kinds of Environmental Promise
- The measurable treaty. Montreal: defined chemicals, schedules, reporting, money and amendments. Result: recovery you can see from space.
- The national target. India’s 50% capacity goal: a baseline, a number, a date. Result: met early, though the wider energy shift is far from done.
- The global aspiration. 1.5°C: scientifically meaningful, but reachable only if energy, transport, industry, farming, buildings and finance all move together.
Did You Know?
- Muskie’s day: Senator Edmund Muskie, the author of the 1970 Clean Air Act, spoke at the first Earth Day in Philadelphia.
- Climate bonus: the ozone treaty’s avoided emissions to 2010 were about five times the annual reductions Kyoto aimed for.
- Solar growth: India’s solar capacity rose from 2.82 GW in March 2014 to 150.26 GW in March 2026.
- July peak: in July 2025 renewables briefly met 51.5% of India’s electricity demand, a record.
- Same theme twice: “Our Power, Our Planet” was the Earth Day theme in both 2025 and 2026.
Test Yourself: Earth Day Pledges Quiz
1. Which agreement is behind the ozone layer’s recovery?
2. When was the first Earth Day?
3. When did Earth Day reach about 200 million people in 141 countries?
4. What does NDC stand for?
5. When did India pass 50% non-fossil installed capacity?
6. What share of India’s electricity did non-fossil sources generate in 2025-26?
7. What does emissions intensity measure?
8. When did the US exit from the Paris Agreement take effect?
Explore More Timelines
People Also Ask
Frequently Asked Questions
The Real Earth Day Test
“Protect the planet” is a slogan. “Phase out CFCs on a fixed schedule” is a policy. “50% non-fossil capacity by 2030” is a target. “Net zero by 2070” is a destination. None of these words guarantees anything. In 1970 the task was to demand environmental action; in 2026 it is to measure whether that action worked. The next big test is 2030, when the deadlines for forests, methane, 30×30, India’s capacity goals and the first round of Paris pledges all arrive together.
Related AiTimeline Stories
⚠️ Editorial Note
Statuses are AiTimeline’s reading of the latest official data: UNEP’s Emissions Gap Report 2025, the 2023 ozone assessment and 2025-26 ozone bulletins, EPA air trends, the Forest Declaration Assessment, the Global Methane Status Report, the Protected Planet Report, and Indian government releases (PIB, MNRE, CEA and India’s April 2026 NDC). For India’s emissions intensity and carbon sink we use the government’s latest published figures (36% by 2020; 2.29 billion tonnes by 2021), not the higher 2022 estimates that circulate online, which we could not match to an official source. The Paris rating judges the collective global path, not any single country. This is not policy or investment advice.
Sources & further reading
Every dated entry above was checked against these references. Last reviewed 30 September 2026.
- UNEP: Emissions Gap Report 2025 - Off Target (4 November 2025)
- UNEP Ozone Secretariat: 2025 Antarctic ozone hole among smallest in decades
- UNEP: Ozone layer recovery is on track, helping avoid global warming by 0.5C (2023 assessment)
- US EPA: Our Nation's Air - trends through 2024
- PIB: Cabinet approves India's Nationally Determined Contribution 2031-2035 (25 March 2026)
- UNFCCC: India's Nationally Determined Contribution (2031-2035), April 2026
- PIB: India ranks third globally in renewable energy installed capacity (8 April 2026)
- Forest Declaration Assessment 2025